Obesity inversely correlates with prostate-speci
fi
c
antigen levels in a population with normal screening
results of prostate cancer in northwestern China
J. Zhang
1, M. Ma
2, X. Nan
3and B. Sheng
2 1Nutrition Department, The First Affiliated Hospital of Medical School, Xi’an Jiaotong University, Xi’an, China 2
Geriatric Surgery Department, The First Affiliated Hospital of Medical School, Xi’an Jiaotong University, Xi’an, China 3
Urology Institute, The First Affiliated Hospital of Medical School, Xi’an Jiaotong University, Xi’an, China
Abstract
Serum prostate-specific antigen (PSA) is a diagnostic biomarker of prostate cancer and is possibly associated with obesity. This study aimed to explore the relationships between obesity indicators [body mass index (BMI) and waist circumference (WC)] with PSA in Chinese men. A cross-sectional study of men aged 30–85 years undergoing prostate cancer screening was conducted
from August 2008 to July 2013 in Xi’an, China. Data were obtained from clinical reports, condition was recorded based on self-report including demographics, weight, height, and WC (490 cm=obese). Fasting blood glucose (FBG) and prostate volume (PV) were assessed clinically. Patients were grouped by BMI (normal=22.9, overweight=23–27.4, obeseX27.5 kg/m2). PSA
parameters of density (PSAD), PSA serum level, and PSA increasing rate per year (PSAR) were calculated per BMI and age groups (30–40, 41–59, 60–85 years). Obesity indicators (BMI and WC) and PSA parameter relationships were modeled by
age-stratified linear regression. Of 35,632 Chinese men surveyed, 13,084 were analyzed, including 13.44% obese, 57.44% overweight, and 29.12% normal weight, according to BMI; 25.84% were centrally (abdominally) obese according to WC. BMI and WC were negatively associated with all PSA parameters, except PSAD and PSAR [Po0.05, BMI: b=–0.081
(95%CI=–0.055 to–0.036), WC:b=–0.101 (–0.021 to–0.015)], and independent of FBG and PV (Po0.05) in an age-adjusted
model. In conclusion, obesity was associated with lower PSA in Chinese men. Therefore, an individual’s BMI and WC should be considered when PSA is used to screen for prostate cancer.
Key words: Prostate-specific antigen; Body mass index; Obesity; Prostate cancer; Screening
Introduction
Prostate cancer is a leading cause of death among men and is the second most common cancer worldwide. In China, the incidence of prostate cancer has historically
remained relatively low compared to global figures,
estimated at about 33,000 cases per year, and anticipated
to increase to 449,000 cases by 2020, with 20,000
deaths each year (1). The age-standardized incidence rate in the Chinese population has been estimated at 28.1 per 100,000, with an associated age-standardized death rate of 5.5 per 100,000 people (2). In Beijing, China, the incidence of prostate cancer increased from 55.3 per million in 2001 to 166.2 per million in 2010, with an alarming average annual growth rate of 9.2% (3).
Rapid economic development and industrialization have brought changes in traditional diets and increasingly sedentary lifestyles, resulting in an increasing prevalence of obesity and obesity-related chronic diseases in China over the past decade. Obesity rates have nearly tripled
from 1991 (11.7%) to 2009 (29.2%) (4,5), based on a definition of obesity of people 427.5 kg/m2, as recom-mended by the World Health Organization (WHO) for the Asian population (6). Following this economic shift, the adult and pediatric patterns of obesity in China, as in other transitioning economies, have begun to more closely mirror the patterns observed in developed regions like the Unites States (4).
In addition to the effects of aging populations and increasing obesity rates, some studies have suggested that the increased prevalence of prostate cancer in the Chinese population might also be due to the wider implementation of improved, more sensitive prostate cancer screening in recent decades including the screen-ing for serum prostate-specific antigen (PSA) (7). Recent studies across Asian populations have, however, demon-strated that PSA is age-dependent and increases significantly for every decade of life (8). It has also been
Correspondence: B. Sheng:<[email protected]>
reported that PSA levels are negatively associated with body mass index (BMI), primarily as result of a hemodilu-tion effect caused by increased plasma volume (9,10). These relationships can affect the validity of PSA tests in prostate cancer screening, resulting in a high false positive rate in obese patients and some controversy over the use of PSA screening (11,12). Furthermore, the effects of age and obesity may be confounded by other related factors, such as fasting blood glucose (FBG) levels and prostate volume (PV), which have also been suggested to affect prostate cancer detection rates in Asian populations (13–16). Therefore, as the geriatric and obese populations are both increasing in China, there is an urgent need to better characterize the relationship between obesity and PSA parameters and to examine possible confounding effects in Chinese men undergoing prostate cancer screening.
Therefore, the objective of this study was to investi-gate the associations between obesity indicators [BMI and waist circumference (WC)] with FBG, PV, and PSA parameters [PSA serum level, PSA density (PSAD), and PSA increasing rate per year (PSAR)] in Chinese men undergoing physical exam routine screening, ultrasonog-raphy, and digital rectal examination (DRE). This study seeks to determine if obesity indicators and PSA param-eters are independent predictors of detection rates.
Material and Methods
General study design
In this retrospective analysis, 35,632 Chinese men aged 30 to 85 years undergoing abdominal ultrasonogra-phy examination for prostate screening as part of their routine physical exam at the Affiliated Hospital of the Medical School at Xi’an Jiaotong University (Xi’an, China) from August 2008 to July 2014 were included. This study was approved by the Ethics Committee of the above-mentioned hospital, and was conducted in accordance with the Institutional Ethics Committee requirements. The need for individual consent was waived by the committee because of the retrospective nature of the study.
Patient selection and data eligibility
All patients completed a survey at each visit, which is the routine practice at our institution. This survey helps to determine the life habits and risk factors for prostate cancer. Only data from the initial screening was consid-ered for patients with multiple visits. Data were excluded from the analysis if: i) incomplete or missing survey responses were observed for requiredfields;ii) history of prostate cancer or suspected prostate cancer, benign prostatic hyperplasia (BPH), prostatitis, current active infection of the prostate, and/or inflammation with abnor-mal urinalysis;iii) the participant had undergone a DRE in the 7 days prior to screening or had undergone a cystoscopy or prostate needle biopsy within 1 month prior
to screening; iv) the participant reported an age outside the 30–85 years window; v) the participant was taking
prostate medication such as finasteride (Proscars or
Propecias), which have been reported to affect PSA (9), or
vi) if the participant was observed to have FBG 415
mmol/L, BMIo17.5 kg/m2, and/or PSA415 ng/mL.
Data questionnaires
Data were collected from questionnaires containing questions about age, race, medication history, diabetes mellitus history, and prostate cancer history. Participants completed the questionnaires alone, and all responses were based on self-reported data. Measurement of height, weight, and WC were made at the hospital by a clinician during the medical examination. Age was validated using the identity card presented to the nurse.
Determination of clinical parameters
In addition to completing the questionnaire, partici-pants were asked to complete a screening panel including PSA, FBG, routine urinalysis, and DRE performed by a urologist at the site. Blood samples were collected after a 10-h fast from an antecubital vein. These samples were used to assay FBG and serum PSA prior to DRE. PSA analyses were done using the test Total PSA (Roche Diagnostics, Switzerland) on a Modular E-Modul System (Roche Diagnostics). FBG analyses were done using the glucose oxidase method from DiaSys Diagnostic Systems GmbH (Germany). All measurements were done in a central laboratory in a blind fashion, and according to the
manufacturer’s instructions. PV was determined by
ultrasonography using the formula for an elliptic volume [(p/6)heightwidthlength]. In the Xi’an area, trans-rectal ultrasound is not part of the routine screening tests for prostate cancer. PSA density was calculated as serum PSA (ng/mL) divided by PV (mL). PSAR was calculated as serum PSA (ng/mL) divided by age (years) (17).
Determination of obesity factors
An HW-900Y ultrasonic wave height and weight scale (Jiangsu Hengfeng weighting, China) was used tofind the height and weight of all patients. BMI was calculated as weight in kilograms divided by squared height in meters
(kg/m2). WC was measured using a flexible,
according to the WHO criteria for Asian populations (6), where patients with BMIo22.9 kg/m2were considered in the normal range, 23–27.5 kg/m
2
were considered
over-weight, and X27.5 kg/m2 were considered obese.
Accordingly, abdominal (central) obesity was classified
as WC490 cm.
Statistical analysis
Data were analyzed with SPSS 17.0 (IBM, USA) and
reported as means±SD for continuous variables and
frequencies (%) for categorical variables. Student’st-test and ANOVA were used to compare continuous variables and categorical variables, respectively. PSA levels were tested for normality and followed a normal distribution. Mean (±SD) PSA levels were calculated per BMI groups (normal range, overweight, and obese) and age groups (30–40, 41–59, and 60–85 years). Associations between obesity factors (BMI, WC) and PSA parameters (PSA level, PSAD, PSAR) were examined by linear regression models and stratified by age. As men with an elevated FBG (4110 mg/dL) have been shown to be more likely to have an enlarged prostate than men with normal FBG (15), this factor was also adjusted for in the linear
regression model. A P value o0.05 was considered to
be statistically significant.
Results
Characteristics of the men
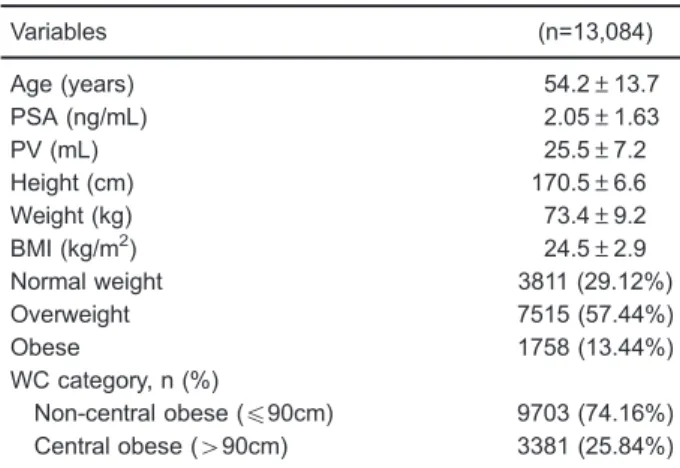
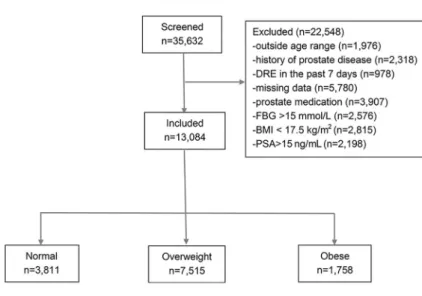
Of the 35,632 Chinese men surveyed, 13,084 were included in thefinal analysis (Table 1 and Figure 1). Mean
age was 54.2±13.7 (range 30 to 85) years; mean
BMI was 24.5±2.9 kg/m2, and mean PSA was 2.05±
1.63 ng/mL. Using BMI, participants were classified as 29.12% in the normal range (n=3811), 57.44% as over-weight (n=7515), and 13.44% as obese (n=1758). Using WC, 25.84% (n=3381) of the participants were classified as being abdominally obese, and the remaining patients were classified as normal (n=9703). No significant differences in age were observed between BMI groups across age groups.
BMI effects on PSA parameters and PV by age group Mean age, FBG, PSA, PV, PSAD, and PSAR are shown for BMI groups (normal range, overweight, and obese) by age (p40, 41–59, and 60–85 years) in Table 2. In all age groups, obese and overweight men (based on BMI) exhibited significantly lower serum PSA, PSAD, and PSAR than patients within the normal range (all Po0.05). Obese men also exhibited significantly higher PV and FBG levels (all Po0.005).
WC effects on PSA parameters and PV by age group Mean age, FBG, PSA, PV, PSAD, and PSAR are
shown for normal vs abdominally obese by age in
Table 3. There were no significant differences in age between the abdominally obese or normal patients by WC. For all age groups, abdominally obese men exhi-bited significantly lower serum PSA, PSAD, and PSAR
(all Po0.05) compared with normal patients. For age
groups 30–40 and 41–59, obese men also exhibited
significantly higher FBG and PV levels (all Po0.01). In men aged 60–85, and compared top40 and 41–59 signi-ficantly higher FBG levels were observed (Po0.001), but not PV.
Linear regression for obesity factors (BMI and WC) and PSA parameters, stratified by age
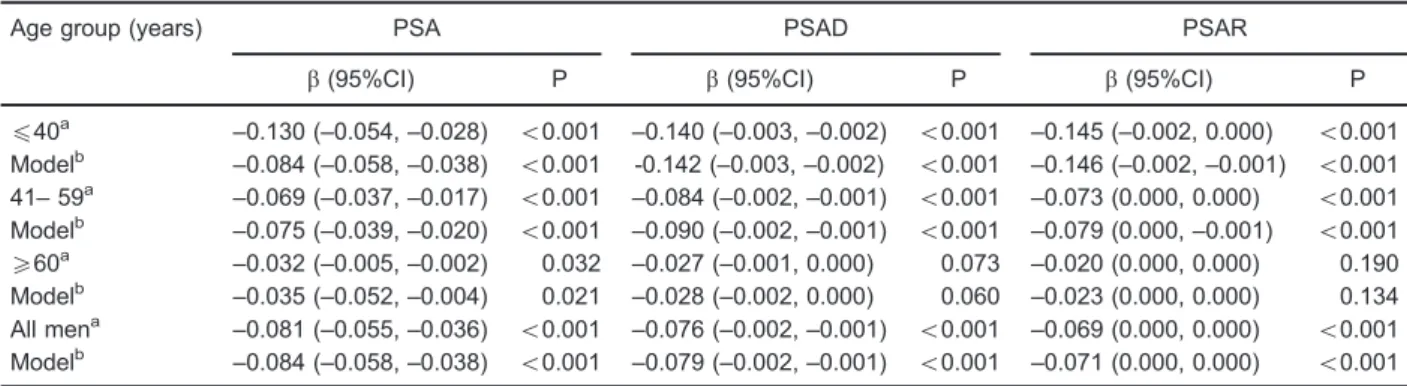
Linear regression results for BMI and PSA parameters was obtained and stratified by age, revealing that from ages p40 and 41–59, BMI was significantly associated
with lower PSA, PSAD, and PSAR (all Po0.001), which
remained significant when adjusted for FBG. Similarly, in men aged 60–85 years, BMI was significantly associated with lower PSA levels (P=0.032), and was found to be independent of FBG (P=0.021; Table 4). Linear regression revealed similar results for WC and PSA, stratified by age (Table 5).
Discussion
In a cross-sectional analysis of a large asymptomatic Chinese prostate screening population (n=13,084), it was observed that obese men exhibited consistently lower PSA parameters including PSA, PSAD, and PSAR. Furthermore, in all age groups surveyed from age 30 to 85 years, BMI and WC were inversely associated with serum PSA, PSAD, and PSAR levels independent of FBG and PV.
Table 1.Characteristics of study participants included in analysis.
Variables (n=13,084)
Age (years) 54.2±13.7
PSA (ng/mL) 2.05±1.63
PV (mL) 25.5±7.2
Height (cm) 170.5±6.6
Weight (kg) 73.4±9.2
BMI (kg/m2) 24.5±2.9
Normal weight 3811 (29.12%)
Overweight 7515 (57.44%)
Obese 1758 (13.44%)
WC category, n (%)
Non-central obese (p90cm) 9703 (74.16%) Central obese (490cm) 3381 (25.84%)
Data are reported as means±SD or number and percentage. BMI limits for weight category:o22.9 kg/m2(normal), 23–27.5 kg/m
2
Although the relationship between obesity and PSA in prostate cancer remains controversial, previous studies have demonstrated an inverse relationship between serum PSA levels and obesity factors like BMI and WC in other populations of the world (8,19,20). Among 3000
healthy men examined in the San Antonio Center for Biomarkers of Risk of Prostate Carcinoma (SABOR) trial, it was reported that high BMI was associated with lower PSA levels after controlling for age and race (19). Similarly, two recent studies of Asian populations also
Figure 1.Flowchart of the included men.
Table 2.Prostate parameter data by BMI and age of analyzed participants (n=13,084).
Normal Overweight Obese P
30–40 years (n=2,291)
Age (years) 34.94±3.03 35.34±3.19 35.14±3.11 0.432 FBG (mmol/L) 5.06±0.61 5.25±0.82b 5.43±0.86b o0.001 PSA (ng/mL) 1.84±1.09 1.67±1.01b 1.45±0.75b 0.001 PV (mL) 21.45±4.42 21.45±4.21 22.48±5.11b 0.001 PSAD10-2(ng/mL2) 8.78±5.32 7.98±5.01b 0.067±0.04b
o0.001 PSAR10-2(ngmL-1year-1) 5.45±3.4 4.77±3.0b 4.17±2.23b
o0.001 41–59 years (n=6,389)
Age (years) 50.17±5.56 50.23±5.25 50.19±5.51 0.928 FBG (mmol/L) 5.28±1.16 5.55±1.29b 5.73±1.37b o0.001 PSA (ng/mL) 1.83±1.05 1.79±1.17 1.57±0.7b
o0.001 PV (mL) 23.48±6.19 2367±6.17 24.62±6.45b o0.001 PSAD10-2(ng/mL2) 8.18±4.94 7.94±5.21 6.76±3.68b
o0.001 PSAR10-2(ngmL-1year-1) 3.68±2.131 3.58±2.26 3.15±1.54b o0.001 60–85 years (n=4,404)
Age (years) 70.13±6.90 69.42±6.58 68.38±6.58 0.098 FBG (mmol/L) 5.61±1.43 5.83±1.53b 6.11±1.52b 0.001 PSA (ng/mL) 2.70±2.30 2.64±2.26 2.38±2.07a 0.026 PV (mL) 30.03±7.78 29.63±7.76 28.76±7.89b 0.009 PSAD10-2(ng/mL2) 9.25±7.57 9.09±7.43 8.42±6.65 0.110 PSAR10-2(ngmL-1year-1) 3.78±3.1 3.77±3.1 3.42±2.78 0.071 Data are reported as means±SD.aPo0.05,bPo0.01: significant difference between overweight, obese, and normal weight. BMI limits for weight category:o22.9 kg/m2(normal), 23
–27.5 kg/m
2(overweight),
X27.5 kg/m2(obese). FBG: fasting blood glucose; PSA: prostate-speci
reported an inverse association between BMI and PSA (8,20). Notably, the study conducted in a Korean popula-tion found an inverse associapopula-tion in men younger than 60 years, further suggesting possible effects of age and
health on prostate cancer detection rates by PSA level. Compared to previous studies, the current study included a much larger sample size and was able to control for other factors including FBG and PV. In addition,
Table 3.Prostate parameter data by central obesity (CO) based on waist circumference490 cm and age (n=13,084).
30–40 years (n=2,291) 41–59 years (n=6,389) 60–85 years (n=4,404)
Non-CO CO P Non-CO CO P Non-CO CO P
Age (years) 35.74±3.02 35.39±3.17 0.561 50.62±5.62 50.66±5.6 0.756 70.76±6.18 69.58±6.23 0.084 FBG (mmol/L) 5.14±0.73 5.37±0.83 o0.001 5.45±1.25 5.66±1.34 o0.001 5.573±1.47 6.04±1.68 o0.001 PSA (ng/mL) 1.76±1.03 1.56±0.96 o0.001 1.82±1.14 1.64±0.95 o0.001 2.67±2.3 2.41±2.03 o0.001 PV (mL) 21.33±4.22 22.16±4.87 o0.001 23.63±6.22 24.07±6.22 0.01 29.78±7.74 29.21±7.98 o0.001 PSAD10-2(ng/mL2) 8.42±5.04 7.29±4.74 o0.001 8.09±5.21 7.17±4.27 o0.001 9.21±7.58 8.44±6.49 0.004
PSAR10-2 (ngmL-1year-1)
5.12±3.14 4.45±2.81 o0.001 3.62±2.24 3.35±1.89 o0.001 3.79±3.13 3.45±2.72 0.002
Data are reported as means±SD. FBG: fasting blood glucose; PSA: prostate-specific antigen; PV: prostate volume; PSAD: PSA parameters of density; PSAR: PSA increasing rate per year. Data analysis was performed with ANOVA.
Table 4.Regression results for associations of prostate parameters with age (years) and body mass index (BMI), adjusted for fasting blood glucose (FBG).
Age group (years) PSA PSAD PSAR
b(95%CI) P b(95%CI) P b(95%CI) P
p40a
–0.130 (–0.054,–0.028) o0.001 –0.140 (–0.003,–0.002) o0.001 –0.145 (–0.002, 0.000) o0.001 Modelb
–0.084 (–0.058,–0.038) o0.001 -0.142 (–0.003,–0.002) o0.001 –0.146 (–0.002,–0.001) o0.001 41–59
a
–0.069 (–0.037,–0.017) o0.001 –0.084 (–0.002,–0.001) o0.001 –0.073 (0.000, 0.000) o0.001 Modelb
–0.075 (–0.039,–0.020) o0.001 –0.090 (–0.002,–0.001) o0.001 –0.079 (0.000,–0.001) o0.001
X60a –0.032 (–0.005,–0.002) 0.032 –0.027 (–0.001, 0.000) 0.073 –0.020 (0.000, 0.000) 0.190 Modelb
–0.035 (–0.052,–0.004) 0.021 –0.028 (–0.002, 0.000) 0.060 –0.023 (0.000, 0.000) 0.134 All mena –0.081 (–0.055,–0.036) o0.001 –0.076 (–0.002,–0.001) o0.001 –0.069 (0.000, 0.000) o0.001 Modelb
–0.084 (–0.058,–0.038) o0.001 –0.079 (–0.002,–0.001) o0.001 –0.071 (0.000, 0.000) o0.001
aCrude model;bmodel adjusted for FBG. One point increase in BMI corresponds to an expected change in PSA, PSAD and PSAR equal to the reported beta-coefficients (b). PSA: prostate-specific antigen; PSAD: PSA parameters of density; PSAR: PSA increasing rate per year.
Table 5.Regression results for associations between prostate parameters with age (years) and waist circumference (WC), adjusted for fasting blood glucose (FBG).
Age group (years) PSA PSAD PSAR
b(95%CI) P b(95%CI) P b(95%CI) P
p40a
–0.128 (–0.016,–0.008) o0.001 –0.137 (0.000, 0.000) o0.001 –0.151 (0.000, 0.000) o0.001 Modelb –0.129 (–0.017,–0.009) o0.001 –0.139 (0.000, 0.000) o0.001 –0.152 (0.000, 0.000) o0.001 41–59a –0.074 (–0.012,–0.006) o0.001 –0.081 (0.000, 0.000) o0.001 –0.058 (0.000, 0.000) o0.001 Modelb –0.080 (–0.013,–0.007) o0.001 –0.088 (0.000, 0.000) o0.001 –0.064 (0.000, 0.000) o0.001
X60a
–0.032 (–0.015, 0.000) 0.036 –0.027 (0.000, 0.000) 0.074 –0.019 (0.000, 0.000) 0.202 Modelb –0.033 (–0.015, 0.000) 0.028 –0.028 (0.000, 0.000) 0.069 –0.021 (0.000, 0.001) 0.159 All mena
–0.101 (–0.021,–0.015) o0.001 –0.079 (0.000, 0.000) o0.001 –0.053 (0.000, 0.000) o0.001 Modelb
–0.103 (–0.022,–0.015) o0.001 –0.082 (0.000, 0.000) o0.001 –0.055 (0.000, 0.000) o0.001
the inverse relationship between BMI and WC, with PSA was clearly observed in Chinese men with age ranges from 30 to 85 years in this study.
Some researchers have suggested a hemodilution hypothesis for the association between BMI and PSA levels, which suggests that obesity increases plasma volume and hemodilution, thus reducing the circulating PSA levels (21). This hypothesis is based on the premise that blood PSA concentration is a function of plasma volume, as well as PSA expression and PSA leakage into the circulatory tract (22). Alternatively, another theory has been proposed whereby PSA is influenced by steroid hormone levels, referred to as the "steroid hormone metabolism hypothesis" (22). It is also highly likely that obesity influences PSA level through multiple pathways. Obesity could potentially alter the levels of multiple hormones and growth factors (e.g., testosterone, estro-gen, leptin, insulin, and IGF-1) with competing effects on prostate growth and size (23). For obese individuals, a high amount of adipose tissue could improve aromatase activity to make cyclic estrogen levels increase (24). This result may be due to regulation via androgens and estradiol from adipose tissues.
In this study, inverse associations were observed between obesity factors and PSA, PSAD, and PSAR after adjustment for FBG. Simultaneously, this study also revealed the novel finding that abdominal obesity deter-mined using WC may indeed have no appreciable effects on serum PSA levels after age adjustment. Furthermore, PSAD and PSAR levels were detectable with similar relationships in Chinese men older than 60 years undergoing prostate cancer screening, an age group well known for its high prostate cancer incidence. The presence of overweight or obesity should not influence the decision to perform PSA screening. Notably, these results confirm that screening PSA levels would not be unrealistic in this population.
Despite these encouraging results, it is important to note the limitations of these findings. In clinical practice, this significant negative correlation between obesity factors and PSA might be influenced by a number of factors present in diverse general screening populations. For instance, in a prospective cohort study of Caucasian men aged 40–79 years, serum PSA levels increased at a rate of 3.6% per year, with older men exhibiting more rapid increases in serum PSA compared to younger men, and men without diabetes exhibiting more rapid increases in serum PSA levels compared to men with diabetes (25). Hypertension, however, was not associated with alterations in serum PSA levels. Thus, prostate screening in the elderly may be subject to age effects but not specifically to obesity, which cannot be directly extrapolated to varied populations. Additionally, BPH and chronic urinary tract infection may affect serum PSA levels (25). In this present study, BMI and WC had weak effects on PV, and increases in PV may have resulted from BPH or prostatitis, which were excluded from this study. In obese men aged460 years, a high frequency
of untreated BPH might result from the limited access to treatment for some medical conditions in northwest China, which are related to the lack of early detection and prostate disease information for patients, long-term alcohol abuse, and chronic urinary tract infection that produce conflicting results in studies of obesity and BPH (26–28). As BPH is
common in men450 years old (about 60% of men aged
450 years have histological evidence of BPH, increasing to 80% after age 70 (29)), this study may be limited because these factors were not comprehensively tested, nor were results in Chinese populations compared directly to those of other regions. Another important consideration for these results is the use of different BMI values in Asian populations to define obesity than in Western populations (6). A lower cut-off BMI value of 27.5 is commonly used in Asian populations compared to the more common cut-off of 30. This is because adverse effects due to obesity are considered to occur at lower BMI in Asian populations, but this issue remains controversial (6). In addition, this study did not control for ethnicities, lifestyle, or functional sex hormone levels, which may play a role in prostate cancer development and detection, potentially altering PSA levels (30–33). Finally, only FBG was used as a marker for obesity-related diabetes because it is routinely measured and is inexpensive. Future studies could measure other markers such as insulin levels and IGF-1. Further large cohort studies are required in the future to test the consistency of these results between different populations and with consideration for other commonly encountered clinical factors. Despite these limitations, the large sample size, power of the results,
and novel findings add knowledge to the current
under-standing of the relationships between obesity and PSA screening for prostate cancer. The relationship between obesity markers and other markers of prostate cancer should also be studied in the future.
In conclusion, this study revealed that obesity factors (BMI and WC) were associated with lower PSA levels in asymptomatic Chinese men aged 30 to 85 years undergoing routine prostate cancer screening, and these factors were independent of FBG and PV. When PSA is used to screen for prostate cancer, BMI must be taken into account to avoid misdiagnosis, especially in aged populations; however, when screening subjects older than 60 years, the PSA test may still be considered as an appropriate screening tool for prostate cancer in overweight and obese patients.
Acknowledgments
References
1. Ferlay J, Shin HR, Bray F, Forman D, Mathers C, Parkin DM. Estimates of worldwide burden of cancer in 2008: GLOBOCAN 2008. Int J Cancer 2010; 127: 2893–2917, doi: 10.1002/ijc.25516.
2. Hong Kong Cancer Registry. Fast stats for prostate cancer 2010. http://www3.ha.org.hk/cancereg/e_stat.asp. Accessed May 14, 2015.
3. Xiang AL, Feng JW, Ye HR, Chang Y, Ye FL. Meta-analysis of obesity and prostate cancer.Occup and Health2012; 28: 154156.
4. Wang Y, Mi J, Shan XY, Wang QJ, Ge KY. Is China facing an obesity epidemic and the consequences? The trends in obesity and chronic disease in China.Int J Obes2007; 31: 177–188, doi: 10.1038/sj.ijo.0803354.
5. Gordon-Larsen P, Wang H, Popkin BM. Overweight dynamics in Chinese children and adults.Obes Rev2014; 15 (Suppl 1): 37–48, doi: 10.1111/obr.12121.
6. WHO Expert Consultation. Appropriate body-mass index for Asian populations and its implications for policy and intervention strategies. Lancet 2004; 363: 157–163, doi: 10.1016/S0140-6736(03)15268-3.
7. Hegarty NJ, Fitzpatrick JM, Richie JP, Scardino PT, Vere White RW, Schroder FH, et al. Future prospects in prostate cancer.Prostate1999; 40: 261–268, doi: 10.1002/ (SICI)1097-0045(19990901)40:4o261::AID-PROS843.0.CO; 2-H.
8. Chia SE, Lau WK, Cheng C, Chin CM, Tan J, Ho SH. Prostate-specific antigen levels among Chinese, Malays and Indians in Singapore from a community-based study. Asian Pac J Cancer Prev2007; 8: 375–378.
9. Choi HC, Park JH, Cho BL, Son KY, Yoo YJ, Kwon HT. The illusion of prostate-specific antigen decline in patients with metabolic syndrome and insulin resistance.BJU Int2011; 108: 1756–1761, doi: 10.1111/j.1464-410X.2011.10225.x. 10. Naito M, Asai Y, Mori A, Fukada Y, Kuwabara M, Katase S,
et al. Association of obesity and diabetes with serum prostate-specific antigen levels in Japanese males.Nagoya J Med Sci2012; 74: 285–292.
11. Qu X, Huang Z, Meng X, Zhang X, Dong L, Zhao X. Prostate volume correlates with diabetes in elderly benign prostatic hyperplasia patients.Int Urol Nephrol2014; 46: 499–504, doi: 10.1007/s11255-013-0555-3.
12. Benson MC, Whang IS, Pantuck A, Ring K, Kaplan SA, Olsson CA, et al. Prostate specific antigen density: a means of distinguishing benign prostatic hypertrophy and prostate cancer.J Urol1992; 147: 815–816.
13. Wu YS, Na R, Xu JF, Bai PD, Jiang HW, Ding Q. The influence of prostate volume on cancer detection in the Chinese population.Asian J Androl2014; 16: 482–486, doi: 10.4103/1008-682X.122581.
14. Lee S, Min HG, Choi SH, Kim YJ, Oh SW, Kim YJ, et al. Central obesity as a risk factor for prostatic hyperplasia. Obesity2006; 14: 172–179, doi: 10.1038/oby.2006.21. 15. Parsons JK, Carter HB, Partin AW, Windham BG, Metter EJ,
Ferrucci L, et al. Metabolic factors associated with benign prostatic hyperplasia. J Clin Endocrinol Metab 2006; 91: 2562–2568, doi: 10.1210/jc.2005-2799.
16. Sarma AV, Jaffe CA, Schottenfeld D, Dunn R, Montie JE, Cooney KA, et al. Insulin-like growth factor-1, insulin-like
growth factor binding protein-3, and body mass index: clinical correlates of prostate volume among Black men. Urology2002; 59: 362–367, doi: 10.1016/S0090-4295(01) 01546-1.
17. Hoffman RM, Clanon DL, Littenberg B, Frank JJ, Peirce JC. Using the free-to-total prostate-specific antigen ratio to detect prostate cancer in men with nonspecific elevations of prostate-specific antigen levels.J Gen Intern Med2000; 15: 739–748, doi: 10.1046/j.1525-1497.2000.90907.x. 18. Mason C, Katzmarzyk PT. Variability in waist circumference
measurements according to anatomic measurement site. Obesity2009; 17: 1789–1795, doi: 10.1038/oby.2009.87. 19. Baillargeon J, Pollock BH, Kristal AR, Bradshaw P,
Hernandez J, Basler J, et al. The association of body mass index and prostate-specific antigen in a population-based study. Cancer2005; 103: 1092–1095, doi: 10.1002/cncr.20856. 20. Kim YJ, Han BK, Hong SK, Byun SS, Kim WJ, Lee SE.
Body mass index influences prostate-specific antigen in men younger than 60 years of age. Int J Urol2007; 14: 1009–1012, doi: 10.1111/j.1442-2042.2007.01879.x. 21. Kubota Y, Seike K, Maeda S, Shinohara Y, Iwata M,
Sugimoto N. Relationship between prostate-specific antigen and obesity in prostate cancer screening: analysis of a large cohort in Japan.Int J Urol2011; 18: 72–75, doi: 10.1111/ j.1442-2042.2010.02667.x.
22. Fowke JH, Matthews CE. PSA and body composition by dual X-ray absorptiometry (DXA) in NHANES. Prostate 2010; 70: 120–125.
23. Skolarus TA, Wolin KY, Grubb RL III. The effect of body mass index on PSA levels and the development, screening and treatment of prostate cancer.Nat Clin Pract Urol2007; 4: 605–614, doi: 10.1038/ncpuro0944.
24. Castro-Fernandez C, Olivares A, Soderlund D, Lopez-Alvarenga JC, Zambrano E, Veldhuis JD, et al. A pre-ponderance of circulating basic isoforms is associated with decreased plasma half-life and biological to immunological ratio of gonadotropin-releasing hormone-releasable luteiniz-ing hormone in obese men.J Clin Endocrinol Metab2000; 85: 4603–4610.
25. Wallner LP, Morgenstern H, McGree ME, Jacobson DJ, St Sauver JL, Jacobsen SJ, et al. The effects of type 2 diabetes and hypertension on changes in serum prostate specific antigen levels: results from the Olmsted County study. Urology2011; 77: 137–141, doi: 10.1016/j.urology. 2010.07.516.
26. Kristal AR, Arnold KB, Schenk JM, Neuhouser ML, Weiss N, Goodman P, et al. Race/ethnicity, obesity, health related behaviors and the risk of symptomatic benign prostatic hyperplasia: results from the prostate cancer prevention trial. J Urol2007; 177: 1395–1400, doi: 10.1016/j.juro.2006.11.065. 27. Laven BA, Orsini N, Andersson SO, Johansson JE, Gerber GS, Wolk A. Birth weight, abdominal obesity and the risk of lower urinary tract symptoms in a population based study of Swedish men.J Urol2008; 179: 1891–1895, doi: 10.1016/ j.juro.2008.01.029.
29. Ozden C, Ozdal OL, Urgancioglu G, Koyuncu H, Gokkaya S, Memis A. The correlation between metabolic syndrome and prostatic growth in patients with benign prostatic hyperplasia. Eur Urol2007; 51: 199–203, doi: 10.1016/j.eururo.2006.05.040. 30. Yin XJ, Jiao SF, Wang Y, Li YP, Li X, Cui ZH, et al. Epidemiological study on obesity and the relationship between obesity and chronic disease in beijing urban area
–a community-based study.Chin Prey Med2003; 4: 23–27. 31. Blouin K, Despres JP, Couillard C, Tremblay A, Prud’homme D, Bouchard C, et al. Contribution of age and declining androgen levels to features of the metabolic syndrome in
men. Metabolism 2005; 54: 1034–1040, doi: 10.1016/ j.metabol.2005.03.006.
32. Low S, Chin MC, Ma S, Heng D, Deurenberg-Yap M. Rationale for redefining obesity in Asians. Ann Acad Med Singapore2009; 38: 66–69.