Abstract
Objective: To analyze adiposity changes in school-age children over a 20 year-period, according to nutritional status.
Methods: The study is part of the Ilhabela Longitudinal Mixed Project on Growth, Development and Physical Fitness. A sample of 1,095 school students of both sexes, from 7 to 10 years, met the following inclusion criteria: (a) at least one complete assessment in one of the analyzed periods; (b) to be in prepubertal stage of sexual maturation; (c) to be apparently healthy. The periods analyzed were 1990/1991 (initial), 2000/2001 (10 years) and 2010/2011 (20 years). The variables analyzed were: body weight, height and adiposity through individual analysis of each skinfold. Children were classiied as eutrophic, overweight and obese, according to the curves of body mass index for age and sex proposed by the World Health Organization. The statistical analysis used was one-way ANOVA, followed by Scheffé’s post-hoc test, with p < 0.01.
Results: In boys, the largest increase occurred in the overweight group, followed by the obese and eutrophic groups. In girls, the largest increases occurred in the groups with overweight and eutrophic children, followed by the obese group.
Conclusion: During the 20-year period analyzed, there were changes in adiposity, even when the nutritional status was controlled, showing that individuals who have similar body mass indexes may vary in proportion and distribution of subcutaneous adipose tissue. In both sexes, the increase was higher in the overweight group, and mainly in central skinfolds.
J Pediatr (Rio J). 2012;88(3):239-45: Skinfolds thickness, adipose tissue, school-age children.
O
riginala
rticleCopyright © by Sociedade Brasileira de Pediatria
239 Introduction
In some countries, demographic, socioeconomic and epidemiological changes led to alterations in nutritional patterns, increasing significantly the prevalence of overweight and obesity, a phenomenon described as nutritional transition.1,2 Several factors, such as changes in lifestyle, feeding and stress increase, associated to the technological, economic and social advance over the
last decades, led to an increase in obesity worldwide, representing a public health problem.3 In 2009, one out of every 3 children from 5 to 9 years old was overweight. Excess weight was observed in 33.5% of Brazilian children, considering that 16.6% of boys and 11.8% of girls were obese. These numbers represent an increase in the prevalence of excess weight in children over 34 years,
Modiications of adiposity in school-age children
according to nutritional status: a 20-year analysis
Tatiane K. Ferrari,1 Gerson Luis de M. Ferrari,1 João Pedro da Silva Júnior,2Leonardo José da Silva,3 Luís C. Oliveira,3 Victor K. R. Matsudo4
1. Master’s candidate, Centro de Estudos do Laboratório de Aptidão Física de São Caetano do Sul (CELAFISCS), São Caetano do Sul, SP, Brazil. 2. CELAFISCS, São Caetano do Sul, SP, Brazil.
3. MSc. CELAFISCS, São Caetano do Sul, SP, Brazil.
4. Tenured professor. CELAFISCS, São Caetano do Sul, SP, Brazil.
No conflicts of interest declared concerning the publication of this article.
Financial support: Fundação de Amparo à Pesquisa do Estado de São Paulo (FAPESP), protocol no. 2010/20749-8.
Suggested citation: Ferrari TK, Ferrari GL, da Silva Jr JP, da Silva LJ, Oliveira LC, Matsudo VK. Modifications of adiposity in school-age children according to nutritional status: a 20-year analysis. J Pediatr (Rio J). 2012;88(3):239-45.
Manuscript submitted Dec 21 2011, accepted for publication Mar 9 2012.
with an incidence of 10.9% in 1974-1975, 15% in 1989 and 34.8% in 2008-2009 in boys and 8.6% in 1975-1975, 11.9% in 1989 and 32% in 2008-2009 in girls.4
The early development of chronic non-communicable diseases, such as cardiovascular disease, hypertension, elevated levels of low-density lipoproteins, among others, is associated with high levels of adiposity.5 Some evidence indicates that the period of greatest risk for the incidence of obesity is the transition between adolescence and the early stages of adulthood, in both sexes and in various ethnic groups.6
Some international and other Bazilian studies have presented results of adiposity changes over the years, once it has been through modiications.7-9 Studies suggest that the variation of the anatomic distribution of body fat is an important morphologic indicator, related to endocrinal and metabolic complications predisposing to the onset and development of cardiovascular diseases.10 Individuals with centripetal disposition of body fat tend to have higher incidence of diabetes,11,12 hypertension,13 metabolic syndrome and adverse changes in plasma lipoprotein proile.14-16 Although central obesity is strongly associated with a range of morbidities, there are few studies that seek to prove this distribution of body fat. Thus, the purpose of this study was to analyze the adiposity changes of school-age children for 20 years, according to the nutritional status.
Methods
The present study is part of the Ilhabela Longitudinal Mixed Project on Growth, Development and Physical itness, developed by the Study Center of the Physical Fitness Laboratory of São Caetano do Sul (CELAFISCS) since 1978, aiming to study and monitor the growth, development and physical itness of students in the municipality of Ilhabela (state of São Paulo), Brazil, which has a population of 28,176 inhabitants and a territorial area of 348 km2.17 This is the only longitudinal project conducted in developing countries, whose main feature is the use of unsophisticated materials, easy techniques and simplicity on a method that allows high applicability in large groups.18 The project conducts an assessment every six months, always in April and October, totalizing 65 assessments and 18,000 records to date, including anthropometric measures and neuromotor, metabolic, postural and physical activity level testing.
To compose the study sample, we performed an analysis of a database consisting of over 16,000 school-age children of both sexes, aged 7-18 years, who participated in the evaluations between 1978 and 2011, in which 1,094 children of both sexes, met the following inclusion criteria: (a) at least one complete assessment during one of the analyzed periods; (b) to be in prepubertal stage of sexual maturity; (c) to be apparently healthy.
The project was approved by the Research Ethics Committee of the Universidade Federal de São Paulo (UNIFESP) under protocol number 0056/10, and all the individuals had the term of informed consent signed by parents or guardians. The students participated in the evaluations of the period analyzed, and the selected data are part of a database of 1990/1991 (initial), 2000/2001 (10 years) and 2010/2011 (20 years).
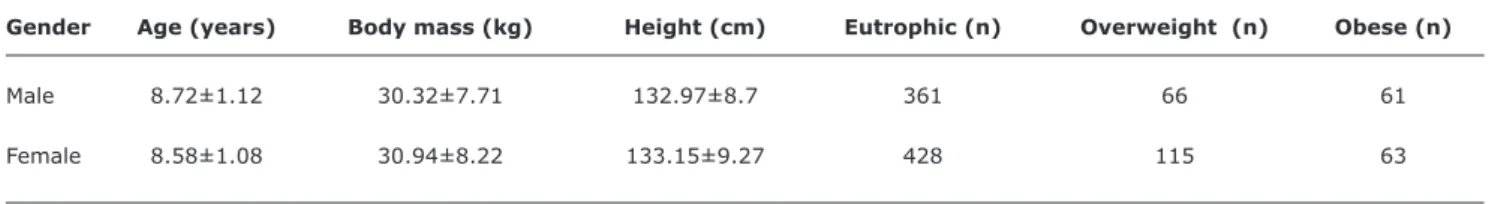
The variables analysed were: body mass (kg), height (cm) and adiposity (mm) from the individual analysis of each skinfold (SF), according to the CELAFISCS19 standardization. The characterization of the sample participating in the study is presented in Table 1.
Measurement of body mass (kg) was obtained using a 100-gram-sensitivity digital scale, with the individual wearing the minimum clothing possible. Height (cm) was measured with a stadiometer and calculated as the mean of three measurements. To calculate body mass index (BMI), the two latter measures were used, classifying the individuals as eutrophic, overweight and obese, according to the curves of BMI for age and gender proposed by the World Health Organization (WHO).20 This classiication has been used to identify the risk or the actual condition of obesity in populations.1,8,13 However, there are other criteria for the identiication of changes in nutritional status related to adiposity. One of the methods used for this purpose is the measurement of SFs, once it has presented signiicant changes in the adiposity pattern.9,18 The present study sought to ind matches or differences in the use of these different methods in the same population, since the method may be giving erroneous interpretations regarding the classiication, not effectively showing changes in the phenomenon.
Adiposity (mm) was obtained by the determination of seven SFs (biceps, triceps, subscapular, suprailiac, mid-axillary, abdomen and calf), which were performed by the same evaluator in all assessments of the project. The measurements were performed in the right side of the body, and three successive measurements were performed in the same location, considering the mean of three as the value adopted. The skinfold caliper used was the Harpenden® previously calibrated.
The objectivity and reproducibility values of each measurement taken between the years ranged from 0.96 to 0.99 in body mass, 0.97 to 0.99 in height and 0.81 to 0.99 in SFs.
To determine the stage of biologic maturation, the Tanner21 method was used, by means of the technique of self-assessment of secondary sexual characteristics according to sex, already validated (0.60 to 0.71) in the Ilhabela Project.22
Gender Age (years) Body mass (kg) Height (cm) Eutrophic (n) Overweight (n) Obese (n)
Male 8.72±1.12 30.32±7.71 132.97±8.7 361 66 61
Female 8.58±1.08 30.94±8.22 133.15±9.27 428 115 63
Table 1 - Characterization of the sample according to sex, regardless of the period analyzed
Kolmogorov-Smirnov analysis was performed. For the parametric data, we used the one-way Anova followed by Scheffé’s post-hoc test. To check the magnitude of the difference between the initial period and the 20-year period, a delta percentage (∆%) was calculated. The level of signiicance adopted was p < 0.01. The software used was the Statistical Package for the Social Sciences (SPSS) version 18.0.
Results
Table 2 shows that there was an increase in all variables analyzed, except for triceps and calf skinfolds in males. In males, height and mid-axillar SFs were signiicantly (p < 0.01) different during the 20-year period and underwent a linear increase over the years. The largest increases in males occurred in mid-axillary and abdomen SFs.
In women, body mass was signiicantly (p < 0.01) different in the period between 10 and 20 years. SF thicknesses of triceps and calf were signiicantly (p < 0.01) different between the initial period and in 10 years and declined over the years. Subscapular, suprailiac, mid-axillary, abdomen SFs and X7SF (mean adiposity of the seven SFs studied) were signiicantly (p < 0.01) different and increased in the 20-year period. Triceps, suprailiac, mid-axillary, abdomen, calf and X7SF SFs were signiicantly (p < 0.01) different during the period between 10 and 20 years. The largest increases occurred in the mid-axillary (26.6%), suprailiac (32.9%) and abdomen (51.2%) SFs.
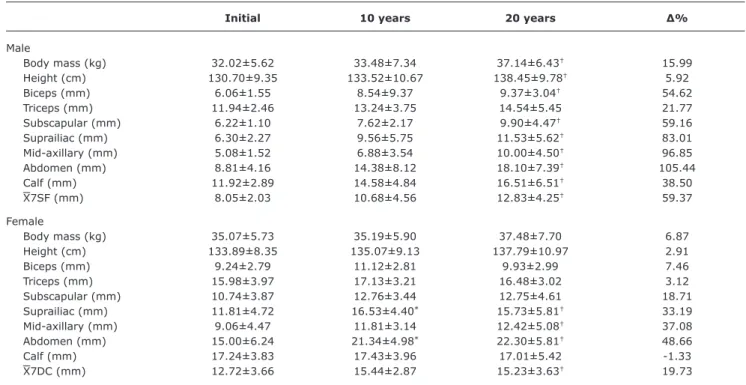
Table 3 shows that there was an increase in all analyzed variables in both sexes, except for the calf skinfold thickness in females. Height, body mass, and skinfold thicknesses of biceps, subscapular, suprailiac, mid-axillary, abdomen, calf and X7SF were signiicantly (p < 0.01) different during the 20-year period in males. The largest increases occurred in suprailiac (83%), mid-axillary (96.8%) and abdomen (105.4%) SFs.
In women, the suprailiac, abdomen and X7SF were signiicantly (p < 0.01) different between baseline and 20 years. Suprailiac, abdomen and X7SF skinfolds were signiicantly (p < 0.01) different between the initial period
and 20 years. The largest increases in females occurred in the suprailiac (33.1%), mid-axillary (37%) and abdomen (48.6%) SFs.
Table 4 shows that there was an increase in all variables in males, and in all variables, except for body mass, height and subscapular SF, in females. Biceps, subscapular, abdomen and X7SF SFs were signiicantly (p < 0.01) different in males during the period of 20 years. The largest increases in males occurred in the mid-axillary (49.2%), abdomen (51%) and subscapular (53.8%) SFs. Although no statistical differences in absolute values were found in females, in percentages there were large increases in mid-axillary (15.4%), suprailiac (22.8%) and abdomen (23.6%) SFs.
To compare the changes in adiposity of each group, we calculated the mean of the ∆% of all the SFs. In males, the largest increase occurred in the overweight group (65.6%), followed by the obese (39.8%) and eutrophic (6.31%). In females, the largest increases occurred similarly in overweight groups (20.9%) and eutrophics (19.6%), followed by the obese group (11%).
Discussion
The results of the present study showed that the accumulation of central subcutaneous fat has risen more steeply than total adiposity assessed by BMI, i.e., even in populations where there was no alteration in BMI, unfavorable changes in body composition and fat distribution might have occurred for a proile associated with higher risk of disease. In males, the overweight group had a greater increase in SF than the obese group, emphasizing an increase of SF thickness even in the group classiied as eutrophic. In females, these results were even clearer, since they demonstrated a higher increase of SF thickness in the eutrophic and overweight groups in comparison to the obese group, indicating that only the criterion of nutritional status classiication may not clearly relect the changes of accumulation of adipose tissue or increasing obesity.
Initial 10 years 20 years ∆%
Male
Body mass (kg) 27.01±3.84 26.64±4.28 27.67±4.42 2.44
Height (cm) 130.01±7.61 132.29±7.45 133.13±8.48† 2.39
Biceps (mm) 4.75±1.15 4.87±1.46 5.32±2.04 12.00
Triceps (mm) 9.12±2.16 8.05±2.57 8.46±2.63 -7.23
Subscapular (mm) 5.39±1.11 5.59±1.32 5.79±1.97 7.42
Suprailiac (mm) 4.87±1.35 4.86±1.52 5.33±2.04 9.44
Mid-axillary (mm) 4.27±0.92 4.55±1.21 4.81±1.81† 12.64
Abdomen (mm) 6.36±2.13 6.24±2.88 7.33±3.21 15.25
Calf (mm) 9.23±2.77 7.92±2.46 8.74±2.98 -5.30
X7SF (mm) 6.28±1.35 6.01±1.71 6.54±2.03 4.14
Female
Body mass (kg) 27.52±4.71 25.90±4.68 28.55±5.91‡ 3.74
Height (cm) 130.58±8.22 130.63±7.62 133.21±9.92 2.01
Biceps (mm) 5.94±1.67 5.98±1.74 6.62±2.49 11.44
Triceps (mm) 11.09±2.46 9.77±2.38* 11.23±3.26‡ 1.26
Subscapular (mm) 6.27±1.67 6.54±1.68 7.12±2.72† 13.55
Suprailiac (mm) 5.92±2.33 6.33±2.31 7.87±3.49†‡ 32.93
Mid-axillary (mm) 5.08±1.50 5.41±1.58 6.43±2.78†‡ 26.57
Abdomen (mm) 7.63±2.98 8.38±3.81 11.54±5.15†‡ 51.24
Calf (mm) 11.65±3.25 10.04±2.93* 11.75±3.73‡ 0.85
X7SF (mm) 7.65±1.87 7.49±2.01 8.93±2.88†‡ 16.73
∆% = delta percentage.
X7SF = mean adiposity of the seven SFs (biceps, triceps, subscapular, suprailiac, mid-axillary, abdomen and calf). p < 0.01.
* Initial different from 10 years.
† Initial different from 20 years. ‡ 10 years different from 20 years.
Table 2 - Descriptive and comparative analysis of the anthropometric variables of school-age children of both genders, classiied as eutrophic according to the assessment period (initial, 10 and 20 years)
∆% = delta percentage.
X7SF = mean adiposity of the seven SFs (biceps, triceps, subscapular, suprailiac, mid-axillary, abdomen and calf). p < 0.01.
* Initial different from 10 years.
† Initial different from 20 years. ‡ 10 years different from 20 years.
Table 3 - Descriptive and comparative analysis of the anthropometric variables of school-age children of both genders, classiied as overweight according to the assessment period (initial, 10 and 20 years)
Initial 10 years 20 years ∆%
Male
Body mass (kg) 32.02±5.62 33.48±7.34 37.14±6.43† 15.99
Height (cm) 130.70±9.35 133.52±10.67 138.45±9.78† 5.92
Biceps (mm) 6.06±1.55 8.54±9.37 9.37±3.04† 54.62
Triceps (mm) 11.94±2.46 13.24±3.75 14.54±5.45 21.77
Subscapular (mm) 6.22±1.10 7.62±2.17 9.90±4.47† 59.16
Suprailiac (mm) 6.30±2.27 9.56±5.75 11.53±5.62† 83.01
Mid-axillary (mm) 5.08±1.52 6.88±3.54 10.00±4.50† 96.85
Abdomen (mm) 8.81±4.16 14.38±8.12 18.10±7.39† 105.44
Calf (mm) 11.92±2.89 14.58±4.84 16.51±6.51† 38.50
X7SF (mm) 8.05±2.03 10.68±4.56 12.83±4.25† 59.37
Female
Body mass (kg) 35.07±5.73 35.19±5.90 37.48±7.70 6.87
Height (cm) 133.89±8.35 135.07±9.13 137.79±10.97 2.91
Biceps (mm) 9.24±2.79 11.12±2.81 9.93±2.99 7.46
Triceps (mm) 15.98±3.97 17.13±3.21 16.48±3.02 3.12
Subscapular (mm) 10.74±3.87 12.76±3.44 12.75±4.61 18.71
Suprailiac (mm) 11.81±4.72 16.53±4.40* 15.73±5.81† 33.19
Mid-axillary (mm) 9.06±4.47 11.81±3.14 12.42±5.08† 37.08
Abdomen (mm) 15.00±6.24 21.34±4.98* 22.30±5.81† 48.66
Calf (mm) 17.24±3.83 17.43±3.96 17.01±5.42 -1.33
∆% = delta percentage.
X7SF = mean adiposity of the seven SFs (biceps, triceps, subscapular, suprailiac, mid-axillary, abdomen and calf). p < 0.01.
*Initial different from 10 years.
† Initial different from 20 years. ‡ 10 years different from 20 years.
Table 4 - Descriptive analysis of the anthropometric variables of school-age children classiied as obese according to the assessment period (initial, 10 and 20 years)
Initial 10 years 20 years ∆%
Male
Body mass (kg) 40.07±7.67 45.33±9.09 45.08±8.22 12.50
Height (cm) 135.58±9.59 138.59±7.57 137.91±8.61 1.71
Biceps (mm) 9.82±3.66 11.51±3.76 14.32±4.01† 45.82
Triceps (mm) 18.04±5.91 18.72±4.23 22.57±5.63 25.11
Subscapular (mm) 12.08±5.44 17.96±7.41 18.59±6.98† 53.89
Suprailiac (mm) 16.56±9,57 20.37±9.48 20.81±7.95 25.66
Mid-axillary (mm) 10.56±4.75 17.02±9.73 15.76±5.12 49.24
Abdomen (mm) 20.31±9.44 27.78±13.81 30.67±7.30† 51.00
Calf (mm) 16.66±7.35 22.60±7.50 21.34±4.51 28.09
X7DC (mm) 14.86±5.65 19.42±7.05 20.51±4.74† 38.02
Female
Body mass (kg) 46.42±7.41 43.51±6.65 44.77±7.87 -3.55
Height (cm) 140.51±8.10 137.41±6.77 137.97±8.59 -1.80
Biceps (mm) 13.15±2.28 15.37±3.80 13.94±3.88 6.00
Triceps (mm) 21.59±2.76 24.02±3.71 21.97±5.39 1.76
Subscapular (mm) 20.52±5.68 20.75±5.36 19.07±6.42 -7.06
Suprailiac (mm) 21.24±4.77 27.28±4.85 26.10±7.06 22.88
Mid-axillary (mm) 15.88±3.81 21.85±6.22 18.33±5.56 15.42
Abdomen (mm) 26.69±3.87 31.33±6.32 33.01±7.98 23.67
Calf (mm) 20.53±10.13 23.51±5.30 23.54±6.79 14.66
X7DC (mm) 19.94±3.38 23.44±4.43 22.25±4.98 11.58
period, there was an increase of 12% in boys and 27% in girls in abdominal SF and of 3% in boys and 8% in girls in triceps skinfold. The present study presented a higher increase in abdominal SF in the 20-year period analyzed, 57.2% in boys and 49% in girls. The triceps SF presented an increase of 6.5% in boys and 8.4% in girls. Similarly to the present study, in which the largest increases occurred in central SFs, the data demonstrated suggest a change in body shape, regardless of an increase in BMI and a shift towards a higher risk proile associated with disease.24
Garnett25 examined the prevalence of increased central obesity, from waist circumference and height/waist ratio in students aged 7 to15 years, in the period of 1985 and 2007, and also showed that, in 20 years, adiposity increased at a much faster rate than central adiposity, and this increase was greater in females. Although authors used waist circumference and height/waist ratio, these data conirm the data obtained in the present study, although a greater increase was found mainly in males.
In developed countries, Olds9 analyzed the secular trends in adiposity and its distribution in children and adolescent from 0 to 18 years. The results presented an increase in
triceps and subscapular SFs in the period from 1951 to 2003, and there was a decrease in triceps/subscapular (T/S) ratio, which represents a more centralized distribution of fat. When compared between sexes, this decrease was higher in females than in males. These data support the indings in the present study, since subscapular SF had a greater increase than triceps SF in eutrophic boys (S = 7.4%; T = -7.2%), overweight (S = 59.1%; T = 21.7%) and among the obese (S = 53.8%; T = 25.1%), as well as in the eutrophic (S = 13.5%; T = 1.2%) and overweight girls (S = 18.7%; T = 3.1%), during the 20-year period analyzed. However, the present study presented a higher increase in central adiposity in boys in relation to girls.
References
1. de Franca E, Alves JG. Dyslipidemia among adolescents and children from Pernambuco. Arq Bras Cardiol. 2006;87:722-7. 2. Brandão AP, Brandão AA, Berenson GS, Fuster V. Metabolic
syndrome in children and adolescents. Arq Bras Cardiol. 2005;85:79-81.
3. Department of Health Public Health Research Consortium, Law C, Power C, Graham H, Merrick D. Obesity and health inequalities. Obes Rev. 2007;8:19-22.
4. Instituto Brasileiro de Geograia e Estatística (IBGE). Pesquisa de Orçamentos Familiares 2008-2009: antropometria e estado nutricional de crianças, adolescentes e adultos no Brasil. Rio de Janeiro: IBGE; 2010.
5. Campbell I. The obesity epidemic: can we turn the tide? Heart. 2003;89:ii22-4.
6. Gordon-Larsen P, Adair LS, Nelson MC, Popkin BM. Five-year obesity incidence in the transition period between adolescence and adulthood: the National Longitudinal Study of Adolescent Health. Am J Clin Nutr. 2004;80:569-75.
7. Pinto MC, Oliveira AC. Occurrence of child obesity in preschool children in a São Paulo day-care center. Einstein (São Paulo). 2009;7:170-5.
8. Moraes SA, Beltrán Rosas J, Mondini L, Freitas IC. Prevalence of overweight and obesity, and associated factors in school children from urban area in Chilpancingo, Guerrero, Mexico, 2004. Cad Saude Publica. 2006;22:1289-301.
9. Olds TS. One million skinfolds: secular trends in the fatness of young people 1951-2004. Eur J Clin Nutr. 2009;63:934-46.
10. Canoy D. Distribution of body fat and risk of coronary heart disease in men and women. Curr Opin Cardiol. 2008;23:591-8. 11. Vazquez G, Duval S, Jacobs DR Jr, Silventoinen K. Comparison
of body mass index, waist circumference, and waist/hip ratio in predicting incident diabetes: a meta-analysis. Epidemiol Rev. 2007;29:115-28.
12. Ehtisham S, Crabtree N, Clark P, Shaw N, Barrett T. Ethnic differences in insulin resistance and body composition in United Kingdom adolescents. J Clin Endocrinol Metab. 2005;90:3963-9. 13. Gus M, Fuchs SC, Moreira LB, Moraes RS, Wiehe M, Silva AF, et
al. Association between different measurements of obesity and the incidence of hypertension. Am J Hypertens. 2004;17:50-3.
14. Souza MS, Leme RB, Franco RR, Romaldini CC, Tumas R, Cardoso AL, et al. Síndrome metabólica em adolescentes com sobrepeso e obesidade. Rev Paul Pediatr. 2007;25:214-20.
15. Jung C, Fischer N, Fritzenwanger M, Figulla HR. Anthropometric indices as predictors of the metabolic syndrome and its components in adolescents. Pediatr Int. 2010;52:402-9.
16. Oliveira CL, Mello MT, Cintra IP, Fisberg M. Obesidade e síndrome metabólica na infância e adolescência. Rev Nutr. 2004;17:237-45.
17. Instituto Brasileiro de Geograia e Estatística (IBGE). Censo Demográico 2007: Resultados do universo. http://www.ibge. gov.br. Access: 20/04/11.
18. Ferrari GL, Hespanhol JE, Arruda M. Associação dos indicadores da composição corporal com a maturação sexual em jovens atletas futebolistas. Rev Bras Ciênc Saúde. 2007;3:3-7.
19. Matsudo VK. Testes em Ciências do Esporte. 7ª ed. São Caetano do Sul: Centro de Estudos do Laboratório de Aptidão Física de São Caetano do Sul; 2005.
20. de Onis M, Onyango AW, Borghi E, Siyam A, Nishida C, Siekmann J. Development of a WHO growth reference for school-aged children and adolescents. Bull World Health Organ. 2007;85:660-7. 21. Tanner JM. Growth at adolescence. Oxford: Blackwell Scientiic.
In: Malina RM, Bouchard C. Growth, maturation, and physical activity. Champaign: Human Kinetics Books; 1991.
22. Matsudo SM, Matsudo VK. Self-assessment and physician assessment of sexual maturation in Brazilian boys and girls: concordance and reproducibility. Am J Hum Biol. 1994;6:451-5. Janssen27 estimated the prevalence of abdominal
obesity from the waist circumference in adolescents and adults in the period between 1981 and 2009, showing that abdominal obesity increased with age and was higher in women. The author also estimated that the prevalence of abdominal obesity in adults and adolescents classiied by BMI as normal, overweight and obese. The prevalence of abdominal obesity was of 2.6% in eutrophic, 35.3% in overweight and 93% among the obese. Although analyzing an older age group, these data were similar to the indings in the present study, since the subcutaneous fat located in the central region had a higher prevalence during the analyzed period.
Although the present study reported a 20-year analysis in a mixed longitudinal project conducted in a developing country for more than 30 years and had a considerable sample of 1,915 children, the authors believed that the current investigation has some limitations: a) the scope of the sample, since it is geographically limited; b) the lack of criteria to classify BMI of Brazilian children by age and sex; c) the indirect assessment of adiposity, even being held by the same evaluator in all analyzed periods; d) the lack of control of the socioeconomic status, although obesity is not explained by the economic growth of a region;28 e) the lack of agreement on the basis of the discussion regarding the methodological criteria for assessing adiposity in children; and f) the fact that the lean body mass was not assessed.
After a 20-year analysis, the authors concluded that the adipose tissue had a signiicant increase in both sexes and nutritional statuses. There were adiposity changes, even with the control of nutritional status, during the 20-year period analyzed, showing that individuals may have similar BMI, but at the same time, vary in proportion and distribution of the subcutaneous adipose tissue. In males, the largest SF increase occurred in the overweight group, followed by the obese and eutrophic after a period of 20 years. In females, the largest increases occurred similarly in the overweight and eutrophic, followed by the obese. In both sexes, the highest increase was in central SFs, when compared with peripheral SFs. Thus, it is suggested a possible change in body composition, which may be experiencing an increase in fat mass.
Acknowledgements
23. Dollman J, Olds TS. Secular changes in fatness and fat distribution in Australian children matched for body size. Int J Pediatr Obes. 2006;1:109-13.
24. Lobstein T, Baur L, Uauy R; IASO International Obesity TaskForce. Obesity in children and young people: a crisis in public health. Obes Rev. 2004;5:4-104.
25. Garnett SP, Baur LA, Cowell CT. The prevalence of increased central adiposity in Australian school children 1985 to 2007. Obes Rev. 2011;12:887-96.
26. Hegg RV. Skinfolds in school children from 7 to 11 years of age. Rev Saude Publica. 1978;12:147-50.
27. Janssen I, Shields M, Craig CL, Tremblay MS. Prevalence and secular changes in abdominal obesity in Canadian adolescents and adults, 1981 to 2007-2009. Obes Rev. 2011;12:397-405.
28. Bua J, Olsen LW, Sørensen TI. Secular trends in childhood obesity in Denmark during 50 years in relation to economic growth. Obesity (Silver Spring). 2007;15:977-85.
Correspondence: Tatiane K. Ferrari
Rua Heloísa Pamplona, 269, sala 31, Fundação CEP 09520-320 - São Caetano do Sul, SP - Brazil Tel.: + 55 (11) 4229.8980, +55 (11) 4229.9643