Pulmonary function, cholinergic
bronchomotor tone, and cardiac
autonomic abnormalities in
type 2 diabetic patients
Departamento de Clínica Médica, Faculdade de Medicina de Ribeirão Preto,
Universidade de São Paulo, Ribeirão Preto, SP, Brasil E. Melo, E.O. Vianna,
L. Gallo Jr., M.C. Foss and J. Terra-Filho
Abstract
This prospective study analyzed the involvement of the autonomic nervous system in pulmonary and cardiac function by evaluating cardio-vascular reflex and its correlation with pulmonary function abnormali-ties of type 2 diabetic patients. Diabetic patients (N = 17) and healthy subjects (N = 17) were evaluated by 1) pulmonary function tests includ-ing spirometry, He-dilution method, N2 washout test, and specific airway conductance (SGaw) determined by plethysmography before and after aerosol administration of atropine sulfate, and 2) autonomic cardiovas-cular activity by the passive tilting test and the magnitude of respiratory sinus arrhythmia (RSA). Basal heart rate was higher in the diabetic group (87.8 ± 11.2 bpm; mean ± SD) than in the control group (72.9 ± 7.8 bpm, P<0.05). The increase of heart rate at 5 s of tilting was 11.8 ± 6.5 bpm in diabetic patients and 17.6 ± 6.2 bpm in the control group (P<0.05). Systemic arterial pressure and RSA analysis did not reveal significant differences between groups. Diabetes intragroup analysis revealed two behaviors: 10 patients with close to normal findings and 7 with signifi-cant abnormalities in terms of RSA, with the latter subgroup presenting one or more abnormalities in other tests and clear evidence of cardiovas-cular autonomic dysfunction. End-expiratory flows were significantly lower in diabetic patients than in the control group (P<0.05). Pulmonary function tests before and after atropine administration demonstrated comparable responses by both groups. Type 2 diabetic patients have cardiac autonomic dysfunction that is not associated with bronchomotor tone alterations, probably reflecting a less severe impairment than that of type 1 diabetes mellitus. Yet, a reduction of end-expiratory flow was detected.
Correspondence
J. Terra-Filho
Departamento de Clínica Médica FMRP, USP
Av. Bandeirantes, 3900 14049-900 Ribeirão Preto, SP Brasil
Fax: +55-16-633-6695 E-mail: [email protected]
Publication supported by FAPESP.
Received November 19, 2001 Accepted October 4, 2002
Key words
·Diabetes mellitus
·Autonomic nervous system ·Autonomic neuropathy ·Heart rate variability ·Blood pressure variability
Introduction
Several respiratory alterations have been reported in association with diabetes mellitus, mainly insulin-dependent diabetes, including alveolar epithelial and capillary basal mem-brane thickening (1), reduction of diffusion capacity (2,3), centrilobular emphysema (4),
lung connective tissue changes (5), respira-tory muscle dysfunction (6), and chest wall abnormalities (7). The relevance of these find-ings in the clinical evaluation of this disease has not been well established (8,9).
manifestations of dysautonomy being more common in the cardiovascular, genitourinary, gastrointestinal, and thermoregulatory systems (10). In the non-insulin dependent, type 2, diabetic population, there is evidence that the expression of neural damage may be more complex due to overlapping hormonal, meta-bolic, and circulatory effects associated with old age (11). The autonomic neuropathy of diabetic patients may influence the control of breathing and this might explain the sudden deaths occurring in patients with severe dis-ease (12). There is increasing evidence that the autonomic control of airway smooth muscle may also be altered in type 1 diabetes (13).
In a previous study from our laboratory, we showed that the parasympathetic regulation of airway caliber may be damaged in diabetes mellitus, characterizing a bronchomotor dysautonomy. However, at that time, only in-sulin-dependent patients were studied. In those cases, there was a correlation between bron-chial dysautonomy and cardiac dysautonomy, the latter demonstrated by quantitative analy-sis of the reflex heart rate (HR) responses (14). Since the time course and pathophysiol-ogy of type 2 diabetes may be different from that of the type 1 form of this disease, we performed a prospective study to analyze the involvement of the autonomic nervous sys-tem by evaluating cardiovascular reflex and its possible correlation with pulmonary func-tion abnormalities of type 2 diabetic patients detected by spirometry, flow-volume curve, plethysmography, and the N2 washout test
before and after cholinergic blockade. A quantitative study of autonomic cardiovas-cular activity was carried out on these sub-jects using the tilting test and the magnitude of respiratory sinus arrhythmia (RSA).
Patients and Methods
Subjects
In a case-control prospective protocol, we studied 17 type 2 diabetic patients aged
31 to 60 years and 17 healthy individuals aged 34 to 58 years chosen from the Ribeirão Preto general community as a normal control group. The male/female ratio was 8/9 for both diabetic and control subjects. The in-clusion criteria for the diabetic group were: non-insulin dependent diabetes mellitus for at least 2 years confirmed and treated at our hospital, a negative history of smoking, nor-mal weight, and nornor-mal arterial pressure. Volunteers were taking medication only for diabetes. None of the patients or normal vol-unteers had a recent or remote history of car-diorespiratory disease or respiratory allergy and none had suffered an acute respiratory infection in the previous 3 months. Serologic tests for Chagas’ disease (complement fixa-tion and immunofluorescence) were negative in all individuals studied. All subjects gave informed consent to participate in this institu-tional Ethics Committee-approved protocol.
Tilting test
The head-up tilting test with an inclina-tion of 70º was performed with the aid of a tilting table that permitted rapid passive changes in body position without muscular effort on the part of the individual (15). HR was monitored by continuous ECG record-ing. Arterial pressure was measured with a sphygmomanometer during the basal period in the supine position and during the tilting test. After 30 min of rest in the supine posi-tion, normal and diabetic patients were sub-mitted to rapid 70º head-up tilting and were left in this position for 5 min, when returning the table to the horizontal position termi-nated the test.
Respiratory sinus arrhythmia test
measurement of tidal volume (Hewlett-Packard 4588B, Fort Collins, CO, USA). The instanta-neous HR was obtained using a cardiotachom-eter that received the ECG signal from a D2
lead of the ECG channel. RSA magnitude is defined as the mean of the differences be-tween maximum and minimum instantaneous HR values over six successive respiratory cycles. The RSA test is simple, noninvasive, and sensitive in detecting a cardiovascular autonomic neuropathy (14,15).
Pulmonary function tests
Forced vital capacity (FVC), forced expi-ratory volume in the first second (FEV1),
forced expiratory flow from 25 to 75% of FVC (FEF25-75%),total lung capacity, residual
volume, and functional residual capacity (FRC) were measured using a 9-liter spirom-eter (Collins Modular Lung Analyzer Sys-tem, Braintree, MA, USA) and the helium dilution method. Instantaneous FEF (Vmax) measurements throughout the flow-volume curve were made with the aid of a pneumota-chometer and the volume change was deter-mined by integration of an electronic flow signal (Hewlett-Packard 47804S). All these pulmonary function tests met the American Thoracic Society criteria (16,17). The best of three efforts in the measurements of FVC and FEV1 was selected (16,18). Thoracic gas
volume (VTG) and airway resistance (Raw)
were measured by the methods of DuBois et al. (19,20) using a constant-volume body plethysmograph (W.E. Collins 09001). Spe-cific airway conductance (SGaw) was calcu-lated by dividing the Raw reciprocal (i.e., 1/Raw) by the VTG at which the
measure-ments were made. For the Raw evaluation, at least ten measurements were made per indi-vidual during each phase of the study, and the results are reported as mean values.
Atropine administration
The changes in airway caliber induced by
cholinergic blockade were inferred through the SGaw changes provoked by the aerosol administration of atropine sulfate at the con-centration of 1 mg/ml. The aerosol was gen-erated by a nebulizer (De Vilbiss 645, Somerset, PA, USA) connected to a com-pressed air source with a flow of 8 l/min. A hand-operated valve permitted nebulization to occur only during the inspiratory phase of the respiratory cycle. The aerosol was in-haled through the mouth during slow and deep inspirations initiated at FRC and last-ing approximately 4 s. In each case the nebu-lized volume was 1 ml, equivalent to 1 mg of atropine sulfate, a sufficient dose to provoke bronchodilation in normal individuals (14, 21). The expiratory flows, VTG, and Raw
measurements were repeated 5 min after the end of nebulization.
Nitrogen washout test
The single-breath N2 washout test was
performed using an automated apparatus for lung function evaluation (Hewlett-Packard 47804S). The N2 concentration in the mouth
was measured with a fast-response analyzer (Hewlett-Packard 47302A) connected to a pneumotachometer (Hewlett-Packard 47304A) that allowed the measurement of expiratory flow, and, by calculation, expira-tory volume (x-axis) concomitantly to N2
con-centration (y-axis). This curve was displayed on a screen for both the patient and the inves-tigator. To evaluate closing volume and alveo-lar N2 slope (SIII), the patients were asked to
breathe in 100% O2 from residual volume to
total lung capacity. Then, during the expira-tion to residual volume, the flow was kept below 0.5 l/s. The subjects performed at least two satisfactory trials (5 min apart) (22,23).
Statistical analysis
group was compared by the chi-square test. Data are expressed as mean ± SD. A P value <0.05 was considered to be significant.
A descriptive statistical analysis was also done in order to calculate the number and percentage of diabetic patients that were outside the range of a prediction interval (95%) of a “t” distribution with n-1 degrees of freedom, i.e., mean ± t(1 - µ/2, n-1) x (s/Ön)
for the control group, where s = standard deviation of the sample data.
Results
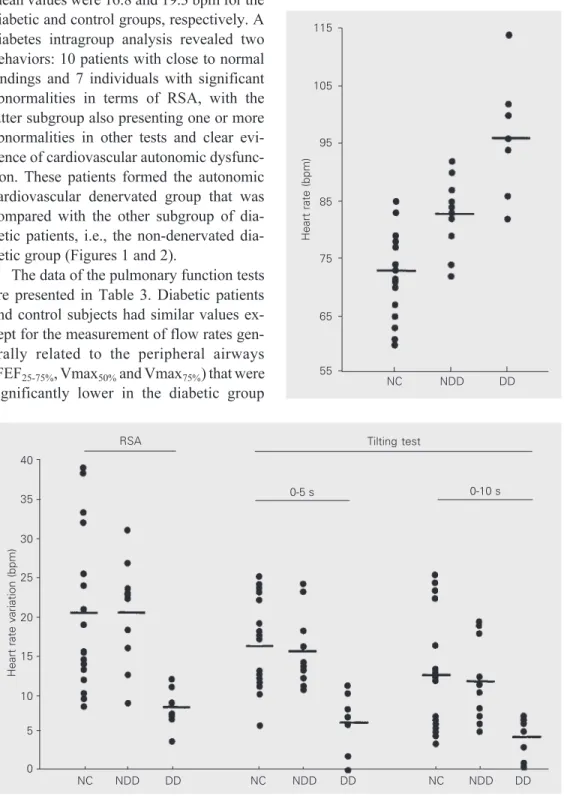
Subject characteristics and clinical data are summarized in Tables 1 and 2. There were no differences in anthropometric pa-rameters between the diabetic and control groups. The results obtained during the study of the autonomic cardiovascular activity showed that in the resting supine position, diabetic patients had significantly higher HR values (87.8 ± 11.2 vs 72.9 ± 7.8 bpm for the control group, P<0.05) (Figure 1). More-over, in this group, seven subjects (40%) had high HR values based on the range estab-lished by the prediction interval. Systemic arterial pressure at baseline was not statisti-cally different. During the tilting test, the increase in HR at 5 s was significantly lower in the diabetic group (11.8 ± 6.5 vs 17.6 ± 6.2 bpm for the control group, P<0.05). Two diabetic patients (12%) were outside the nor-mal prediction interval. No significant dif-ference in HR increase was observed be-tween controls and diabetic patients at 10 s or at other time points. Also, the variation of Table 1. Subject characteristics.
Diabetic group Control group
Number of subjects 17 17
Gender (male/female) 8/9 8/9
Age (years) 47.0 ± 7.0 45.0 ± 7.0
Weight (kg) 64.3 ± 13.5 72.5 ± 10.7
Height (cm) 161.4 ± 13.0 165.4 ± 8.4
Body surface (m2) 1.7 ± 0.2 1.8 ± 0.1
Duration of diabetes (years) 7.5 ± 5.2
-Peripheral neuropathy 8 0
Retinopathy 5 0
Data are reported as means ± SD.
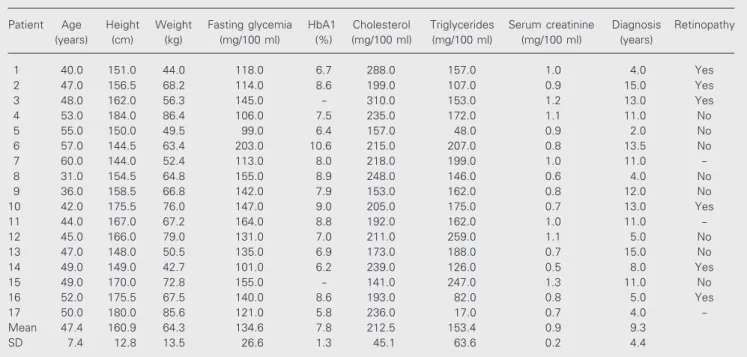
Table 2. Patient characteristics.
Patient Age Height Weight Fasting glycemia HbA1 Cholesterol Triglycerides Serum creatinine Diagnosis Retinopathy
(years) (cm) (kg) (mg/100 ml) (%) (mg/100 ml) (mg/100 ml) (mg/100 ml) (years)
1 40.0 151.0 44.0 118.0 6.7 288.0 157.0 1.0 4.0 Yes
2 47.0 156.5 68.2 114.0 8.6 199.0 107.0 0.9 15.0 Yes
3 48.0 162.0 56.3 145.0 - 310.0 153.0 1.2 13.0 Yes
4 53.0 184.0 86.4 106.0 7.5 235.0 172.0 1.1 11.0 No
5 55.0 150.0 49.5 99.0 6.4 157.0 48.0 0.9 2.0 No
6 57.0 144.5 63.4 203.0 10.6 215.0 207.0 0.8 13.5 No
7 60.0 144.0 52.4 113.0 8.0 218.0 199.0 1.0 11.0
-8 31.0 154.5 64.8 155.0 8.9 248.0 146.0 0.6 4.0 No
9 36.0 158.5 66.8 142.0 7.9 153.0 162.0 0.8 12.0 No
10 42.0 175.5 76.0 147.0 9.0 205.0 175.0 0.7 13.0 Yes
11 44.0 167.0 67.2 164.0 8.8 192.0 162.0 1.0 11.0
-12 45.0 166.0 79.0 131.0 7.0 211.0 259.0 1.1 5.0 No
13 47.0 148.0 50.5 135.0 6.9 173.0 188.0 0.7 15.0 No
14 49.0 149.0 42.7 101.0 6.2 239.0 126.0 0.5 8.0 Yes
15 49.0 170.0 72.8 155.0 - 141.0 247.0 1.3 11.0 No
16 52.0 175.5 67.5 140.0 8.6 193.0 82.0 0.8 5.0 Yes
17 50.0 180.0 85.6 121.0 5.8 236.0 17.0 0.7 4.0
-Mean 47.4 160.9 64.3 134.6 7.8 212.5 153.4 0.9 9.3
arterial pressure was comparable in both groups, except for one diabetic patient that interrupted the test before the fifth minute due to symptomatic hypotension.
The magnitude of RSA was not signifi-cantly different in the diabetic group; the mean values were 16.8 and 19.3 bpm for the diabetic and control groups, respectively. A diabetes intragroup analysis revealed two behaviors: 10 patients with close to normal findings and 7 individuals with significant abnormalities in terms of RSA, with the latter subgroup also presenting one or more abnormalities in other tests and clear evi-dence of cardiovascular autonomic dysfunc-tion. These patients formed the autonomic cardiovascular denervated group that was compared with the other subgroup of betic patients, i.e., the non-denervated dia-betic group (Figures 1 and 2).
The data of the pulmonary function tests are presented in Table 3. Diabetic patients and control subjects had similar values ex-cept for the measurement of flow rates gen-erally related to the peripheral airways (FEF25-75%, Vmax50% and Vmax75%) that were
significantly lower in the diabetic group
Figure 1. Basal heart rate of type 2 diabetic patients (DD = dener-vated diabetic group, N = 7; NDD = non-denervated diabetic group, N = 10), and normal con-trols (NC; N = 17). Horizontal bars indicate means. P<0.05,
DD vs NC (unpaired Student t
-test).
Heart rate (bpm)
115
105
95
85
75
65
55
NC NDD DD
Heart rate variation (bpm)
40
35
30
25
20
15
10
5
0
RSA
0-5 s 0-10 s
Tilting test
NC NDD DD NC NDD DD NC NDD DD
Figure 2. Heart rate variation dur-ing the tiltdur-ing test and respira-tory sinus arrhythmia (RSA) in type 2 diabetic patients (DD = denervated diabetic group, N = 7; NDD = non-denervated dia-betic group, N = 10) and normal controls (NC; N = 17). Horizontal bars indicate means. P<0.05,
DD vs NC (unpaired Student t
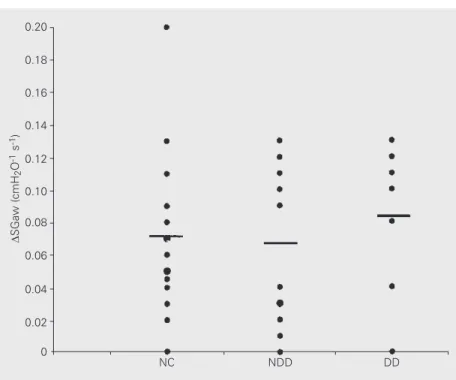
-test). (P<0.05). The non-denervated group did not differ from the denervated diabetic group. The evaluation of VTG, Raw, and SGaw
admin-group. The changes of lung function ob-tained with atropine administration were not different between groups (Figure 3).
The N2 washout test demonstrated
com-parable measurements for the two groups. The results for SIII were 0.9 ± 0.5 and 1.5 ±
0.8 %N2/l for the control and diabetic group,
respectively, and the results for closing vol-ume (% of the vital capacity) were 22.1 ± 8.6 and 23.1 ± 6.1%. However, according to the definition of normal values by Buist and Ross (23), the diabetic group had 7 subjects with higher than normal values of SIII.
Discussion
This study has demonstrated that patients with type 2 diabetes mellitus have evidence of depression of the parasympathetic auto-nomic control of the heart, as judged by the higher HR observed under basal conditions in the supine position and the depressed response of the RSA. However, our results do not suggest that this alteration is accom-panied by dysfunction of the parasympa-thetic regulation of airway caliber. The re-sponse of the diabetic group to inhaled atro-pine did not differ from that observed in the control group.
A decline in the reflex autonomic control of HR with age has been reported previously in a healthy population (24,25). Smoking has also been reported to reduce vagal tone (26). However, in this study there were no significant differences between groups in age, smoking status, or male/female distri-bution. In Chagas’ disease, which is en-demic in some South American countries, damage to the intracardiac parasympathetic ganglion cells also provokes intense depres-sion of the vagal regulation of the heart (27,28). Nevertheless, the negative results of specific serologic tests obtained for the pres-ent subjects permitted us to exclude the con-comitant presence of Chagas’ heart disease. Thus, the present data indicate that diabetes mellitus is the only disease responsible for Table 3. Pulmonary function tests.
Parameter Diabetic group Control group
Vital capacity (liters) 3.4 ± 1.0 3.9 ± 0.8
FRC (liters) 2.6 ± 0.9 2.8 ± 0.6
Residual volume (liters) 1.6 ± 0.5 1.9 ± 0.5
Total lung capacity (liters) 5.0 ± 1.2 5.7 ± 1.1
FVC (liters) 3.5 ± 0.9 3.9 ± 0.8
FEV1 (liters) 2.8 ± 0.6 3.1 ± 0.6
FEV1/FVC (%) 80.9 ± 6.2 81.1 ± 7.2
FEF25-75% (liter/s) 2.9 ± 1.0 3.5 ± 1.2*
Vmax50% (liter/s) 3.4 ± 1.1 4.3 ± 1.2*
Vmax75% (liter/s) 1.0 ± 0.5 1.5 ± 0.6*
SGaw (cm H2O-1 s-1) 0.24 ± 0.06 0.23 ± 0.08
VTG (liters) 2.6 ± 0.7 2.7 ± 0.7
SIII (%N2/liter) 1.5 ± 0.8 0.9 ± 0.5
Data are reported as means ± SD.
*P<0.05 compared to the diabetic group (unpaired Student t-test).
FRC = functional residual capacity, FVC = forced vital capacity, FEV1 = forced
expira-tory volume in the first second, FEF25-75% = forced expiratory flow from 25 to 75% of
FVC, Vmax = instantaneous forced expiratory flow, SGaw = specific airway
conduc-tance, VTG = thoracic gas volume, SIII = alveolar N2 slope.
Figure 3. Changes in specific airway conductance (SGaw) from pre- to post-atropine admin-istration measurements in type 2 diabetic patients (DD = denervated diabetic group, N = 7; NDD = non-denervated diabetic group, N = 10) and normal controls (NC; N = 17). Horizontal bars indicate means.
D
SGaw (cmH
2
O
-1 s -1)
0.20
NC NDD DD
istration values were similar for the control and the diabetic group, even when compar-ing the non-denervated with the denervated
0.18
0.16
0.14
0.12
0.10
0.08
0.06
0.04
0.02
the findings described. In addition, previous studies from our laboratory have shown simi-lar results for insulin-dependent diabetic pa-tients (14), and several other investigators have linked diabetes mellitus to autonomic dysfunction (29-31). The diabetic patients studied had particular characteristics in that they were middle-aged, normotensive, non-smokers, and probably not typical of the “average” patient with type 2 diabetes who might have demonstrated more changes. Nevertheless, the study group had an appar-ent cardiac parasympathetic neuropathy, which would place them at higher risk of sudden cardiac death.
Analysis of the time course of HR varia-tion during the tilting test in normal indi-viduals demonstrated that, while the initial tachycardia depends on suppression of vagal tone, the maintenance of an elevated HR during the equilibration period after 5 s in the tilted position is related to sympathetic stimulation (15,27). These results show that at the fifth minute of the tilting test (i.e., during the equilibrium phase), the mean in-crease in HR in the two groups did not differ. On this basis, the results suggest that even in the patients with dysfunction of the para-sympathetic control of the heart (diabetic group), there was sufficient sympathetic ac-tivity to maintain a normal HR increase dur-ing the equilibrium phase of passive tiltdur-ing. Furthermore, the maintenance of normal ar-terial pressure levels during the tilting test indicates the preservation of the sympathetic efferent control of peripheral vascular resis-tance.
Aerosol administration of atropine sul-fate was accompanied by an increase in SGaw in both groups, indicating that basal para-sympathetic activity on the airways was pres-ent in diabetic patipres-ents in a proportion simi-lar to that observed in healthy subjects. The comparative analysis between non-dener-vated and denernon-dener-vated diabetic subgroups showed no differences, dissociating respira-tory changes from cardiac dysautonomy in
this small population. In insulin-dependent diabetes mellitus, however, the bronchodila-tation produced by inhaled atropine has been reported to be lower in patients with symp-toms of autonomic neuropathy and depressed HR responses to autonomic tests (14). The reasons for a similar bronchomotor response of the control and diabetic groups in our study may be explained by lower severity of the local autonomic dysfunction and or meta-bolic characteristics of type 2 disease. The diabetic group had a less severe cardiac dysautonomy as compared to that previously reported for insulin-dependent patients (14). The lung volumes and capacities were not reduced in the diabetic group when com-pared to the control group, even with the results normalized in terms of predicted val-ues. The changes in these parameters re-ported for insulin-dependent young diabetic patients have been explained on the basis of changes in the distension property of the binomial lungs/thorax (7,8,32) or of changes in the strength of respiratory muscles due in part to the peripheral neuropathy. Normal values of these parameters are compatible with relative preservation or only mild im-pairment.
During the basal period before the ad-ministration of atropine, the maximal expi-ratory flows or derivable values of the dia-betic group in lung volumes close to the total lung capacity did not show any significant difference compared to the control group data. This finding is compatible with the absence of changes in large airway resis-tance. This was corroborated functionally by normal values of Raw and SGaw in the diabetic group and reinforced the relative preservation of respiratory muscle function since the determinants of these flows are resistance of large airways and muscle effort (33,34).
However, for lung volumes lower than approximately 50% FVC, a significant re-duction of the expiratory flows - FEF25-75%,
the diabetic group as compared to the control group. Moreover, independently of the dia-betic subgroup (non-denervated or dener-vated), more than 50% of the patients pre-sented end-expiratory flows below the nor-mal values established in the literature (35). Although we have not found a clear consen-sus in the literature regarding the functional meaning of the isolated end-expiratory flow reduction, classic physiologic studies involv-ing the lung static recoil, the increase in airway resistance in the upstream segment from the alveoli to the equal pressure point, and the phenomenon of dynamic airway com-pression permit us to suggest their associa-tion with abnormalities in elastic recoil forces and peripheral airways. Thus, in spite of the evidence that in normal individuals the small airways barely contribute to total resistance, in the presence of obstruction their contribu-tion to total airway resistance may increase significantly and we believe this may be detected through regular forced expiratory maneuvers. In this case, the lung static recoil and the resistance of small airways can be considered important elements in determin-ing the intensity of these flows (34,36) and both can be modified by several physiologi-cal factors such as metabolic lung
involve-ment by diabetes, especially related to the elastic matrix (8), peripheral airway diseases, and abnormal vagal activity. The change in bronchomotor tone that can result from de-nervation may cause a variable change/re-duction of lung elastic recoil, the propelling power of the flow, associated with different degrees of airway resistance variation in spite of the bronchodilator effect (37). Our results concerning the action of the anticholinergic drug are not compatible, by themselves, with the presence of detectable parasympathetic airway denervation. Airway structural changes were possibly indicated on the basis of the flow decrease detected, as corroborated by data from the N2 washout test, which showed
slightly higher SIII values in the diabetic
group. In spite of the observed atropine re-sponse, it cannot be ruled out that part of these alterations are a consequence of some degree of denervation.
In conclusion, it was possible to demon-strate in a subgroup of type 2 diabetic pa-tients evidence of autonomic dysfunction, mainly restricted to the parasympathetic sys-tem, which was not associated with bron-chomotor tone alterations. Yet, a small air-way dysfunction was detected in the same diabetic patients.
References
1. Vracko RD, Thorning D & Huang TW (1979). Basal lamina of alveolar epithelium and capillaries: quantitative changes with aging and in
diabetes mellitus. American Review of Respiratory Disease, 120:
973-983.
2. Fuso L, Cotroneo P, Basso S, DeRosa M, Manto A, Ghirlanda G & Pistelli R (1996). Postural variations of pulmonary diffusing capacity
in insulin-dependent diabetes mellitus. Chest, 110: 1009-1013.
3. Ljubic S, Metelko Z, Car N, Roglic C & Drazic Z (1998). Reduction of
diffusion capacity for carbon monoxide in diabetic patients. Chest,
114: 1033-1035.
4. Kodolova IM, Lysenko LV & Saltykov BB (1982). Changes in the
lungs in diabetes mellitus. Arkhiv Patologii, 44: 35-40.
5. Madia AM, Rozovski SJ & Kagan HM (1979). Changes in lung lysyl
oxidase activity in streptozotocin-diabetes and in starvation.
Bio-chimica et Biophysica Acta, 585: 481-487.
6. Wanke T, Formanek D, Auinger M, Popp W, Zwick H & Irsigler K (1991). Inspiratory muscle performance and pulmonary function
changes in insulin-dependent diabetes mellitus. American Review
of Respiratory Disease, 143: 97-100.
7. Schnapf BM, Banks RA, Silverstein JH, Rosenbloom AL, Chesrown SE & Laughlin GM (1984). Pulmonary function in insulin-dependent
diabetes mellitus with limited joint mobility. American Review of
Respiratory Disease, 130: 930-932.
8. Schuyler MR, Niewoehner DE, Inkley SR & Kohn R (1976). Abnormal
lung elasticity in juvenile diabetes mellitus. American Review of
Respiratory Disease, 113: 37-41.
9. Sandler M, Bunn AE & Stewart RI (1987). Cross-section study of pulmonary function in patients with insulin-dependent diabetes
mel-litus. American Review of RespiratoryDisease, 135: 223-229.
10. Kennedy WR, Navarro X, Sakuta M, Mandell H, Knox CK & Sutherland DE (1989). Physiological and clinical correlates of
cardio-respiratory reflexes in diabetes mellitus. Diabetes Care, 12:
399-408.
Histopathological heterogeneity of neuropathy in insulin-dependent and non-insulin-dependent diabetes, and demonstration of axo-glial
dysjunction in human diabetic neuropathy. Journal of Clinical
Investi-gation, 81: 349-364.
12. Tantucci C, Scionti L, Bottini P, Dottorini ML, Puxeddu E, Casucci G & Sorbini CA (1997). Influence of autonomic neuropathy of different severities on the hypercapnic drive to breathing in diabetic patients. Chest, 112: 145-153.
13. Douglas NJ, Campbell IW, Ewing DJ, Clark BF & Flenley DC (1981). Reduced airway vagal tone in diabetic patients with autonomic
neuropathy. Clinical Science, 61: 581-584.
14. Fonseca CMCS, Manço JC, Gallo Jr L, Barreira AA & Foss MC (1992). Cholinergic bronchomotor tone and airway caliber in insulin
dependent diabetes mellitus. Chest, 101: 1038-1043.
15. Marin-Neto JA, Gallo Jr L, Manço JC, Rassi A & Amorim DS (1975). Postural reflexes in chronic Chagas’ heart disease: heart rate and
arterial pressure responses. Cardiology, 60: 343-357.
16. American Thoracic Society (1987). Standardization of spirometry.
Statement of the American Thoracic Society. American Review of
Respiratory Disease, 136: 1285-1307.
17. Crapo RO, Morris RH & Gardner RM (1981). Reference spirometric values using techniques and equipment that meet at
recommenda-tion. American Review of Respiratory Disease, 123: 659-664.
18. Sorensen JB, Morris AH, Crapo RO & Gardner RM (1980). Selection
of the best spirometric values for interpretation. American Review
of Respiratory Disease, 122: 802-805.
19. DuBois AB, Botelho SY & Bedell GN (1956). A rapid plethysmo-graphic method for measuring thoracic gas volume: a comparison with a nitrogen washout method for measuring functional residual
capacity in normal subjects. Journal of Clinical Investigation, 35:
322-326.
20. DuBois AB, Botelho SY & Comroe Jr JH (1956). A new method for measuring airway resistance in man using a body plethysmograph: values in normal subjects and in patients with respiratory disease. Journal of Clinical Investigation, 35: 327-335.
21. Manco JC, Hyatt RE & Rodarte JR (1987). Respiratory impedance in normal humans: effects of bronchodilatation and
bronchoconstric-tion. Mayo Clinic Proceedings, 62: 487-497.
22. Rodarte JR, Hyatt RE, Rehder K & Marsh HM (1977). New tests for
the detection of obstructive pulmonary disease. Chest, 72: 762-768.
23. Buist AS & Ross BB (1973). Quantitative analysis of the alveolar
plateau in the diagnosis of early airway obstruction. American
Re-view of Respiratory Disease, 108: 1078-1087.
24. O’Brien IAD, O’Hare P & Corrall RJM (1986). Heart rate variability in
healthy subjects: effect of age and the derivation of normal ranges
for tests of autonomic function. British Heart Journal, 55: 348-354.
25. Amorim DS, Marin-Neto JA, Maciel BC, Gallo Jr L, Terra-Filho J & Manço JC (1988). Cardiac autonomic function in healthy elderly
people. Geriatric Cardiovascular Medicine, 1: 65-71.
26. Molgaard H, Hermansen K & Bjerregaard P (1994). Spectral compo-nents of short-term RR interval variability in healthy subjects and
effects of risk factors. European Heart Journal, 15: 1174-1183.
27. Marin-Neto JA, Gallo Jr L, Manço JC, Rassi A & Amorim DS (1980). Mechanisms of tachycardia on standing: studies in normal
individu-als and in chronic Chagas’ heart patients. Cardiovascular Research,
14: 541-550.
28. Gallo Jr L, Marin-Neto JA, Manço JC, Rassi A & Amorim DS (1975). Abnormal heart rate responses during exercise in patients with
Chagas’ disease. Cardiology, 60: 147-162.
29. Wheeler T & Watkins PJ (1973). Cardiac denervation in diabetes. British Medical Journal, 4: 584-586.
30. Ewing DJ, Campbell IW & Clarke BF (1980). The natural history of
diabetic autonomic neuropathy. Quarterly Journal of Medicine, 49:
95-108.
31. Pfeifer MA, Cook D, Brodsky J, Tice D, Reenan A, Swedine S, Halter JB & Porte Jr D (1982). Quantitative evaluation of cardiac
parasym-pathetic activity in normal and diabetic man. Diabetes, 31: 339-345.
32. Bell D, Collier A & Matthews DM (1988). Are reduced lung volume in
IDDM due to defect in connective tissue? Diabetes, 37: 829-831.
33. Ingran RH, McFadden ER, Wellman JJ & Mead J (1977). Relative contribution of large and small airway to flow limitation in normal
subjects before and after atropine and isoproterenol. Journal of
Clinical Investigation, 59: 696-703.
34. Fry DL & Hyatt RE (1960). Pulmonary mechanics: a unified analysis of the relationship between pressure, volume and gas flow in the
lung of normal and diseased human subjects. American Journal of
Medicine, 29: 672-689.
35. Knudson RJ, Slatin RC, Lebowitz MD & Burrows B (1971). The maximal expiratory flow-volume curve. Normal standards, variability,
and effects of age. American Review of Respiratory Disease, 113:
587-600.
36. Mead J, Turner JM, Macklem PT & Little JB (1967). Significance of the relationship between lung recoil and maximum expiratory flow. Journal of Applied Physiology, 22: 95-108.
37. Terra-Filho J, Gallo Jr L, Marin-Neto JA, Amorim DS, Maciel BC &
Manco Jr L (1987). Effects of atropine on lung mechanics.