CLINICAL SCIENCE
Trends and predictors of changes in pulmonary
function after treatment for pulmonary tuberculosis
Kuei-Pin Chung,IJung-Yueh Chen,II Chih-Hsin Lee,IIIHuey-Dong Wu,IVJann-Yuan Wang,IVLi-Na Lee,I Chong-Jen Yu,IVPan-Chyr Yang,IVthe TAMI GroupVIDepartment of Laboratory Medicine, National Taiwan University Hospital and National Taiwan University College of Medicine, Taipei, Taiwan. IIDepartment of Internal Medicine, E-Da Hospital, Kaohsiung, Taiwan.IIIDepartment of Internal Medicine, Buddhist Tzu Chi General Hospital, Taipei Branch, Taipei, Taiwan.IVDepartment of Internal Medicine, National Taiwan University Hospital and National Taiwan University College of Medicine, Taipei, Taiwan.VTaiwan Anti-Mycobacteria Investigation (TAMI) group: Jann-Yuan Wang, Li-Na Lee, Chong-Jen Yu, Pan-Chyr Yang, Wei-Juin Su, Chin-Chung Shu, Hsin-Chih Lai, Chih-Hsin Lee, Ming-Chih Yu, and Vin-Cent Wu.
OBJECTIVES: The present study aimed to investigate the trends in changes in pulmonary function and the risk factors for pulmonary function deterioration in patients with pulmonary tuberculosis after completing treatment.
INTRODUCTION:Patients usually have pulmonary function abnormalities after completing treatment for pulmonary tuberculosis. The time course for changes in pulmonary function and the risk factors for deterioration have not been well studied.
METHODS:A total of 115 patients with 162 pulmonary function results were analyzed. We retrieved demographic and clinical data, radiographic scores, bacteriological data, and pulmonary function data. A generalized additive model with a locally weighted scatterplot smoothing technique was used to evaluate the trends in changes in pulmonary function. A generalized estimating equation model was used to determine the risk factors associated with deterioration of pulmonary function.
RESULTS:The median interval between the end of anti-tuberculosis treatment and the pulmonary function test was 16 months (range: 0 to 112 months). The nadir of pulmonary function occurred approximately 18 months after the completion of the treatment. The risk factors associated with pulmonary function deterioration included smear-positive disease, extensive pulmonary involvement prior to anti-tuberculosis treatment, prolonged anti-tuberculosis treatment, and reduced radiographic improvement after treatment.
CONCLUSIONS:After the completion of anti-tuberculosis TB treatment, several risk factors predicted pulmonary function deterioration. For patients with significant respiratory symptoms and multiple risk factors, the pulmonary function test should be followed up to monitor the progression of functional impairment, especially within the first 18 months after the completion of anti-tuberculosis treatment.
KEYWORDS: completion of treatment; disease extent; pulmonary function; pulmonary tuberculosis.
Chung KP, Chen JY, Lee CH, Wu HD, Wang JY, Lee LN. Trends and predictors of changes in pulmonary function after treatment for pulmonary tuberculosis. Clinics. 2011;66(4):549-556.
Received for publication onOctober 19, 2010;First review completed onNovember 17, 2010;Accepted for publication onDecember 17, 2010 E-mail: [email protected]
Tel.: 886-2-2356-2905
INTRODUCTION
Pulmonary tuberculosis (TB) can cause parenchymal destruc-tion by up-reguladestruc-tion of several proteases and dysreguladestruc-tion of protease control.1 The histopathological abnormalities after treatment for pulmonary TB include fibrosis, bronchiectasis, and brochial stenosis, all of which can cause pulmonary function abnormalities.2–3Previous studies have evaluated the changes in pulmonary function before, during and after
pulmonary TB treatment.4–17 Between 48.7% and 76% of
patients had pulmonary function abnormalities after complet-ing pulmonary TB treatment.9–10,13–15,17Although some studies
have shown obstructive defects as the main abnormality, recent studies have shown that abnormalities could be obstructive, restrictive, or mixed defects.14–15,17 In a study performed on gold miners in South Africa, forced expiratory volume in the first second (FEV1) and forced vital capacity (FVC) were found
to be worse six months after tuberculosis treatment and were stabilized 13 to 18 months after treatment.16The impairment in pulmonary function after completing pulmonary TB treatment is related to long-term respiratory symptoms, which affect quality of life.11–12,18
It is important to identify patients with risk factors for pulmonary function deterioration after the completion of
Copyrightß2011CLINICS– This is an Open Access article distributed under
pulmonary TB treatment. However, little is known about the trends in the changes in pulmonary function and the risk factors associated with pulmonary function deterioration. Therefore, we conducted a study to investigate the trends and predictors of the changes in pulmonary function in patients with pulmonary tuberculosis after the completion of treatment.
METHODS AND MATERIALS
Subjects
From January 2000 to December 2008, 2,789 patients with culture-confirmed pulmonary TB were identified at the National Taiwan University Hospital, a tertiary care referral center with 2,000 beds in northern Taiwan. Among these patients, 213 (7.6%) underwent pulmonary function tests after completing pulmonary TB treatment. Ninety-eight patients were excluded from further analysis due to the presence of the following conditions before the diagnosis of pulmonary TB: (1) pulmonary co-morbidities, including asthma, chronic obstructive airway disease (COPD) confirmed by spirometry, pneumoconiosis, interstitial lung disease, history of respiratory failure requiring mechanical ventilation, lung cancer, and lung resection; (2) congestive heart failure (New York Heart Association functional class .2); (3) autoimmune disease; and (4)
human immunodeficiency virus infection.19The remaining 115 patients with 162 pulmonary function test results were analyzed. Tests performed within five years after the end of anti-tuberculosis treatment were selected to investigate the predictors of pulmonary function. This study was approved by the International Review Board of the National Taiwan University Hospital.
Mycobacteriological studies
Mycobacteriological studies were performed using stan-dard procedures.20–22 Briefly, sputum specimens were decontaminated with NaOH-citrate-N-acetyl-L-cysteine and then neutralized and centrifuged. The specimen sediments were inoculated onto Lo¨wenstein-Jensen (LJ) slants and into Mycobacterium growth indicator tubes (MGIT) using a fluorometric BACTEC technique (BACTEC MGIT 960 system; Becton-Dickinson Diagnostic Instrument Systems; Sparks, MD). The LJ slants were incubated in a CO2 incubator for an initial week and in ambient air for
another seven weeks at 35
˚
C. Growth in MGIT was observed for at least 42 days.M. tuberculosiswas routinely identified using conventional biochemical methods.Pulmonary function testing
The pulmonary function tests were performed using MasterScreen, (Jaeger, Germany) or Vmax 6200 (Sensormedics
Corp., USA) spirometers in our pulmonary function laboratory, according to the recommendation by the American Thoracic Society.7,23–24Daily calibration was performed for each machine before measuring pulmonary function. Patient data, including age, sex, weight, height, medication history, and smoking status, were collected via standard questionnaires prior to pulmonary function testing. Pulmonary function tests were performed by trained technicians with the patients in sitting postures. Each patient performed at least three acceptable forced expiratory maneuvers, which fulfilled the criteria of repeatability.24 The reference equations for FEV1, FVC, and
FEV1/FVC were obtained from a previous study of 354
non-smoking healthy Chinese patients (online supplement 1) and were used to calculate the predicted values of corresponding pulmonary function parameters.25Normal pulmonary function should have FEV1$80%, FVC$80%, and FEV1/FVC$70% of
predicted values. For abnormal pulmonary function, an obstructive defect was defined as FEV1/FVC,70%, a restrictive
defect as an FEV1/FVC ratio $70% and FVC ,80%, and a
mixed defect as FEV1/FVC,70% and FVC,80% of predicted
values.
Data collection
From patients’ medical records, we retrieved demo-graphic data, smoking history, underlying co-morbidities, radiographic findings, laboratory results, pulmonary TB treatment courses, and results of pulmonary function tests. The standard anti-tuberculosis regimen consisted of oral isoniazid, rifampicin, and ethambutol, plus pyrazinamide
daily during the first two months and isoniazid plus rifampicin daily during the following four months.
According to previous studies, non-tuberculosis myco-bacteria (NTM) are present in the respiratory tracts of 7.1% to 7.3% of patients with pulmonary tuberculosis.26–27It was unknown whether these NTM isolates would cause pul-monary function deterioration. Therefore, we recorded the frequency of NTM isolates (0, 1 or $2) from sputum samples collected after beginning anti-tuberculosis treat-ment and before pulmonary function testing.
Chest radiographs that were obtained before and after anti-tuberculosis treatment were reviewed. Radiographic scores (RS) of chest radiographs9that were taken before and after anti-tuberculosis treatment were recorded (in accor-dance with a previous study) to define the extent of the disease. Briefly, each lung was divided into three areas, and each area was rated on a four-point scale (0 to 3) for the extent of infiltration. The sum of the points from all six areas constituted the RS. A greater extent of infiltration resulted in a larger RS.
Statistical analysis
Continuous variables were reported as means (standard deviation) and categorical variables as numbers (percen-tage). Changes in pulmonary function over time after the completion of anti-tuberculosis treatment have been shown to be biphasic (non-linear).16Therefore, we first established three generalized additive models for FEV1, FVC, and
FEV1/FVC, with the Gaussian distribution selected.7 In Table 1 -Clinical data and pulmonary function results.
Characteristic Entire group (N = 106) Patients with NTM isolates (N = 28)
Clinical data
Age (years) 59.3 [21.2] 71.1 [14.8]
Male 80 (75.5%) 23 (82.1%)
History of smoking 51 (48.1%) 15 (53.6%)
Co-morbidity
Malignancy* 11 (10.4%) 3 (10.7%)
Diabetes mellitus 10 (9.4%) 5 (17.9%)
Smear-positive 43 (40.6%) 12 (42.9%)
Modification of anti-tuberculosis regimen 20 (18.9%) 5 (17.9%)
Treatment duration (months) 9.2 [4.3] 8.4 [2.9]
Radiographic score before treatment 6.5 [4.6] 7.0 [3.9]
Radiographic score after treatment 3.4 [3.3] 4.2 [3.9]
Non-tuberculosis mycobacterium isolate{
0 78 (73.6%)
1 16 (15.1%)
$2 12 (11.3%)
Pulmonary function results{
FEV1(L) 1.90 [0.79] 1.77 [0.78]
FEV1/predicted FEV1(%) 77.25 [26.44] 86.37 [31.88]
FVC (L) 2.71 [0.89] 2.41 [0.97]
FVC/predicted FVC (%) 87.94 [20.75] 88.08 [26.92]
FEV1/FVC (%) 70.35 [15.40] 74.67 [14.77]
Interpretation
Normal 46 (32.9%) 13 (33.3%)
Obstructive 68 (48.6%) 16 (41.0%)
Restrictive 13 (9.3%) 4 (10.3%)
Mixed 13 (9.3%) 6 (15.4%)
The data are presented as number (percentage) or mean [standard deviation].
*The malignancies were head and neck cancer in 3, gastrointestinal cancer in 3, breast cancer in 2, and 1 each for hepatocellular carcinoma, prostate
cancer and bladder cancer. All of these patients had no clinical evidence of pulmonary metastases before the pulmonary function test.
{Including 8 Mycobacterium avium complex, 17 rapidly growing mycobacteria, 2 Mycobacterium gordonae, and 1 Mycobacterium scrofulaceum.
{
A
B
addition to time after the completion of pulmonary TB treatment, we included 3 other covariates into these models: age, body weight, and height. Locally weighted scatterplot smoothing (LOESS) was selected as the smoothing techni-que for the smooth functions of the four covariates. From the partial prediction curves of the smooth functions of time after the completion of pulmonary TB treatment, we determined the time point at which the worst pulmonary function occurred.
Some subjects who were enrolled in this study performed repeated pulmonary function tests over time. The pulmon-ary function test results were not independent of each other, and a generalized linear model could not be applied for analysis. Therefore, we performed statistical analyses using generalized estimating equation (GEE) models with a stepwise variable selection procedure to identify the predictors of pulmonary function (FEV1and FVC) and the
predictors of obstructive defect development within 5 years after completion of pulmonary TB treatment. The time interval (DT) between the date of each pulmonary function test and the timing of the worst pulmonary function (obtained by LOESS smoothing models) was included in the analysis. Other parameters with the potential to influence pulmonary function after completion of pulmon-ary TB treatment were also included in the analysis; these parameters were demographic data, smoking history, underlying co-morbidities, radiographic findings, labora-tory results, and pulmonary tuberculosis treatment courses. A two-sidedpvalue,0.05 was considered to be significant. All analyses were performed using SAS software (version 9.1.3, SAS Institute Inc., Cary, NC, U.S.A.).
RESULTS
Patients and pulmonary function
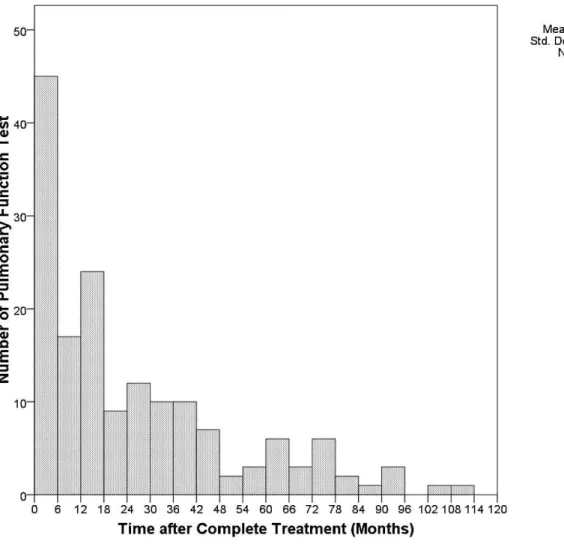
A total of 115 patients underwent 162 pulmonary function tests after they completed pulmonary TB treatment within the study period. Twenty-eight patients had more than one pulmonary function test result, and the time between repeated pulmonary function tests was at least six months (Figure 1). The median interval between the completion of pulmonary tuberculosis treatment and a pulmonary func-tion test was 16 months (range: 0 to 112 months). Among these 115 patients, 106 (92.2%) underwent 140 (86% of all pulmonary function tests) pulmonary function tests within 5 years. Table 1 summarizes the baseline clinical character-istics of these 106 patients and the results of the 140 pulmonary function tests. The mean age at the first pulmonary function test was 59.3 years (range: 19 to 90). Ninety-four (67.1%) pulmonary function tests were abnor-mal, with obstructive defects being the most common problem (68 tests, 48.6%). Twenty-eight patients (26.4%) had at least one concurrent NTM isolate; these patients contributed 39 pulmonary function test results (Table 1). The mean age at which the patients underwent their first pulmonary function test was older in those patients with NTM isolates (p,0.001 by Student’s t-test, compared to those without NTM isolates). Otherwise, they had no
significantly different characteristics compared to those patients without NTM isolates.
From partial prediction curves, we observed trends of biphasic changes in FEV1, FVC, and the FEV1/FVC ratio with
time after completion of pulmonary tuberculosis treatment (Figure 2A–C). Deterioration of pulmonary function occurred initially. The nadirs of the three smoothing curves occurred at 18 months.
Predictors of pulmonary function after completion of anti-tuberculosis treatment
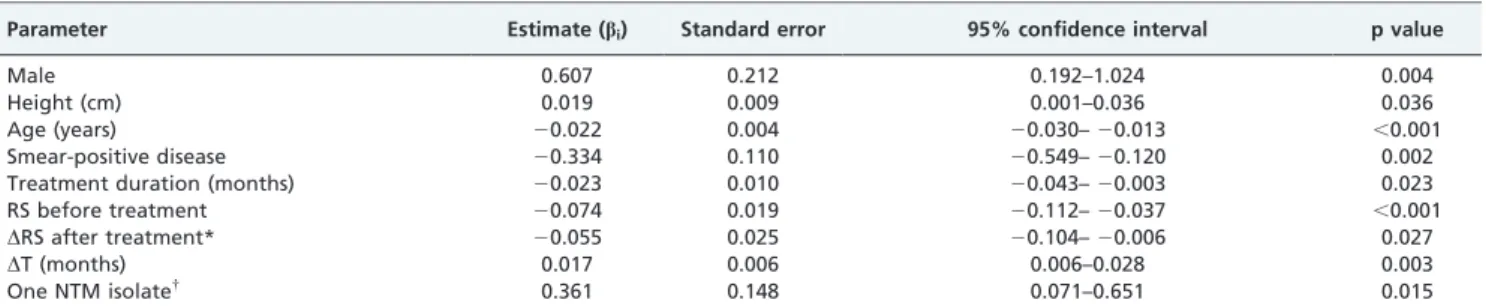
The predictors of FEV1within 60 months after completion
of anti-tuberculosis treatment are shown in Table 2 (for statistical details, please refer to online supplement 2). The time variable (DT), defined as the absolute time interval between the date of the pulmonary function test and the timing of worst FEV1 (i.e., 18 months), was significantly
correlated with FEV1. Patients who had smear-positive
disease, longer treatment duration, higher RS before treatment, or less RS improvement after treatment had worse FEV1after completion of anti-tuberculosis treatment.
From the end of the anti-tuberculosis treatment to the nadir of FEV1, the estimated monthly reduction in FEV1 was
18.83 mL (0.017 L/month * 1 month + 0.022 L/year * 1
month/12 = 0.01883 L) after adjusting for the other para-meters.
The predictors of FVC within 60 months after completion of anti-tuberculosis treatment are listed in Table 3. Patients had worse FVC after completion of anti-tuberculosis treatment if they had longer treatment duration, a change in regimen during treatment, higher RS before treatment, or less RS improvement after treatment.
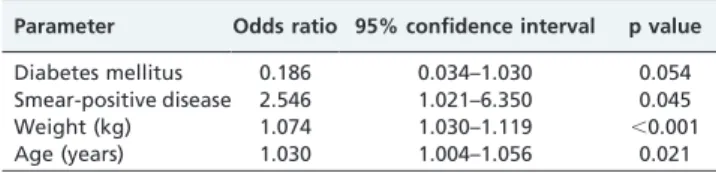
We also investigated the risk factors of obstructive defects (FEV1/FVC ratio ,70) after completion of treatment for
pulmonary TB (Table 4). Patients with smear-positive disease had a higher risk of obstructive defects after completing anti-tuberculosis treatment (odds ratio 2.546, p= 0.045).
DISCUSSION
Our results showed that after completing pulmonary TB treatment, patients experienced gradual declines in pul-monary function until approximately 18 months. The risk factors for pulmonary function deterioration in association with TB included smear-positive disease, extensive pul-monary involvement with poor radiographic improvement after treatment, prolonged duration of treatment, and change in regimen.
Several co-morbidities could affect pulmonary function test results, including chronic lung diseases, severe con-gestive heart failure, autoimmune diseases, and HIV infection. Autoimmune diseases could have pulmonary involvement, possibly leading to significant changes in pulmonary function.28 In addition, patients with HIV infection have a high risk of contracting respiratory diseases such as Pneumocystis jirovecii infection and recurrent bacterial pneumonia.29Therefore, in our study, we excluded Figure 2 -Shows partial prediction curves that describe how the time after completing anti-tuberculosis treatment affected changes in pulmonary function, including FEV1(2A), FVC (2B), and FEV1/FVC (2C). The y axis refers to the changes in FEV1(L) (2A), FVC (L) (2B), and
FEV1/FVC (%) (2C) at different time points after completing anti-tuberculosis treatment (time 0: end of anti-tuberculosis treatment).
patients with these co-morbidities to give a more accurate description of the changes in pulmonary function and trends after completion of pulmonary TB treatment.
The time course for changes in pulmonary function after completing anti-tuberculosis treatment has never been well-studied. One previous study showed that the annual decrease in FEV1was 35.3 mL in patients with obstructive
defects within 15 years after the end of anti-tuberculosis treatment.30However, the anti-tuberculosis treatment in this study was less effective than the modern four-drug combination regimen, and exposure to other noxious environmental factors may have contributed to changes in pulmonary function during long follow-up time periods. In a study performed in Cape Town, South Africa by Hnizdo et al., the pulmonary function of coal miners with pulmonary TB reached a nadir at approximately 6 months after completing anti-tuberculosis treatment (with a monthly FEV1reduction of 56.8 mL) and stabilized approximately 7
to 12 months later.16 Our results confirmed the biphasic
change in pulmonary function over time after the end of anti-tuberculosis treatment, with a monthly FEV1reduction
of 18.83 mL within the first 18 months. The greater declines in pulmonary function that were noted in the coal miners with TB were probably due to the concomitant presence of pneumoconiosis. In addition, without adjusting for smoking history or disease extent in the analysis, it is difficult to determine the contribution of each factor to the abnormal-ities in pulmonary function.
Smear-positive disease, which suggests either a high mycobacterial load or endobronchial involvement, has been shown to be an important predictor of pulmonary function
deterioration and obstructive defects after the completion of pulmonary TB treatment.31 In accordance with previous
studies, we found that disease extent was a predictor of pulmonary function deterioration after the completion of pulmonary TB treatment.10,12–13 However, the previous
studies did not consider the timing of the pulmonary function test. Smoking, which is the most important risk factor for COPD, increases the risk of active pulmonary tuberculosis.32–34 The impact of smoking on pulmonary
function abnormalities after pulmonary TB infection is unknown, and previous studies have shown inconsistent results.9–10,15,17 In our study, smoking history was not a
significant predictor of pulmonary function deterioration. The reason for this finding might be that most subjects with a history of smoking in our study had quit smoking before or immediately after their diagnosis with pulmonary TB, and subjects with COPD, as confirmed by spirometry, were excluded. It might also be the case that short-term changes in pulmonary function are mainly caused by post-tubercu-losis pulmonary inflammation, which masks pulmonary function deterioration due to smoking.
It is not uncommon for patients with pulmonary TB to have NTM isolation from respiratory specimens.26–27 The
clinical significance of NTM isolation, especially with respect to pulmonary function, is unclear in pulmonary tuberculosis patients; it might be the result of colonization, specimen contamination or true infection.35 Patients with
multiple NTM isolates were more likely to be symptomatic and had longer treatment times for pulmonary TB. Cavitations were more frequently visualized by chest radiographs in patients with NTM isolates.26Further study Table 2 -Predictors of FEV1within 60 months after completion of treatment for pulmonary tuberculosis.
Parameter Estimate (bi) Standard error 95% confidence interval p value
Male 0.607 0.212 0.192–1.024 0.004
Height (cm) 0.019 0.009 0.001–0.036 0.036
Age (years) 20.022 0.004 20.030–20.013 ,0.001
Smear-positive disease 20.334 0.110 20.549–20.120 0.002
Treatment duration (months) 20.023 0.010 20.043–20.003 0.023
RS before treatment 20.074 0.019 20.112–20.037 ,0.001
DRS after treatment* 20.055 0.025 20.104–20.006 0.027
DT (months) 0.017 0.006 0.006–0.028 0.003
One NTM isolate{
0.361 0.148 0.071–0.651 0.015
Definitions of abbreviations: RS: radiographic score;DT: the absolute of the time interval between the date of the pulmonary function test to the time of the pulmonary function nadir (i.e., 18 months); NTM: non-tuberculosis mycobacterium.
*DRS = (RS after treatment) – (RS before treatment). Patients with more radiographic improvement had more negativeDRS values.
{Only one NTM isolate was obtained from sputum samples during the time between the diagnosis of pulmonary tuberculosis and the pulmonary function
test.
Table 3 -Predictors of FVC within 60 months after completion of treatment for pulmonary tuberculosis.
Parameter Estimate (bi) Standard error 95% confidence interval p value
Male 0.613 0.134 0.351–0.876 ,0.001
Weight (kg) 0.020 0.006 0.008–0.031 0.001
Diabetes mellitus 20.453 0.186 20.819–20.088 0.015
Malignancy 20.588 0.185 20.951–20.226 0.002
Treatment duration (months) 20.035 0.012 20.058–20.012 0.003
Change in regimen 20.039 0.118 20.571–20.107 0.004
RS before treatment 20.112 0.027 20.164–20.059 ,0.001
DRS after treatment* 20.102 0.029 20.159–20.045 0.001
Definition of abbreviation: RS: radiographic score.
*
is needed to clarify the clinical significance of NTM colonization in changes in pulmonary function after completion of anti-tuberculosis treatment.
There are some limitations of our study. First, the study was limited by retrospective data and a relatively small sample size. Without longitudinal follow-up data, we could miss individual characteristics that might have significant impacts on pulmonary function. Second, selection bias might exist because our study population was treated in a tertiary medical center. Nevertheless, we believe that this is a minor concern because more than 90% of the patients with pulmonary TB were ambulatory and sought primary care in the outpatient department. Third, only 7.3% of our patients underwent pulmonary function tests after completing anti-tuberculosis treatment. Patients who received pulmonary function tests could have had more prominent respiratory symptoms and worse pulmonary function compared to patients who did not undergo such tests. Nevertheless, our results showed a prominent loss of pulmonary function after pulmonary TB infection. Pulmonary function follow-up analysis is recommended in patients with pre-existing lung disease who are at risk of pulmonary decompensation after pulmonary tuberculosis.
CONCLUSIONS
In conclusion, after completion of pulmonary TB treat-ment, the risk factors for pulmonary function deterioration include smear-positive disease, extensive disease before treatment, prolonged treatment duration, and less radio-graphic improvement after treatment. For patients with significant respiratory symptoms and multiple risk factors, the pulmonary function test should be followed up to monitor the progression of functional impairment and responses to treatment, especially within the first 18 months after completing anti-tuberculosis treatment.
ACKNOWLEDGMENTS
We would like to thank Fu-Chang Hu and Chia-Chi Cheng for their assistance in statistical computation.
REFERENCES
1. Dheda K, Booth H, Huggett JF, Johnson MA, Zumla A, Rook GA. Lung remodeling in pulmonary tuberculosis. J Infect Dis. 2005;192:1201–9, doi: 10.1086/444545.
2. Curtis JK. The significance of bronchiectasis associated with pulmonary tuberculosis. Am J Med. 1957;22:894–903, doi: 10.1016/0002-9343(57)90025-6.
3. Rosenzweig DY, Stead WW. The role of tuberculosis and other forms of bronchopulmonary necrosis in the pathogenesis of bronchiectasis. Am Rev Respir Dis. 1966;93:769–85.
4. Garvin A, Lundsgaard C, Van Slyke DD. Studies of Lung Volume : Ii. Tuberculous Men. J Exp Med. 1918;27:87–94, doi: 10.1084/jem.27.1.87.
5. Garvin A, Lundsgaard C, Van Slyke DD. Studies of Lung Volume : Iii. Tuberculous Women. J Exp Med. 1918;27:129–42, doi: 10.1084/jem.27.1. 129.
6. Anno H, Tomashefski JF. Studies on the impairment of respiratory function in pulmonary tuberculosis. Am Rev Tuberc. 1955;71:333–48. 7. Kanagami H, Katsura T, Shiroishi K, Baba K, Ebina T. Studies on the
pulmonary diffusing capacity by the carbon monoxide breath holding technique. II. Patients with various pulmonary diseases. Acta Med Scand. 1961;169:595–609.
8. Simpson DG, Uschner M, Mc CJ. Respiratory function in pulmonary tuberculosis. Am Rev Respir Dis. 1963;87:1–16.
9. Snider GL, Doctor L, Demas TA, Shaw AR. Obstructive airway disease in patients with treated pulmonary tuberculosis. Am Rev Respir Dis. 1971;103:625–40.
10. Lancaster JF, Tomashefski JF. Tuberculosis--a cause of emphysema. Am Rev Respir Dis. 1963;87:435–7.
11. Gaensler EA, Lindgren I. Chronic bronchitis as an etiologic factor in obstructive emphysema; preliminary report. Am Rev Respir Dis. 1959;80 1, Part 2:185–93.
12. Birath G, Caro J, Malmberg R, Simonsson BG. Airways obstruction in pulmonary tuberculosis. Scand J Respir Dis. 1966;47:27–36.
13. Willcox PA, Ferguson AD. Chronic obstructive airways disease follow-ing treated pulmonary tuberculosis. Respir Med. 1989;83:195–8, doi: 10. 1016/S0954-6111(89)80031-9.
14. Plit ML, Anderson R, Van Rensburg CE, Page-Shipp L, Blott JA, Fresen JL, et al. Influence of antimicrobial chemotherapy on spirometric parameters and pro-inflammatory indices in severe pulmonary tubercu-losis. Eur Respir J. 1998;12:351–6, doi: 10.1183/09031936.98.12020351. 15. Pasipanodya JG, Miller TL, Vecino M, Munguia G, Garmon R, Bae S, et al.
Pulmonary impairment after tuberculosis. Chest. 2007 Jun;131:1817–24, doi: 10.1378/chest.06-2949.
16. Hnizdo E, Singh T, Churchyard G. Chronic pulmonary function impairment caused by initial and recurrent pulmonary tuberculosis following treatment. Thorax. 2000;55:32–8, doi: 10.1136/thorax.55.1.32. 17. Ramos LM, Sulmonett N, Ferreira CS, Henriques JF, de Miranda SS.
Functional profile of patients with tuberculosis sequelae in a university hospital. J Bras Pneumol. 2006;32:43–7, doi: 10.1590/S1806-37132006000100010.
18. Lee JH, Chang JH. Lung function in patients with chronic airflow obstruction due to tuberculous destroyed lung. Respir Med. 2003;97:1237–42, doi: 10.1016/S0954-6111(03)00255-5.
19. Bass AJ, Watanabe H, Mermel CH, Yu S, Perner S, Verhaak RG, et al. SOX2 is an amplified lineage-survival oncogene in lung and esophageal squamous cell carcinomas. Nat Genet. 2009;41:1238–42, doi: 10.1038/ng.465. 20. Murray PR. Manual of clinical microbiology. Washington, D.C.: ASM
Press; 1995.
21. Wang JY, Lee LN, Chou CS, Huang CY, Wang SK, Lai HC, et al. Performance assessment of a nested-PCR assay (the RAPID BAP-MTB) and the BD ProbeTec ET system for detection of Mycobacterium tuberculosis in clinical specimens. J Clin Microbiol. 2004;42:4599–603, doi: 10.1128/JCM.42.10.4599-4603.2004.
22. Diagnostic Standards and Classification of Tuberculosis in Adults and Children. This official statement of the American Thoracic Society and the Centers for Disease Control and Prevention was adopted by the ATS Board of Directors, July 1999. This statement was endorsed by the Council of the Infectious Disease Society of America, September 1999. Am J Respir Crit Care Med. 2000;161:1376–95.
23. Miller MR, Crapo R, Hankinson J, Brusasco V, Burgos F, Casaburi R, et al. General considerations for lung function testing. Eur Respir J. 2005;26:153–61, doi: 10.1183/09031936.05.00034505.
24. Miller MR, Hankinson J, Brusasco V, Burgos F, Casaburi R, Coates A, et al. Standardisation of spirometry. Eur Respir J. 2005;26:319–38, doi: 10. 1183/09031936.05.00034805.
25. Yang SC. [Re-evaluation of the ventilatory function in a normal Chinese: comparison with the results of a survey conducted 15 years ago]. J Formos Med Assoc. 1993;92 Suppl 3:S152–9.
26. Huang CT, Tsai YJ, Shu CC, Lei YC, Wang JY, Yu CJ, et al. Clinical significance of isolation of nontuberculous mycobacteria in pulmonary tuberculosis patients. Respir Med. 2009;103:1484–91, doi: 10.1016/j.rmed. 2009.04.017.
27. Jun HJ, Jeon K, Um SW, Kwon OJ, Lee NY, Koh WJ. Nontuberculous mycobacteria isolated during the treatment of pulmonary tuberculosis. Respir Med. 2009;103:1936–40, doi: 10.1016/j.rmed.2009.05.025. 28. Antoniou KM, Margaritopoulos G, Economidou F, Siafakas NM. Pivotal
clinical dilemmas in collagen vascular diseases associated with inter-stitial lung involvement. Eur Respir J. 2009;33:882–96, doi: 10.1183/ 09031936.00152607.
29. Wallace JM, Hansen NI, Lavange L, Glassroth J, Browdy BL, Rosen MJ, et al. Respiratory disease trends in the Pulmonary Complications of HIV Infection Study cohort. Pulmonary Complications of HIV Infection Study Group. Am J Respir Crit Care Med. 1997;155:72–80.
Table 4 -Predictors of obstructive defect (FEV1/FVC ,70%) within 60 months after completion of treatment for pulmonary tuberculosis.
Parameter Odds ratio 95% confidence interval p value
Diabetes mellitus 0.186 0.034–1.030 0.054
Smear-positive disease 2.546 1.021–6.350 0.045
Weight (kg) 1.074 1.030–1.119 ,0.001
30. Vargha G. Fifteen year follow-up of lung function in obstructive and non-obstructive pulmonary tuberculosis. Acta Med Hung. 1983;40:271–6. 31. Canetti G. Present aspects of bacterial resistance in tuberculosis. Am Rev
Respir Dis. 1965;92:687–703.
32. Davies PD, Yew WW, Ganguly D, Davidow AL, Reichman LB, Dheda K, et al. Smoking and tuberculosis: the epidemiological association and immunopathogenesis. Trans R Soc Trop Med Hyg. 2006;100:291–8, doi: 10.1016/j.trstmh.2005.06.034.
33. Leung CC, Yew WW, Chan CK, Tam CM, Lam CW, Chang KC, et al. Smoking and tuberculosis in Hong Kong. Int J Tuberc Lung Dis. 2003;7:980–6. 34. Maurya V, Vijayan VK, Shah A. Smoking and tuberculosis: an
association overlooked. Int J Tuberc Lung Dis. 2002;6:942–51. 35. Griffith DE, Aksamit T, Brown-Elliott BA, Catanzaro A, Daley C, Gordin