A gaso m e tric m e tho d to de te rm ine
e rythro cyte catalase activity
1Departamento de Ciências Fisiológicas, Fundação Faculdade Federal de Ciências
Médicas de Porto Alegre, Porto Alegre, RS, Brasil
2Instituto de Matemática, Pontifícia Universidade Católica do Rio Grande do Sul,
Porto Alegre, RS, Brasil A.J.S. Siqueira1,
J.O . Remião1,
A.M.P. Azevedo1 and
C.R.J. Azambuja2
Abstract
We describe a new gasometric method to determine erythrocyte catalase activity by the measurement of the volume of oxygen pro-duced as a result of hydrogen peroxide decomposition in a system where enzyme and substrate are separated in a special reaction test tube connected to a manometer and the reagents are mixed with a motor-driven stirrer. The position of the reagents in the test tube permits the continuous measurement of oxygen evolution from the time of mixing, without the need to stop the reaction by the addition of acid after each incubation time. The enzyme activity is reported as KHb, i.e., mg hydrogen peroxide decomposed per second per gram of hemoglobin (s-1 g Hb-1). The value obtained for catalase activity in
28 samples of hemolyzed human blood was 94.4 ± 6.17 mg H2O2 s-1
g Hb-1. The results obtained were precise and consistent, indicating
that this rapid, simple and inexpensive method could be useful for research and routine work.
Co rre spo nde nce
A.M.P. Azevedo Disciplina de Bioquímica Fundação Faculdade Federal de Ciências Médicas de Porto Alegre Rua Sarmento Leite, 245 90050-170 Porto Alegre, RS Brasil
Fax: + 55-51-226-7913 E-mail: anzevedo@ fffcmpa.tche.br Research supported by the Fundação Faculdade Federal de Ciências Médicas de Porto Alegre.
Received July 22, 1998 Accepted June 9, 1999
Ke y wo rds
·Erythrocyte
·Catalase assay
·Gasometry
Intro ductio n
Several methods have been described for the measurement of erythrocyte catalase ac-tivity. Most are based on the measurement of residual hydrogen peroxide after incubation with the enzyme or the volume of oxygen produced by decomposition of the substrate. Traditional gasometric methods include ma-nometers equipped with a burette (1), the ureometer of Ambard (2), specially designed manometers (3), as well as the Van Slyke apparatus (4). According to Rorth and Jensen (5) none of these methods can be considered fully satisfactory due to the extremely rapid action of catalase on hydrogen peroxide, which renders the reaction difficult to follow
at the beginning (6). In addition, there is a rapid decrease in the reaction velocity just a few seconds after the beginning of the reac-tion due to the formareac-tion of an inactive en-zyme-substrate complex (ES III), especially when the concentration of the substrate is above 0.1 M (7-10). Other nongasometric methods have been described: these include iodometry (11,12), titrimetry using potas-sium permanganate (13,14), polarimetry (15), spectrophotometry (16-18), colorimetry (19,20) and methods based on luminol chemi-luminescence (21,22).
ve-locity is considered to be constant only dur-ing the first few seconds after the beginndur-ing of the reaction (8), so that product formation must be measured immediately after mixing of the reagents for precise results(5). In addition, for catalase measurement attention must be paid to important technical details to obtain precise results. Blood samples are initially hemolyzed with distilled water, since enzyme activity is higher in the hemolysate. Blood samples can be stored at 4oC for more
than 72 h and some samples will not lose activity for as long as 21 days. In contrast, after dilution in water enzyme activity is re-duced presumably because the enzyme is rap-idly denatured(23,24).
Catalase activity can be measured at room temperature due to the low activation energy required for decomposition of the substrate (10). Tudhope(24) measured enzyme activ-ity at temperatures of 1, 8, 14 and 22oC and
did not observe significant differences, whereas at 37oC there was some enzyme
denaturation. According to Bonnichsen et al. (25), when determining catalase activity, the substrate concentrations should be low, the enzyme concentrations high and the in-cubation time short.
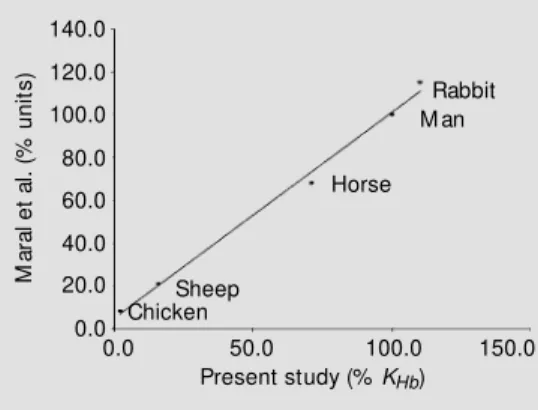
Maral et al. (21) determined erythrocyte catalase activity in different species by meas-uring the light emitted from oxidation of luminol by horseradish peroxidase. They con-sidered normal values for human blood to be 100 and reported other animal species as percent of this reference value.
In the present study we describe a gasometric method suited for measurement of oxygen evolution from the decomposition of hydrogen peroxide by catalase, starting from the time when the reagents are first mixed, without the need for acid denatur-ation of the enzyme for each measurement.
Mate rial and Me tho ds
Blood samples were obtained from healthy human adult subjects of both sexes aged 18
to 60 years and collected into heparinized flasks. Hemoglobin (Hb) levels were deter-mined with an automatic analyzer (Reflotron, Boehringer-Mannheim, Mannhein, Ger-many). Catalase activity was determined in duplicate at room temperature (range 20 to 24oC), measuring the volume of oxygen
pro-duced by decomposition of hydrogen perox-ide. We also determined catalase activity in 10 samples each of different species (chicken, sheep, rabbit and horse) and the results were compared to those of Maral et al. (21).
Me asure m e nt o f o xyge n
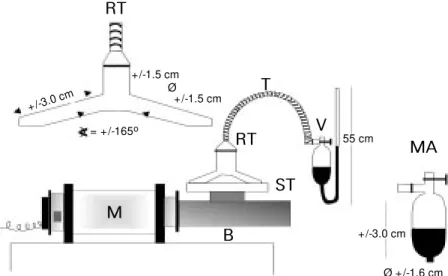
Hydrogen peroxide decomposition oc-curred in a reaction tube (RT) similar to that described by Meldrum and Roughton(26) which was connected to a manometer (MA) opened to the atmosphere. The reagents were mixed by connecting the reaction tube to a stirring motor (M). The motor, adapted from an electric knife, moves the blade mono-axially at a frequency of 1,950 cycles per minute and an amplitude of 0.7 cm. A sup-port (ST) for the RT was welded on the blade (B) as shown in Figure 1.
Calibratio n o f the m ano m e te r
The manometer was calibrated in order to determine the amount of hydrogen perox-ide that displaces the manometer column by a distance of 1.0 cm after complete decom-position. This is the manometer factor (Fm).
The manometer was filled with a solution of 0.15 g% Congo red. The calibration was achieved by dispensing 0.5 ml of 0.060 N hydrogen peroxide (0.51 mg H2O2) and 0.5
and the stirrer was then turned on. The stirrer was turned off after the displacement of the manometer liquid column had stopped, which indicated the decomposition of 0.51 mg of hydrogen peroxide. The displacement dis-tance (h) in centimeters was recorded and
further corrected for the standard conditions of temperature and pressure to obtain the corrected distance (hc). The ratio is a
constant that is characteristic for each ma-nometer used in this technique.
D e te rm inatio n o f catalase activity
The procedure was the same as described for calibration except that we dispensed 1 ml of 0.03 N hydrogen peroxide in 0.1 M so-dium phosphate buffer, pH 7.0, into one arm of the RT and 1 ml of hemolyzed blood solution in distilled water (containing 0.4 mg of Hb) into the other. h was recorded at the
times (t) of 15, 23 and 30 s, and later
cor-rected for standard conditions of tempera-ture and pressure.
Since catalase kinetics follows a para-bolic equation(4), the initial velocity k can be determined by the following equation:
or, in another form,
where hc. Fm equals mg of hydrogen
perox-ide decomposed during time t.
By performing three determinations at 15, 23 and 30 s, k can be calculated as
follows:
This is possible because k is constant and the
coordinate points:
are part of the same straight line. Then,
where k represents the amount (mg) of
hy-drogen peroxide decomposed in one second per 0.4 mg of Hb. Catalase activity was reported as the amount (mg) of hydrogen peroxide decomposed in one second per gram of hemoglobin (KHb). Since 0.4 mg of
Hb was dispensed into RT, KHb= 2,500 k, or
Parabo lic be havio r o f the re actio
The parameter was measured by hydro-gen peroxide decomposition at the times of 10, 15, 20, 25, 30, 35 and 40 s. The theoreti-cal curve obtained was drawn after deter-mining the value of k by the calculations shown above.
Re latio nship be twe e n catalase activity and
he mo glo bin
Catalase activity was measured in four different dilutions of blood, namely 0.08, 0.12, 0.16 and 0.20 mgHb/ml, and the corre-lation of enzyme activity with Hb concentra-tion was established.
Figure 1 - Device for the measurement of oxygen evolution. The reaction test tube (RT) is held by a support (ST), connected to the stirrer motor (M ) through a steel bar (B). RT is connected to the manometer (M A) by a rubber tubing (T). The bulb of the manometer is provided w ith a valve (V) to equilibrate the system w ith the atmospheric pressure before mixing the reagents. RT total capacity is 12.0 ml.
M
B RT
RT
ST V
MA 55 cm
+/-3.0 cm
Ø +/-1.6 cm Ø
+/-1.5 cm
+/-1.5 cm
= +/-165o
T
+/-3.0 c m
hc.Fm=k t
t c h k= .Fm,
∑ ∑ ⋅ =
t Fm c h k
Fm h 30 Fm h 23 Fm h
15, c1⋅ ; , c2⋅ and , c3⋅
Fm, h k
k hc =∑hc = ⋅ c⋅
+ +
∑
= or 0.707 ∑
14 . 14 30 23 15
Fm. h
K Fm, h K
c
Hb c
Hb
⋅ ∑
⋅ = ⋅
∑ ⋅ ⋅
=2,500 0.707 or 176.8
Enzyme de naturatio n in he mo lyze d blo o d
Two blood samples were analyzed at l-h intervals for 7 h to determine the loss of enzymatic activity by denaturation in dis-tilled water at room temperature (range 20 to 24oC). The hemoglobin concentration used
(0.4 mg/dl) was the same as indicated in the description of the technique.
Equivale nce o f units
We established the equivalence between the relative activity scale reported by Maral et al. (21) and our data, taking the human value as 100% in both series.
Re sults and D iscussio n
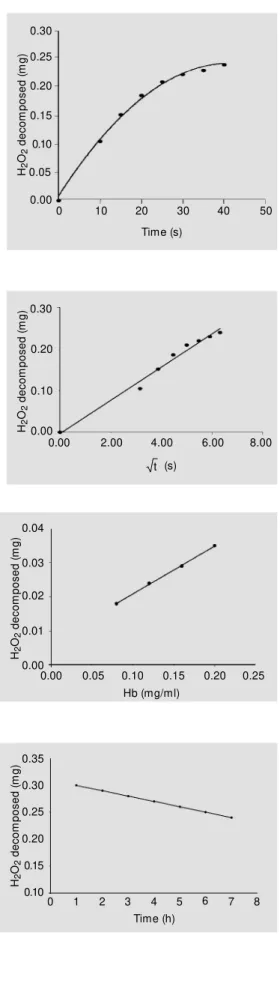
The relationship between the amount of hydrogen peroxide decomposed and the time in seconds, obtained experimentally, is shown in Figure 2. The same figure also shows a theoretical curve calculated from the exper-imental data using the equation for a pa-rabola. Figure 3 shows that the experimental data for the amount (mg) of hydrogen perox-ide decomposed are related to the square root of the corresponding time in seconds .The correlation between the enzymatic decomposition of hydrogen peroxide and the amount (mg) of hemoglobin present in the system is shown in Figure 4. The loss of enzyme activity as a function of time at room temperature was calculated to be 5%/h (Fig-ure 5). Fig(Fig-ure 6 shows the equivalence be-tween our data for different species and those of Maral et al. (21). The repetitions executed in all samples throughout the experiment showed a negligible deviation (2.0 ± 1.5%). The value obtained for catalase activity (KHb) for 28 samples of hemolyzed human
blood was 94.4 ± 6.17 mg H2O2 s-1 g Hb-1.
In this study we did not consider the sex of blood donors because this parameter does not apparently influence catalase activity (8,24,27-30). However, two conflicting
re-H2 O2 d e c o m p o s e d ( m g ) 0.30 0.25 0.20 0.15 0.10 0.05 0.00
0 10 20 30 40 50
Time (s) H2 O2 d e c o m p o s e d ( m g ) 0.30 0.20 0.10 0.00
0.00 2.00 4.00 6.00 8.00
t (s)
H2 O2 d e c o m p o s e d ( m g )0.04 0.03 0.02 0.00
0.00 0.05 0.10 0.15 0.20
Hb (mg/ml) 0.01 0.25 H2 O2 d e c o m p o s e d ( m g )0.35 0.30 0.25 0.15
0 2 3 5 6
Time (h) 0.20 8 7 4 1 0.10 Figure 2 - Experimental curve
show ing the amount (mg) of hy-drogen peroxide decomposed by catalase as a function of time in seconds. Hemoglobin concen-tration w as 0.4 mg in 1.0 ml. The solid line indicates theoretical values for a parabola.
Figure 3 - Correlation betw een the amount (mg) of hydrogen peroxide decomposed by cata-lase and the square root of time, in seconds. The straight line ob-tained indicates the parabolic be-havior of the data in Figure 2. The equation of the straight line is y = 0.0399x - 0.0029. R2 =
0.9838.
Figure 4 - Correlation betw een the amount (mg) of hydrogen peroxide decomposed by cata-lase as a function of mg hemo-globin. The equat ion of t he straight line is y = 0.1726x + 0.0019. R2 = 0.9818.
Figure 5 - Decrease in catalase activity as a function of time. Blood w as diluted in distilled w at er at room t em perat ure (range 20 to 24oC). The equation
of the straight line is y = -0.01x + 0.31. R2 = 1.0. The inactivation
rate w as 5% /h.
ports by Goth (17) and by Bolzan et al. (31) have described higher catalase activity for males and females, respectively.
The two time curves obtained (Figure 2), one with the experimental data and the other calculated by equation,
have a distribution of the parabolic type and are almost coincident during the time inter-val between 15 and 35 s. This parabolic curve is confirmed in Figure 3, where a straight line was obtained when the amount of hydrogen peroxide decomposed was plot-ted as a function of the square root of time, which is a characteristic of the reaction cata-lyzed by catalase(4).
The results obtained with the four blood dilutions (Figure 4) show that there is a rela-tionship between catalase activity and hemo-globin concentrations which agrees with Kirk (4), Takahara et al.(7) and Miller (23).
Our data indicate that normal catalase levels (the average ± two standard devia-tions) is between 82.06 and 106.74, which is
M
a
ra
l
e
t
a
l.
(
%
u
n
it
s
)
140.0
120.0
80.0
40.0
0.0
Present study (% KHb) 60.0
150.0 100.0
50.0 20.0
100.0
0.0
Rabbit M an
Horse
Sheep Chicken
Figure 6 - Relative erythrocyte catalase activity for different species. The figure show s the similarity betw een the data of M aral et al. (21) and those of the present study. In each series the value for human erythrocytes w as taken as 100% . The equa-tion of the straight line is y = 0.9622x + 4.9034. R2 = 0.9945.
much better than the average ± three stan-dard deviations suggested by others (28,29).
Ackno wle dgm e nts
We thank Mirna Barison from the Blood Bank of ISCMPA for scientific assistance and Alessandro DÁvila da Silva, Mila Pontremoli and Teresinha Stein for techni-cal support. We also thank Prof. Eliete B. Hauser for meaningful mathematical discus-sions.
Re fe re nce s
1. M orgulis S (1921). A study of the catalase reaction. Journal of Biological Chemistry, 47: 341-375.
2. M aisin J & Pourbaix Y (1938). Influence des injections de peroxyde de diformaldé-hyde sur l’activité de la catalase du sang. Comptes Rendus de la Société Belge de Biologie, 129: 46-49.
3. Greenfield RE & Price VE (1954). Liver catalase I - a manometric determination of catalase activity. Journal of Biological Chemistry, 209: 355-361.
4. Kirk JE (1963). A rapid procedure for cata-lase determination in blood and tissue samples w ith the Van Slyke manometric apparatus. Clinical Chemistry, 9: 763-775. 5. Rorth M & Jensen PK (1967). Determina-tion of catalase activity by means of the Clark oxygen electrode. Biochimica et Bi-ophysica Acta, 139: 171-173.
6. Penasse L (1974). Les Enzymes: Cinéti-que et M écanisme d’Action. M asson et Cie. Eds., Paris.
7. Takahara S, Hamilton HB, Neel JV, Kobara TY, Ogura Y & Nishimura ET (1960). Hy-pocatalasemia: A new genetic carrier state. Journal of Clinical Investigation, 39: 610-619.
8. Chance B & M aehly AC (1961). Biochem-ist’s Handbook. E & FN Spon Ltd., Lon-don, 383-384.
9. Dixon M & Webb EC (1964). Enzymes. Academic Press, New York, 311-314. 10. Aebi H (1974). Catalase. In: Bergmeyer
HU (Editor), M ethods of Enzymatic Analy-sis. Vol. 2. Academic Press, New York, 673-684.
11. Setlow AB (1951). The inactivation of cata-lase by deuterons and heat. Archives of Biochemistry and Biophysics, 34: 396-408.
12. Babenko GA & Goinatski M N (1976). De-termination of catalase activity in erythro-cytes and serum by the iodometric meth-od. Laboratornoe Delo,3: 157-158. 13. Richardson M , Huddleson IF & Bethea R
(1953). Study of catalase in erythrocytes and bacteria. I. Procedure for the determi-nation of the catalase activity of erythro-cytes. Archives of Biochemistry and Bio-physics,42: 114-123.
14. Kraitsev SI (1967). M ethod for the deter-mination of the catalase activity in intact erythrocytes and hemolysed blood. Labo-ratornoe Delo,9: 562-563.
15. Rigo A & Rotilio C (1977). Simultaneous determination of superoxide dismutase and catalase in biological materials by po-larography. Analytical Biochemistry, 21: 157-166.
16. Van Lente F & Pepoy M (1990). Coupled-enzyme determination of catalase activity in erythrocytes. Clinical Chemistry, 36: 339-343.
17. Goth L (1991). A simple method for deter-mination of serum catalase activity and revision of reference range. Clinica Chi-mica Acta,196: 143-151.
18. Yasmineh WG, Chung M Y & Caspers JI
,
(1992). Determination of serum catalase activity on a centrifugal analyzer by an NADP/NADPH coupled enzyme reaction system. Clinical Biochemistry,25: 21-27. 19. Sinha AK (1972). Colorimetric assay of catalase. Analytical Biochemistry,47: 389-394.
20. Ou P & Wolff SP (1996). A discontinuous method for catalase determination at ‘near physiological’ concentrations of H2O2 and its application to the study of
H2O2 fluxes w ithin cells. Journal of
Bio-chemical and Biophysical M ethods, 31: 59-67.
21. M aral J, Puget K & M ichelson AM (1977). Comparative study of superoxide dismu-tase, catalase and glutathione peroxidase levels in erythrocytes of different animals. Biochemical and Biophysical Research Communications,77: 1525-1535. 22. M ueller S, Riedel HD & Stremmel W
(1997). Determination of catalase activity at physiological hydrogen peroxide con-centrations. Analytical Biochemistry,245: 55-60.
23. M iller H (1958). The relationship betw een cat alase and haem oglobin in hum an blood. Biochemistry Journal, 68: 275-282. 24. Tudhope GR (1967). Red cell catalase in health and in disease, w ith reference to the enzyme activity in anaemia. Clinical Science, 33: 165-182.
25. Bonnichsen RK, Chance B & Theorell H (1947). Catalase activity. Acta Chemica Scandinavica, 1: 685-709.
26. M eldrum NU & Roughton FJW (1934). Carbonic anhydrase. Its preparation and properties. Journal of Physiology, 80: 113-141.
27. Beutler E & Blaisdell RK (1958). Iron en-zymes in iron deficiency. II. Catalase in human erythrocytes. Journal of Clinical
Investigation,37: 833-835.
28. Paul KG & Engstedt L (1958). Normal and abnormal blood catalase activity in adults. Scandinavian Journal of Clinical and Labo-ratory Investigation, 10: 26-33.
29. Engstedt L & Paul KG (1960). Inter-indi-vidual variations in blood catalase activity. Scandinavian Journal of Clinical and Labo-ratory Investigation, 12: 502-503. 30. Guemouri L, Artur Y, Herbeth B, Jeandel
C, Cuny G & Siest G (1991). Biological variability of superoxide dismutase, gluta-thione peroxidase, and catalase in blood. Clinical Chemistry,37: 1932-1937. 31. Bolzan AD, Bianchi M S & Bianchi NO