Clustering of ingredients with amino acid composition similar
to the nutritional requirement of Nile tilapia
Álvaro José de Almeida Bicudo
1*; Luis Fernando Batista Pinto
2; José Eurico Possebon
Cyrino
31
UFRPE – Unidade Acadêmica de Garanhuns – Av. Bom Pastor, s/n – 55296-901 – Garanhuns, PE – Brasil. 2
UFBA/EMV – Depto. de Produção Animal – Av. Adhemar de Barros, 500 – 40170-110 – Salvador, BA – Brasil.
3
USP/ESALQ – Depto. de Zootecnia, Setor de Piscicultura, C.P. 09 – 13418-900 – Piracicaba , SP – Brasil. *Corresponding author <alvaro.bicudo@uag.ufrpe.br>
ABSTRACT:The search for balanced diets, which may elicit improved growth of fish, requires appropriate selection of available protein sources.This study aims at clustering feedstuffs according to amino acid profile, determining which ones show essential amino acids (EAA) profiles closer to the ideal dietary amino acids requirements of Nile tilapia (Oreochromis niloticus), and studying the relationship among amino acids feedstuffs groups. Tabled data on EAA more cystine and tyrosine, in relation to lysine contents, of 40 feedstuffs ordinarily used to formulate fish diets were studied. Feedstuffs were grouped according to amino acids profile by cluster analysis of Euclidean distances. The principal components analysis was used to determine the relationship among amino acids in each feedstuff group. Three groups of ingredients were parted and two ingredients, low tannin sorghum and corn gluten meal 60%, did not go with any group. Dietary amino acids requirements of Nile tilapia were similar to the amino acid profile of 22 feedstuffs.The principal component analysis explained with three principal components more than 75% of total variance of amino acids in three feedstuff groups. Therefore, until additional, detailed information on amino acids availability of different ingredients is consolidated, total amino acids profiles will continue to be important information to select and use conventional or surrogate ingredients for formulating and processing feeds for tilapia.
Key words: feedstuff, fish, multivariate analysis, nutrition, protein
Agrupamento de ingredientes com composição de aminoácidos similar
à exigência nutricional da tilápia do Nilo
RESUMO:A busca de uma ração balanceada, que proporcione maior crescimento aos peixes, passa pela escolha adequada das fontes protéicas disponíveis.Este estudo teve por objetivo agrupar alimentos de acordo com o perfil de aminoácidos essenciais, determinando quais mostram perfis mais próximos do requerimento da tilápia do Nilo (Oreochromis niloticus), e estudar a relação entre os aminoácidos dentro dos agrupamentos obtidos. Foram utilizadas composições de aminoácidos em relação ao conteúdo de lisina, de 40 alimentos comumente utilizados como ingredientes na formulação de dietas para peixes. Os ingredientes foram agrupados de acordo com o perfil de aminoácidos utilizando a análise de agrupamento por meio da distância Euclidiana, enquanto a análise de componentes principais foi utilizada para determinar a relação entre os aminoácidos em cada grupo obtido. Três grupos de ingredientes foram formados e apenas dois ingredientes, sorgo baixo tanino e farelo de glúten de milho 60%, não entraram em nenhum dos três grupos. A exigência de aminoácidos da tilápia do Nilo foi semelhante ao perfil de aminoácidos encontrado em 22 alimentos. A análise de componentes principais conseguiu resumir e explicar 75% da variância total com apenas três componentes principais. Até que maiores informações sobre a disponibilidade de aminoácidos de diferentes ingredientes sejam obtidas, o perfil total de aminoácidos continuará a ser uma informação valiosa na escolha dos ingredientes a serem utilizados na formulação e processamento de alimentos para tilápia do Nilo.
Palavras-chave: alimentos, análise multivariada, nutrição, peixes, proteína
Introduction
Similarly to any other animal, Nile tilapia,
Oreochromis niloticus, have no dietary requirement for protein, but actually require a well-balanced blend of essential (EAA) and nonessential amino acids (NEAA) in the diet (Santiago and Lovell, 1988; Furuya et al., 2004). When feed formulation is based on the ideal pro-tein concept, smaller amounts of propro-tein are used to
Cluster analysis is a multivariate procedure that seeks organizing information about variables so that rela-tively homogeneous groups or “clusters” can be formed (Johnson and Wichern, 1998). This analysis can group feedstuffs with amino acids contents which near dietary amino acids requirements of Nile tilapia. Additionally, principal component analysis can help to know the prop-erties of each feedstuff cluster, because within each prin-cipal component, the original traits can be directly or indirectly correlated.
The present study aimed grouping feedstuffs accord-ing to amino acid profile and determinaccord-ing which accord- ingre-dients are closer to Nile tilapia’s AA profile, i.e. ideal protein, studying the relationship among amino acids in each of ingredients’ group, as already done by Faria Filho et al. (2005) for the poultry industry, and finally, following the path set by Cravener and Rousch (2001), who used genetic algorithm to calibrate artificial neu-ral networks to predict amino acid profiles in feed in-gredients, demonstrating to fish nutritionists of both pri-vate and academic sector the use of an statistical tool to speed up the selection process of regionally available feedstuffs for fish feed formulation.
Material and Methods
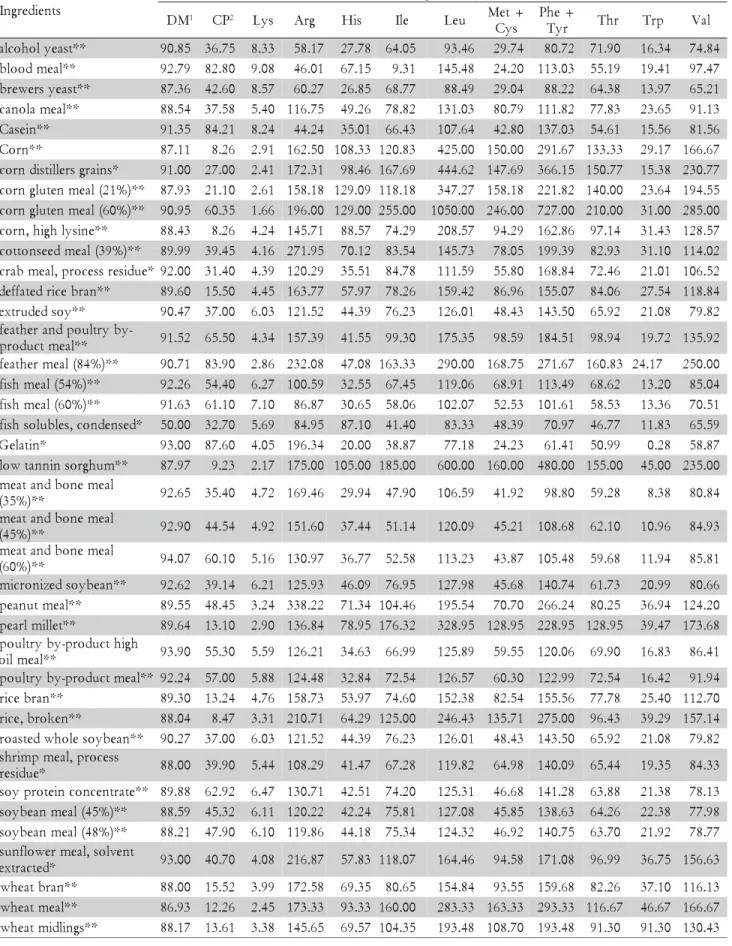
Data on dry matter (DM), crude protein (CP) and total amino acid (AA) contents of selected feedstuff were obtained from NRC (1993) and Rostagno et al. (2005). Amino acid profiles (AAP) of feedstuffs were expressed as percent protein of each amino acid (dry matter basis) in relation to lysine (Table 1), following the formula: AAP = 100 × EAA/[Lys], where EAA is the concentra-tion of each amino acid, including cystine and tyrosine, in tilapia muscle tissue.
A vector representing the ideal AA profile for the nutrition of juvenile Nile tilapia was inserted in the data matrix, presenting the following composition (% lysine): methionine + cystine (Met + Cys) 62.89% , arginine (Arg) 82.03%, leucine (Leu) 66.21%, histidine (His) 33.59%, phenylalanine + tyrosine (Phe + Tyr) 108.20%, tryptophan (Trp) 19.53%, threonine (Thr) 73.24%, isoleu-cine (Ile) 60.74%, and valine (Val) 54.69% (Santiago and Lovell, 1988). Lysine (Lys) was not added for it is the reference EAA (100%).
For cluster analysis, the measure used to form the groups was the Euclidian distance, i.e. a symmetric tance, since a property of Euclidean space is that the dis-tance from object A to B is the same as the distance from
B to A. The Euclidean distance between points P = (p1,
p2, …, pn) and Q = (q1, q2, …, qn), in Euclidean n-space, is de-fined as:
ED p q p q pn qn pi qi
i n
= − + − + + − = −
=
∑
( 1 1) ( ) ... ( ) ( )
2
2 2
2 2 2
1
A hierarchical agglomerative algorithm was used to find successive clusters using previously established clus-ters. The agglomerative process begins with each
ele-ment as a separate cluster and merges them into succes-sively larger clusters. The traditional representation of this hierarchy is a tree called dendogram, with individual elements at one end and a single cluster containing ev-ery element at the other.
The principal components analysis transform an original group of n standardized variable xi1, xi2 ,..., xin in a new group yi1, yi2,....,yin, that are linear functions of the xi’s, already independent and with important properties (Johnson and Wichern, 1998).
Assuming that: yi1 = a11xi1 + a21xi2 + … + aj1xij yi2 = a12xi1 + a22xi2 + … + aj2xij
. . .
yin = a1nxi1 + a2nxi2 + … + ajnxij
where: yin is the score value of nth principal component
at ith feedstuff; ajn is the eigenvectors value for the jth amino acid at nth principal component; and
ij
x
is the value for jth amino acid at ith feedstuff, thus, if yi1 = a11xi1
+ a21xi2 + … + aj1xij is the first principal component for
ith feedstuff and y
i2 = a12xi1 + a22xi2 + … + aj2xij is the
sec-ond principal component for the ith feedstuff, then the
more important properties are: (i) aj1 aj 2
2 2
=
∑
∑
anda aj1 j2=0
∑
(principal components are independents), and (ii) among the principal components, Yi1 have the larg-est variance; Yi2 the second largest, and so on.The criterion of minimum variance equal to 75% was used for selection the number of principal components. The eigenvalues and eigenvectors were estimates of the matrix of correlation according to Johnson and Wichern (1998).
Results and Discussion
*Data from NRC (1993). ** Data from Rostagno et al. (2005). 1Dry matter. 2Crude protein.
Table 1 – Feedstuff composition.
s t n e i d e r g n I ) % ( n o i t i s o p m o C M
D 1 CP2 Lys Arg His Ile Leu Met+
s y C + e h P r y
T Thr Trp Val
* * t s a e y l o h o c l
a 90.85 36.75 8.33 58.17 27.78 64.05 93.46 29.74 80.72 71.90 16.34 74.84
* * l a e m d o o l
b 92.79 82.80 9.08 46.01 67.15 9.31 145.48 24.20 113.03 55.19 19.41 97.47
* * t s a e y s r e w e r
b 87.36 42.60 8.57 60.27 26.85 68.77 88.49 29.04 88.22 64.38 13.97 65.21
* * l a e m a l o n a
c 88.54 37.58 5.40 116.75 49.26 78.82 131.03 80.79 111.82 77.83 23.65 91.13
* * n i e s a
C 91.35 84.21 8.24 44.24 35.01 66.43 107.64 42.80 137.03 54.61 15.56 81.56
* * n r o
C 87.11 8.26 2.91 162.50 108.33 120.83 425.00 150.00 291.67 133.33 29.17 166.67
* s n i a r g s r e l l i t s i d n r o
c 91.00 27.00 2.41 172.31 98.46 167.69 444.62 147.69 366.15 150.77 15.38 230.77
* * ) % 1 2 ( l a e m n e t u l g n r o
c 87.93 21.10 2.61 158.18 129.09 118.18 347.27 158.18 221.82 140.00 23.64 194.55
* * ) % 0 6 ( l a e m n e t u l g n r o
c 90.95 60.35 1.66 196.00 129.00 255.00 1050.00 246.00 727.00 210.00 31.00 285.00
* * e n i s y l h g i h , n r o
c 88.43 8.26 4.24 145.71 88.57 74.29 208.57 94.29 162.86 97.14 31.43 128.57
* * ) % 9 3 ( l a e m d e e s n o t t o
c 89.99 39.45 4.16 271.95 70.12 83.54 145.73 78.05 199.39 82.93 31.10 114.02
* e u d i s e r s s e c o r p ,l a e m b a r
c 92.00 31.40 4.39 120.29 35.51 84.78 111.59 55.80 168.84 72.46 21.01 106.52
* * n a r b e c i r d e t a f f e
d 89.60 15.50 4.45 163.77 57.97 78.26 159.42 86.96 155.07 84.06 27.54 118.84
* * y o s d e d u r t x
e 90.47 37.00 6.03 121.52 44.39 76.23 126.01 48.43 143.50 65.92 21.08 79.82
-y b y r t l u o p d n a r e h t a e f * * l a e m t c u d o r
p 91.52 65.50 4.34 157.39 41.55 99.30 175.35 98.59 184.51 98.94 19.72 135.92
* * ) % 4 8 ( l a e m r e h t a e
f 90.71 83.90 2.86 232.08 47.08 163.33 290.00 168.75 271.67 160.83 24.17 250.00
* * ) % 4 5 ( l a e m h s i
f 92.26 54.40 6.27 100.59 32.55 67.45 119.06 68.91 113.49 68.62 13.20 85.04
* * ) % 0 6 ( l a e m h s i
f 91.63 61.10 7.10 86.87 30.65 58.06 102.07 52.53 101.61 58.53 13.36 70.51
* d e s n e d n o c , s e l b u l o s h s i
f 50.00 32.70 5.69 84.95 87.10 41.40 83.33 48.39 70.97 46.77 11.83 65.59
* n i t a l e
G 93.00 87.60 4.05 196.34 20.00 38.87 77.18 24.23 61.41 50.99 0.28 58.87
* * m u h g r o s n i n n a t w o
l 87.97 9.23 2.17 175.00 105.00 185.00 600.00 160.00 480.00 155.00 45.00 235.00
l a e m e n o b d n a t a e m * * ) % 5 3
( 92.65 35.40 4.72 169.46 29.94 47.90 106.59 41.92 98.80 59.28 8.38 80.84
l a e m e n o b d n a t a e m * * ) % 5 4
( 92.90 44.54 4.92 151.60 37.44 51.14 120.09 45.21 108.68 62.10 10.96 84.93
l a e m e n o b d n a t a e m * * ) % 0 6
( 94.07 60.10 5.16 130.97 36.77 52.58 113.23 43.87 105.48 59.68 11.94 85.81
* * n a e b y o s d e z i n o r c i
m 92.62 39.14 6.21 125.93 46.09 76.95 127.98 45.68 140.74 61.73 20.99 80.66
* * l a e m t u n a e
p 89.55 48.45 3.24 338.22 71.34 104.46 195.54 70.70 266.24 80.25 36.94 124.20
* * t e l l i m l r a e
p 89.64 13.10 2.90 136.84 78.95 176.32 328.95 128.95 228.95 128.95 39.47 173.68
h g i h t c u d o r p -y b y r t l u o p * * l a e m l i
o 93.90 55.30 5.59 126.21 34.63 66.99 125.89 59.55 120.06 69.90 16.83 86.41
* * l a e m t c u d o r p -y b y r t l u o
p 92.24 57.00 5.88 124.48 32.84 72.54 126.57 60.30 122.99 72.54 16.42 91.94
* * n a r b e c i
r 89.30 13.24 4.76 158.73 53.97 74.60 152.38 82.54 155.56 77.78 25.40 112.70
* * n e k o r b , e c i
r 88.04 8.47 3.31 210.71 64.29 125.00 246.43 135.71 275.00 96.43 39.29 157.14
* * n a e b y o s e l o h w d e t s a o
r 90.27 37.00 6.03 121.52 44.39 76.23 126.01 48.43 143.50 65.92 21.08 79.82
s s e c o r p ,l a e m p m i r h s * e u d i s e
r 88.00 39.90 5.44 108.29 41.47 67.28 119.82 64.98 140.09 65.44 19.35 84.33
* * e t a r t n e c n o c n i e t o r p y o
s 89.88 62.92 6.47 130.71 42.51 74.20 125.31 46.68 141.28 63.88 21.38 78.13
* * ) % 5 4 ( l a e m n a e b y o
s 88.59 45.32 6.11 120.22 42.24 75.81 127.08 45.85 138.63 64.26 22.38 77.98
* * ) % 8 4 ( l a e m n a e b y o
s 88.21 47.90 6.10 119.86 44.18 75.34 124.32 46.92 140.75 63.70 21.92 78.77
t n e v l o s ,l a e m r e w o l f n u s * d e t c a r t x
e 93.00 40.70 4.08 216.87 57.83 118.07 164.46 94.58 171.08 96.99 36.75 156.63
* * n a r b t a e h
w 88.00 15.52 3.99 172.58 69.35 80.65 154.84 93.55 159.68 82.26 37.10 116.13
* * l a e m t a e h
w 86.93 12.26 2.45 173.33 93.33 160.00 283.33 163.33 293.33 116.67 46.67 166.67
* * s g n i l d i m t a e h
corn distillers grains, corn, corn gluten meal 21% CP, pearl millet, feather meal 84%, broken rice, and wheat meal.
The dendogram was obtained using multitrait infor-mation of the nine essential amino acids. Thus, results are more reliable than single information to evaluate which feedstuffs hold higher similarity with Nile tila-pia EAA profile, so nearing the species dietary require-ment. Dietary amino acids requirements of Nile tilapia were similar to amino acid profiles of 22 of the analyzed feedstuff (G-1); corn gluten meal 60% was the ingredi-ent holding the lowest similarity.
All G-1 feedstuff can be potentially used to formu-late feeds targeting tilapia’s ideal protein, that is, ideal amino acids profile. Feedstuff with amino acids pro-file closer to that of Nile tilapia’s dietary requirements were gelatin and meat and bone meals (35, 45 and 60% of crude protein, respectively) (Figure 1). This confirms observations of Pezzato et al. (2002), who reported that meat and bone meals are protein sources of higher bio-logical value (73.2%) than that of fish meal for Nile ti-lapia, and can replace up to 100% of fish meal in diets for the species (El-Sayed, 1998). As a matter of fact, be-cause of the high quality and availability of their nu-trients for different fish species (Hardy and Barrows, 2002), Nile tilapia included (Santiago and Lovell, 1988), gelatin and casein are actually known as standard pro-tein sources for purified and semi-purified diets (NRC, 1993).
Regarding plant protein sources, canola meal was the ingredient whose amino acid profile was closer to tila-pia dietary requirements (Figure 1). Actually, dose-re-sponse studies have demonstrated that canola meal is an adequate protein source for aquafeeds (Furuya et al., 2001 b), and do not affect growth performance when in-cluded from 24% (Gaiotto et al., 2004) to 51% (Souza et al., 2004) on diets of Nile tilapia at different phases of the growth cycle. Canola meal can replace up to 48% of dietary soybean meal protein in feeds without affecting growth performance of fingerling tilapia (Soares et al., 2001). Soybean meal is the chief plant protein source for aquafeeds (Watanabe, 2002). According to cluster analy-sis, other soybean by-products have amino acids profiles more similar to fish ideal protein and can also can be included in aquafeeds, provided restrictions regarding the presence of anti-nutritional factors in some these products are observed (Francis et al., 2001).
For analyzing each group resulting from cluster analysis it is proposed the use of principal component analysis (Table 2). This analysis allows not only sim-plify the variance in few canonical variables using eigen-value information, but also checks the relation between different AA using eigenvector coefficients.
For all groups defined by the cluster analysis, the principal component analysis abridged the information of nine amino acids on three principal components that together can explain more than 75% of total variance. Ideally, the total variance should be reduced to two
PC – Principal components. Group 1 - gelatin, meat and bone meals 35, 45 and 60% crude protein (CP), condensed fish solubles, blood meal, fish meals 54 and 60% CP, alcohol yeast, casein, poultry by-product meal, poultry by-product high oil meal, shrimp condensed process residue meal, canola meal, micronized soybean, soy protein concentrate, extruded soy, roasted whole soybean, soybean meals 45 and 48% CP and crab meal process residue. Group 2 - feather and poultry by product meal, rice bran, deffated rice bran, wheat bran, high lysine corn, wheat middlings, cottonseed meal 39% CP, sunflower meal solvent extracted, and peanut meal. Group 3 - corn distillers grains, corn, corn gluten meal 21% CP, pearl millet, feather meal 84%, broken rice, and wheat meal.
1 p u o r
G Group2 Group3
e u l a v n e g i
E Cumulative Eigenvalue Cumulative Eigenvalue Cumulative
% % %
1 C
P 4.14 45.96 3.24 36.01 3.44 38.27
2 C
P 1.79 65.85 2.56 64.49 2.44 65.39
3 C
P 1.01 77.06 1.69 83.24 1.34 80.31
Table 2 –Principal components with eigenvalues larger than one.
cipal components which would explain more than 80% of the total variance, because it should be easier explain-ing the results in a bi-dimensional dimension; however, abridging the variance for three principal components – i.e. the adjustment of analysis – is considered adequate.
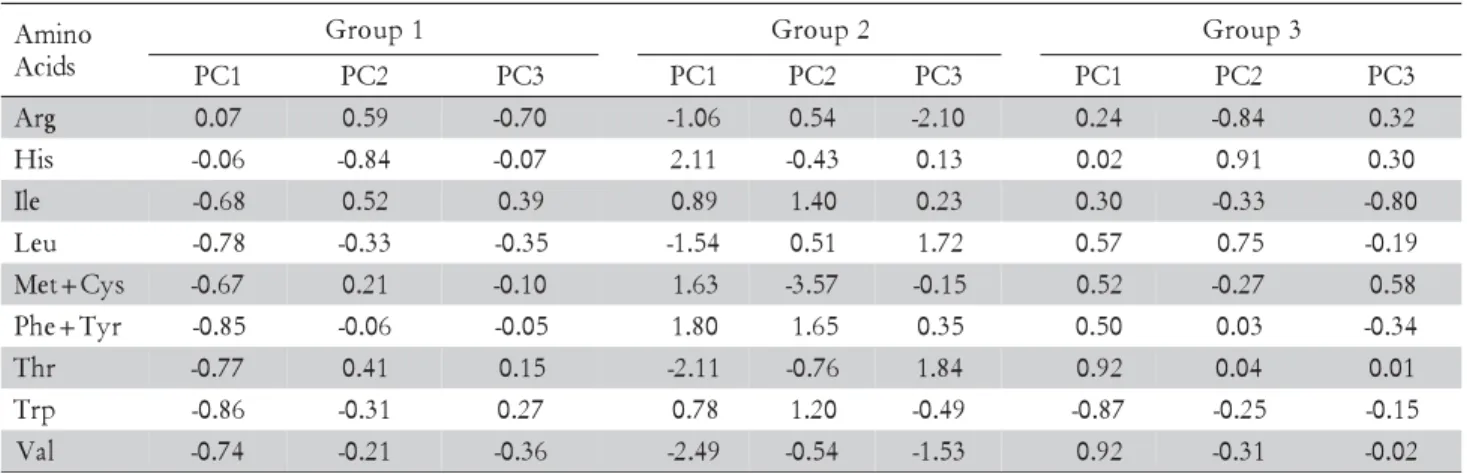
Eigenvectors that can be used to build the equation for each principal component in each of groups are showed in Table 3. For instance, the first principal com-ponent in the G-1 can be represented by the following equation:
“PC1 = 0.07(Arg) - 0.06(His) – 0.68(Ile) – 0.78(Leu) – 0.67 (Met+Cys) – 0.85(Phe+Tyr) – 0.77(Thr) – 0.86(Trp) – 0.74(Val)”.
Each feedstuff has a PC1 value that depends on its amino acid contents and larger eigenvectors indicate higher importance of a given amino acid for the PC1 value. In addition, eigenvectors can also be used to ex-plain associations among the nine amino acids studied, given that within each principal component, amino
ac-ids with different eigenvectors signs are negatively cor-related; otherwise, they are directly correlated.
Regarding G-1, the first principal component (CP1) explain the variance of the amino acids Ile, Leu, Met+Cys, Phe+Tyr, Thr, Trp, and Val (Table 3), be-cause the eigenvectors for those traits had the largest val-ues; since all those amino acids present negative signals for the eigenvectors, they are directly associated. Only His and Arg did not have important eigenvectors for CP1 and their variances are explained by the compo-nents CP2 and CP3, respectively. Therefore, Arg and His can thus be either in excess or shortage in processed tilapia feeds, if either fish meal or surrogate protein sources, such as brewer’s yeast, gelatin, casein, alcohol yeast, etc. are used (Table 1). Dietary requirements of Arg and His of fish range on 4-5% and 1.5-2.5% of di-etary protein, respectively (Wilson, 2002). Arginine de-ficiencies result in reduced growth and nitrogen reten-tion (Tibaldi et al., 1994; Ruchimat et al., 1998). How-ever, as metabolization of glutamate can make up for
Table 3 – Eigenvectors of principal components with eigenvalues larger than one.
PC – Principal components. Group 1 - gelatin, meat and bone meals 35, 45 and 60% crude protein (CP), condensed fish solubles, blood meal, fish meals 54 and 60% CP, alcohol yeast, casein, poultry by-product meal, poultry by-product high oil meal, shrimp condensed process residue meal, canola meal, micronized soybean, soy protein concentrate, extruded soy, roasted whole soybean, soybean meals 45 and 48% CP and crab meal process residue. Group 2 - feather and poultry by product meal, rice bran, deffated rice bran, wheat bran, high lysine corn, wheat middlings, cottonseed meal 39% CP, sunflower meal solvent extracted, and peanut meal. Group 3 - corn distillers grains, corn, corn gluten meal 21% CP, pearl millet, feather meal 84%, broken rice, and wheat meal.
o n i m A
s d i c A
1 p u o r
G Group2 Group3
1 C
P PC2 PC3 PC1 PC2 PC3 PC1 PC2 PC3
g r
A 0.07 0.59 -0.70 -1.06 0.54 -2.10 0.24 -0.84 0.32 s
i
H -0.06 -0.84 -0.07 2.11 -0.43 0.13 0.02 0.91 0.30 e
l
I -0.68 0.52 0.39 0.89 1.40 0.23 0.30 -0.33 -0.80 u
e
L -0.78 -0.33 -0.35 -1.54 0.51 1.72 0.57 0.75 -0.19 s
y C + t e
M -0.67 0.21 -0.10 1.63 -3.57 -0.15 0.52 -0.27 0.58 r
y T + e h
P -0.85 -0.06 -0.05 1.80 1.65 0.35 0.50 0.03 -0.34 r
h
T -0.77 0.41 0.15 -2.11 -0.76 1.84 0.92 0.04 0.01 p
r
T -0.86 -0.31 0.27 0.78 1.20 -0.49 -0.87 -0.25 -0.15 l
a
circa 33% of fish Arg requirements (Buentello and Gatlin, 2000), using ingredients moderately deficient in Arg but with adequate levels of glutamic acid in aquafeeds, do not affect growth performance of fish.
Histidine is involved in metabolic functions such as production of histamines and osmoregulation; it also plays a role on the production of energy for use in other metabolic pathways during certain emergencies or stressful conditions (Abe and Ohmama, 1987). Dietary deficiency of His cause poor growth, low feed efficiency, cataract, increased mortality and incidence of lordosis (Breck et al., 2003); on the other hand, excess in dietary His decrease the growth rate and feed efficiency (Ravi and Devaraj, 1991; Murthy and Varghese, 1995; Ahmed and Khan, 2005).
With regard to feedstuffs of G-2, variance of some amino acids profiles and contents are not explained by only one principal component. For instance, Leu has eigenvectors with important values in CP1 and CP3. Such results reveal a complex relationship among the amino acids profile G-2 feedstuffs. However, the Euclidean dis-tance between G-1 and G-2 is smaller than between the G-1 and G-3 (Figure 1).
In G-3, eigenvectors are almost similar to G-1; how-ever, not only Leu, Met+Cys, Phe+Tyr, Thr, and Val have negative relationship with Trp, but also Ile do not present correlations with those amino acids of G-1. The CP2 explains the negative association between His and Arg, that is, within ingredients of G-3 the largest values of His correspond to lowest values of Arg. The CP3 ex-plains the variance of Ile, and only in this group Ile is not associated with other amino acid.
In conclusion, selection and use of feedstuffs in aquafeeds cannot be based only on price range; the qual-ity of the protein, i.e. amino acids profile and availabil-ity, will determine the efficiency of nitrogen deposition on carcass (Engin and Carter, 2005), and as a conse-quence, the economics of diets and production. To date, only a few feedstuffs were appraised in regard to avail-ability of their amino acids contents for tilapia (Fagbenro, 1998; Köprücü and Özdemir, 2005; Furuya et al., 2001 a; Henry-Silva et al., 2006; Guimarães et al., 2008 a, b). Cluster and principal component analysis showed to be an interesting tool to identify potential pro-tein sources for fish diets according to EAA require-ments. However, total amino acids profile will remain a key information to guide selection and use of feedstuffs in the production of processed tilapia feeds, because chemical composition of feedstuffs vary to a great ex-tent and that certainly influences the nutrients digestibil-ity.
Acknowledgements
To Fundação de Amparo à Pesquisa do Estado de São Paulo (FAPESP) for granting the Doctoral and the Post-Doctoral scholarship for the first and the second authors, respectively (protocols 05/51968-9 and 07/50736-2). The third author is a CNPq scholar.
References
Abe, H.; Ohmama, S. 1987. Effect of starvation and sea-water acclimation on the concentration of free L-histidine and related dipeptides in the muscle of eel, rainbow trout and Japanese dace. Comparative Biochemistry and Physiology 88: 507-511.
Ahmed, I.; Khan, M.A. 2005. Dietary histidine requirement of fingerling Indian major carp, Cirrhinus mrigala (Hamilton). Aquaculture Nutrition 11: 359-366.
Breck, O.; Bjerkas, E.; Campbell, P.; Arnesen, P.; Haldorsen, P.; Waagbo, R. 2003. Cataract preventative role of mammalian blood meal, histidine, iron and zinc in diets for Atlantic salmon (Salmo salar L.) of different strains. Aquaculture Nutrition 9: 341-350.
Buentello, J.A.; Gatlin III, D.M. 2000. The dietary arginine requirement of channel catfish (Ictalurus punctatus) is influenced by endogenous synthesis of arginine from glutamic acid. Aquaculture 188: 311-321.
Cravener, T.L.; Rousch, W.B. 2001. Prediction of amino acids profiles in feed ingredient: genetic algorithm calibration of artificial neural networks. Animal Feed Science and Technology 90: 131-141.
El-Sayed, A.F.M. 1998. Total replacement of fishmeal with animal protein sources in Nile tilapia Oreochromis niloticus (L.), feeds. Aquaculture Research 29: 275-280.
Engin, K.; Carter, C.G. 2005. Fish meal replacement by plant and animal by-products in diets for the Australian short-finned eel,
Anguilla australis australis (Richardson). Aquaculture Research 36: 445-454.
Fagbenro, O.A. 1998. Apparent digestibility of various legume seed meals in Nile tilapia diets. Aquaculture International 6: 83-87.
Faria Filho, D.E.; Torres, K.A.A.; Campos, D.M.B.; Vieira, B.S.; Urbano, T.; Rosa P.S.; Ferraudo, A.S. 2005. Ingredient classification according to the digestible amino acid profile: an exploratory analysis. Brazilian Journal of Poultry Science 7: 185-193.
Francis, G.; Makkar, H.P.S.; Becker, K. 2001. Antinutritional factors present in plant-derived alternate fish feed ingredients and their effects in fish. Aquaculture 199: 197-227.
Furuya, W.M.; Pezzato, L.E.; Barros, M.M.; Pezzato, A.C.; Furuya, V.R.B. 2004. Use of ideal protein concept for precision formulation of amino acid levels in fish-meal-free diets for juvenile Nile tilapia (Oreochromis niloticus L.). Aquaculture Research 35: 1110-1116.
Furuya, W.M.; Pezzato, L.E.; Pezzato, A.C.; Barros, M.M.; Miranda, E.C. 2001a. Digestibility coefficients and digestible amino acids values of some ingredients for Nile tilapia (Oreochromis niloticus). Revista Brasileira de Zootecnia 30: 1143-1149. (in Portuguese, with abstract in English).
Furuya, W.M.; Pezzato, L.E.; Miranda, E.C.; Furuya, V.R.B.; Barros, M.M.; Lanna, E.A.T. 2001b. Apparent nutrient and energy digestibility of canola meal for Nile tilapia (Oreochromis niloticus) Revista Brasileira de Zootecnia 30: 611-616. (in Portuguese, with abstract in English).
Gaiotto, J.R.; Macedo-Viegas, E.M.; Fernandes, T.R. 2004. Canola meal for juvenile Nile tilapia, Chitralada strain. Acta Scientiarum 26: 15-19. (in Portuguese, with abstract in English).
Guimarães, I.G.; Pezzato, L.E.; Barros, M.M. 2008a. Amino acid availability and protein digestibility of several protein sources for Nile tilapia, Oreochromis niloticus. Aquaculture Nutrition 14: 396-404.
Guimarães, I.G.; Pezzato, L.E.; Barros, M.M.; Tachibana, L. 2008b. Nutrient digestibility of cereal grain products and by-products in extruded diets for Nile tilapia. Journal of the World Aquaculture Society 39: 781-789.
Henry-Silva, G.G.; Camargo, A.F.M.; Pezzato, L.E. 2006. Apparent digestibility of aquatic macrophytes by Nile tilapia (Oreochromis niloticus) and water quality in relation nutrient concentrations. Revista Brasileira de Zootecnia 35: 641-647. (in Portuguese, with abstract in English).
Johnson, R.A.; Wichern, D.W. 1998. Applied Multivariate Statistical Analysis. 4ed. Prentice Hall, Upper Saddle River, NJ, USA.
Köprücü, K.; Özdemir, Y. 2005. Apparent digestibility of selected feed ingredients for Nile tilapia (Oreochromis niloticus). Aquaculture 250: 308-316.
Murthy, H.S.; Varghese, T.J. 1995. Arginine and histidine requirement of the Indian major carp, Labeo rohita. Aquaculture Nutrition 1: 235-239.
National Research Council [NRC]. 1993. Nutrient Requirements of Fish. National Academic Press, New York, NY, USA. Pezzato, L.E.; Miranda, E.C.; Barros, M.M.; Pinto, L.G.Q.; Furuya,
W.M.; Pezzato, A.C. 2002. Apparent digestibility of feedstuffs by Nile tilapia (Oreochromis niloticus). Revista Brasileira de Zootecnia 31: 1595-1604.
Ravi, J.; Devaraj, K.V. 1991. Quantitative essential amino acid requirements for growth of catla, Catla catla (Hamilton). Aquaculture 96: 281-291.
Rostagno, H.S.; Albino, L.F.T.; Donzele, J.L.; Gomes, P.C.; Oliveira, R.F.; Lopes, D.C.; Ferreira, A.S.; Barreto, S.L.T. 2005. Brazilian Table for Poultry and Pigs: Food Composition and Nutritional Requirements. Editora da UFV, Viçosa, MG, Brazil. (in Portuguese).
Ruchimat, T.; Masumoto, T.; Yoshiaki, I.; Shimeno, S. 1998. Quantitative arginine requirement of juvenile yellow tail (Seriola quinqueradiata). Fisheries Science 64: 348-349.
Santiago, C.B.; Lovell, R.T. 1988. Amino acids requirements for growth of Nile tilapia. The Journal of Nutrition 118: 1540-1546. Soares, C.M.; Hayashi, C.; Faria, A.C.E.A.; Furuya, W.M. 2001. Replacement of soybean meal protein by canola meal protein in diets for Nile tilapia (Oreochromis niloticus) in the growing phase. Revista Brasileira de Zootecnia 30: 1172-1177. (in Portuguese, with abstract in English).
Souza, S.R.; Hayashi, C.; Galdioli, E.M.; Soares, C.M.; Meurer, F. 2004. Different protein vegetal sources for the Nile tilapia (Oreochromis niloticus L.) during sexual reversion. Acta Scientiarum 26: 21-28.
Tibaldi, E.; Tulli, F.; Lanari, D. 1994. Arginine requirement and effect of different dietary arginine and lysine levels for fingerling sea bass (Dicentrarchus labrax). Aquaculture 127: 207-218. Watanabe, T. 2002. Strategies for further development of aquatic
feeds. Fisheries Science 68: 242-252.
Wilson, R.P. 2002. Amino acids and proteins. p. 143-179. In: Halver, J.E.; Hardy, R.W., eds. Fish Nutrition. 3ed. Academic Press, San Diego, CA, USA.