Density, proportion, and dendritic
coverage of retinal ganglion cells of
the common marmoset (
Callithrix
jacchus jacchus
)
Departamento de Fisiologia, Universidade Federal do Pará, Belém, PA, Brasil
F.L. Gomes, L.C.L. Silveira, C.A. Saito and E.S. Yamada
Abstract
We performed a quantitative analysis of M and P cell mosaics of the common-marmoset retina. Ganglion cells were labeled retrogradely from optic nerve deposits of Biocytin. The labeling was visualized using horseradish peroxidase (HRP) histochemistry and 3-3’diamino-benzidine as chromogen. M and P cells were morphologically similar to those found in Old- and New-World primates. Measurements were performed on well-stained cells from 4 retinas of different animals. We analyzed separate mosaics for inner and outer M and P cells at increasing distances from the fovea (2.5-9 mm of eccentricity) to estimate cell density, proportion, and dendritic coverage. M cell density decreased towards the retinal periphery in all quadrants. M cell density was higher in the nasal quadrant than in other retinal regions at similar eccentricities, reaching about 740 cells/mm2 at 2.5 mm of
temporal eccentricity, and representing 8-14% of all ganglion cells. P cell density increased from peripheral to more central regions, reach-ing about 5540 cells/mm2 at 2.5 mm of temporal eccentricity. P cells
represented a smaller proportion of all ganglion cells in the nasal quadrant than in other quadrants, and their numbers increased towards central retinal regions. The M cell coverage factor ranged from 5 to 12 and the P cell coverage factor ranged from 1 to 3 in the nasal quadrant and from 5 to 12 in the other quadrants. These results show that central and peripheral retinal regions differ in terms of cell class proportions and dendritic coverage, and their properties do not result from simply scaling down cell density. Therefore, differences in functional proper-ties between central and peripheral vision should take these distinct regional retinal characteristics into account.
Correspondence
L.C.L. Silveira
Departamento de Fisiologia Centro de Ciências Biológicas, UFPA 66075-110 Belém, PA
Brasil
E-mail: [email protected]
Research supported by FINEP/FADESP (No. 66.94.0034.00), PRONEX/FUJB (No. 76.97.1028.00), CNPq (No. 521640/96-2), and UFPa-PROPESP (No. 20062/93). F.L. Gomes and C.A. Saito were recipients of CAPES fellowships for graduate students. L.C.L. Silveira and E.S. Yamada are recipients of CNPq research fellowships.
Received May 27, 2004 Accepted February 21, 2005
Key words
•Magnocellular pathway •Parvocellular pathway •Visual system •Parallel processing •New World primates
Introduction
In order to understand how the image is sampled at the earliest stages of visual in-formation processing, it is important to know how different ganglion cell classes are dis-tributed throughout the retina. Although
cells, respectively), or considered how the P/ M density ratio varies throughout the retina. There are indications that the P/M density ratio remains fairly constant in the central retina, but changes towards the nasal periph-ery (4-7). In addition, we also know that in some species M cells represent 5 to 10% of all ganglion cells in the central retina, but that this proportion increases towards the nasal periphery (8,9).
Another important measurement for mor-phologic studies of the retina is the coverage factor, which was introduced by Perry and colleagues (4) to quantify how many cells of a single type cover each retinal location. There are controversial reports about how the M and P cell coverage factor is correlated with retinal eccentricity. Dacey and Petersen (5) and Dacey (6) suggested that the cover-age factor remains constant with eccentricity in the human and macaque retina because the increase of the dendritic field size is counterbalanced by a proportional decrease of cell density. On the other hand, Perry et al. (4) for the macaque monkey retina and Yamada et al. (7) for the capuchin monkey retina, showed that the M and P cell cover-age factor changes as a function of eccentric-ity.
In the present study, we estimated the dendritic field size, cell body size, cell den-sity, and coverage factor for marmoset M and P cells at several different retinal eccen-tricities. We also estimated the proportion of M and P cells among the total ganglion cell population, as well as the P/M density ratio at different retinal eccentricities. Some of the results were presented at the Association for Research in Vision and Ophthalmology (ARVO) Annual Meeting (10).
Material and Methods
Animals
Four adult male common marmosets
Callithrix jacchus jacchus were used. The
animals were bred in the Centro Nacional de Primatas (Ananindeua, State of Pará, Bra-zil). Animal care, anesthesia, and surgery were in agreement with the recommenda-tions of ARVO.
Surgery
Retinal ganglion cells were labeled ac-cording to the protocol of Picanço-Diniz et al. (11). The animal was anesthetized with ketamine hydrochloride (Ketalar, 10 mg/ml; Parke-Davis, Guarulhos, SP, Brazil) and xylazine (Rompun, 20 mg/ml; Bayer, São Paulo, SP, Brazil), im, and then positioned in a head holder. A craniotomy was performed and orbit bone was removed until the optic foramina became visible. Retrobulbar or-bital tissue was dissected to expose the optic nerve. A few pellets of biotinyl-lysine (Bio-cytin; Sigma, St. Louis, MO, USA) crystal-lized in a surgical sponge were placed in a cross-shaped cut made in the optic nerve at 1-3 mm behind the eyeball. The wound was covered with plastic and sealed with surgical glue. Electrocardiogram and body tempera-ture were monitored throughout the experi-ment. After surgery, the animal was allowed to recover from anesthesia, and was given antibiotics and analgesics until the time for perfusion.
Perfusion, retinal dissection, and histochemistry
After a 48-h survival time, the animal was euthanized with a lethal dose of barbitu-rate (Thionembutal; Abbott, São Paulo, SP, Brazil), 150 mg/kg, and perfused transaorti-cally with phosphate-buffered saline (PBS) followed by 4% paraformaldehyde (PFA). The eye was removed and the retina was carefully dissected in 4% PFA. The retina was immersed in 0.01% (w/v) collagenase solution (collagenase from Clostridium
histolyticum; Boehringer Mannheim,
used to break the collagen fibers in the inner limiting membrane and improve reagent pen-etration. The vitreous body was fully re-moved.
Labeled cells were visualized by a modi-fication of the protocol of Shu et al. (12). The retina was washed in PBS, immersed in ABC solution (Vectastain ABC Kit Standard; Vec-tor LaboraVec-tories, Burlingame, CA, USA) for 24-48 h, at 4ºC, under constant agitation, washed again in 0.1 M acetate buffer, pH 6.0, for 30 min, and then incubated in a 3-3’diaminobenzidine (DAB) solution (Sigma) containing nickel ammonium sulfate, am-monium chloride, and ß-D-glucose for 15 min. Finally, glucose oxidase (Sigma) was added to the solution, releasing H2O2 to
al-low DAB oxidization by horseradish peroxi-dase. The reaction yielded a dark blue pre-cipitate which allowed visualization of la-beled cells. Labeling was intensified by im-mersing the retina in a 0.1%-osmium tetrox-ide solution for 1 min.
Analysis
Microscopic analysis was performed us-ing a 100X-oil immersion objective. Well-labeled retinal ganglion cells located at dif-ferent distances from the fovea were se-lected for analysis. The quality of labeling was judged by how well the high-order den-dritic branches were developed. Retinal shrinkage was estimated using drawings of retinal contours made before and after his-tology and by comparing the distance be-tween the fovea and the optic nerve head. We corrected for shrinkage when the dis-tance measured after histology was smaller than one standard deviation compared to the mean value of all studied retinas before his-tology. For each ganglion cell, M or P, we traced the cell body and dendritic field con-tours and determined the level of dendritic field stratification in the inner plexiform layer by observing the plane of focus during mi-croscopic observation. Using this procedure
M and P cells were classified into outer and inner varieties depending on whether they had dendrites branching in the sublayer “a” or “b” of the inner plexiform layer, respec-tively. The cell body and dendritic field ar-eas were estimated using a bit pad coupled to an IBM-personal compatible computer. The dendritic field areas were measured using the smallest convex polygon enclosing the full profile. Cell body or dendritic field di-ameter was expressed as the didi-ameter of a circle with the same area.
Results
Morphology of M and P cells of the marmoset retina
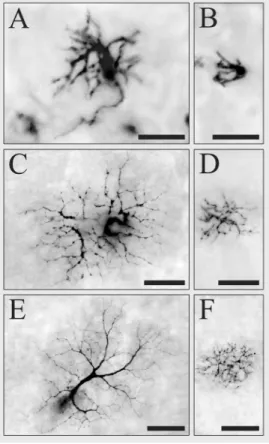
Cell morphology was quantified by meas-uring a sample of 182 M cells and 839 P cells. Marmoset M and P cells were classi-fied according to criteria previously estab-lished for New World anthropoids (15-17). Figure 1 shows examples of M and P gan-glion cells labeled retrogradely with Biocy-tin at different eccentricities in a marmoset retina. It can be observed that Biocytin pro-vided complete filling of cell body, dendrites (even the finest ones) and axon. Morpho-logically, marmoset M and P cells were simi-lar to those described in Old and New World anthropoids. No differences were observed in the shape and size of cell bodies and dendritic fields of the inner and outer varie-ties of M and P cells. Marmoset P cells located in the central retinal region had the characteristic morphology of midget gan-glion cells described by Polyak (18).
Dendrite and cell body sizes of M and P cells
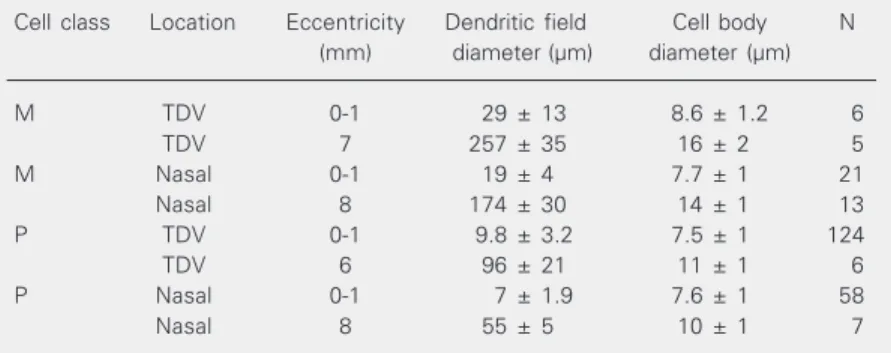
Figures 2 and 3 show how M and P dendritic field and cell body sizes vary as a function of eccentricity in the marmoset retina. Numerical values for representative regions are listed in Table 1. Because of known anisotropies in ganglion-cell density (e.g., 1), data are shown separately for the nasal quadrant (Figures 2B and 3B) and for the combined temporal, dorsal, and ventral quadrants (Figures 2A and 3A). For conve-nience, the latter will be termed TDV quad-rants. M cell dendritic fields were signifi-cantly larger than those of P cells, about 2-4 times at most retinal locations (two-tailed Student t-test, P < 0.01; see insets in Figure 2A,B). Only small differences in cell body size were found between M and P cells. These differences were not larger than 1.6 times, and were statistically significant for
Figure 1. Photomicrographs of marmoset M and P ganglion cells labeled from Biocytin de-posits in the optic nerve. Focus is on the dendritic field at the level of the inner plexiform layer.
A, Outer M cell at 0.45 mm
tem-poral to the fovea. B, Outer P
cell at 0.45 mm temporal to the
fovea. C, Outer M cell 1.95 mm
temporal to the fovea. D, Outer
P cell 1.85 mm temporal to the
fovea. E, Outer M cell 4 mm
temporal to the fovea. F, Outer
P cell 3 mm temporal to the fovea. Scale bars = 10 µm for A, B; 20 µm for C, D; 30 µm for E, F.
Figure 2. Dendritic field size of marmoset M and P ganglion cells as a function of
eccentric-ity. A, Dendritic field size in the
temporal, dorsal, and ventral
quadrants. B, Dendritic field size
in the nasal quadrant. The curves are best-fitted fourth-or-der polynomials and were ob-tained by the least square method. The insets represent the ratio for M/P dendritic field sizes as a function of eccentric-ity, which was obtained by di-viding the best-fitted polynomi-als. M dendritic fields are about three times larger than P den-dritic fields throughout most of the retina. Open squares: outer M cells; filled squares: inner M cells; open circles: outer P cells; filled circles: inner P cells.
5 4 3 2 1 0
M/P ratio
0 2 4 6 8 10 Eccentricity (mm)
M/P ratio
eccentricities larger than 3 mm from fovea (P < 0.01; see insets in Figure 3A,B).
Density of M and P cells
Cell density was estimated in 24 mosa-ics: 12 mosaics from the nasal quadrant and 12 mosaics from the TDV quadrants (Table 2). Examples of such mosaics are shown in Figures 4 and 5. The cell body contour and primary dendrites of each cell in the mosaic were drawn.
We estimated cell density for outer and inner varieties of M and P cells from their mosaics using the spatial statistic routine
de-Table 1. Dendritic field and cell body size for M and P cells of the marmoset retina.
Cell class Location Eccentricity Dendritic field Cell body N
(mm) diameter (µm) diameter (µm)
M TDV 0-1 29 ± 13 8.6 ± 1.2 6
TDV 7 257 ± 35 16 ± 2 5
M Nasal 0-1 19 ± 4 7.7 ± 1 21
Nasal 8 174 ± 30 14 ± 1 13
P TDV 0-1 9.8 ± 3.2 7.5 ± 1 124
TDV 6 96 ± 21 11 ± 1 6
P Nasal 0-1 7 ± 1.9 7.6 ± 1 58
Nasal 8 55 ± 5 10 ± 1 7
Measurements were performed on well-stained cells from the retinas of all 4 animals used in the study. Data are reported as means ± SD. TDV = temporal, dorsal, and ventral quadrants.
Figure 3. Cell body size of marmoset M and P ganglion
cells as a function of eccentricity. A, Cell body size in
the temporal, dorsal, and ventral (TDV) quadrants. B,
Cell body size in the nasal quadrant. The curves are best-fitted fourth-order polynomials and were obtained by the least square method. The insets represent the ratio for M/P cell body sizes as a function of eccentric-ity, which was obtained by dividing the best-fitted poly-nomials. M cell bodies are about 1.5 times larger than P cell bodies throughout most of the retina. Open squares: outer M cells; filled squares: inner M cells; open circles: outer P cells; filled circles: inner P cells.
Table 2. M and P cell mosaics labeled from Biocytin deposits in the optic nerve, indicating the distance from the fovea, and number of cells retrogradely labeled in a
1-mm2 area.
Cell class Location Eccentricity Cell r (µm) Packing Cell density
(mm) count factor (cells/mm2)
M outer Temporal 2.5 165 37 0.50 429
M inner Temporal 2.3 120 50 0.66 309
M outer Ventral 4.7 58 62 0.58 176
M inner Ventral 4.5 58 47 0.56 288
M outer Ventral 6.7 31 94 0.64 83
M inner Ventral 7.0 30 96 0.70 88
M outer Nasal 4.5 98 41 0.57 388
M inner Nasal 4.9 66 65 0.57 156
M outer Nasal 6.7 85 56 0.55 198
M inner Nasal 6.8 80 59 0.67 220
M outer Nasal 8.8 66 80 0.56 101
M inner Nasal 8.7 64 73 0.54 117
P outer Temporal 2.5 632 9 0.27 3818
P inner Temporal 2.3 529 18 0.48 1719
P outer Ventral 4.0 388 20 0.72 2041
P inner Temporal 5.0 195 12 0.25 1965
P outer Ventral 5.9 208 22 0.47 1148
P inner Ventral 6.8 131 41 0.67 465
P outer Nasal 3.9 316 16 0.43 1895
P inner Nasal 4.0 186 17 0.48 1823
P outer Nasal 6.5 208 31 0.65 761
P inner Nasal 6.9 166 33 0.58 600
P outer Nasal 9.0 82 61 0.59 182
P inner Nasal 8.8 83 50 0.65 297
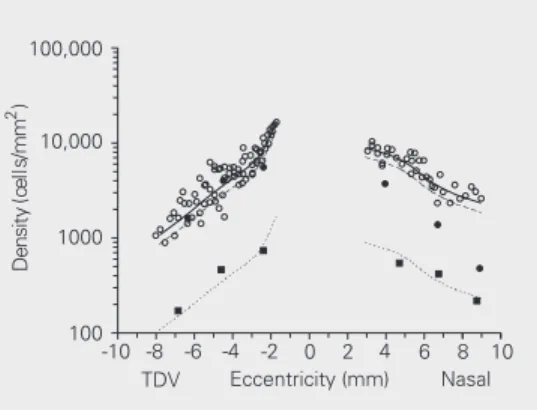
Figure 6. M and P ganglion cell density as a function of retinal eccentricity in the marmoset retina. Cell density was esti-mated by spatial statistical anal-ysis of Biocytin retrogradely la-beled mosaics as described in
the text. A, M ganglion cell
den-sity. B, P ganglion cell density.
Values for the outer and inner varieties of M and P cells were plotted separately. Total cell den-sity for M and P cells was ob-tained by adding the values for the inner and outer varieties and
plotting them in the mean eccentricity for the two mosaics. The density of both M and P cells increased towards the fovea. The M cell density was higher in the nasal quadrant than in the temporal, dorsal, and ventral (TDV) quadrants for similar eccentricities.
Figure 4. A, Marmoset outer M
cell mosaic, located 2.5 mm temporal to the fovea, labeled by Biocytin retrograde transport. In primates, ganglion cell retro-grade labeling from Biocytin de-posits in the optic nerve stains only a fraction of cells belonging to a given mosaic. Only the cell bodies and primary dendrites
were drawn. B, The same
mo-saic illustrated in A, showing
both the labeled cells (filled circles) and the interpolated cells (open circles). The latter were placed using the spatial statistical analysis described in the text. For the analysis zone, delimited by the central square, we estimated a cell density of
376 outer M cells/mm2. Scale
bar = 250 µm.
Figure 5. A, Marmoset outer P
cell mosaic, located 6.5 mm na-sal to the fovea, labeled by Bio-cytin retrograde transport. Only the cell bodies and primary
den-drites were drawn. B, The same
mosaic illustrated in A,
show-ing both the labeled cells (filled circles) and the interpolated cells (open circles). The latter were placed using the spatial statistical analysis described in the text. For the analysis zone, delimited by the central square, we estimated a cell density of
761 outer P cells/mm2. Scale
bar = 250 µm.
A B
scribed in the Material and Methods section. The total cell density for M and P cells was then obtained by adding the values for the inner and outer varieties and plotting them againstthe mean eccentricity for the two mo-saics (Figure 6). Both M and P cell densities decreased with eccentricity in the marmoset retina, and the decrease was steeper in the TDV quadrants than in the nasal quadrant, especially for M cells. We estimated M and P cell density using mosaics at increasing dis-tances from the fovea in the intermediate and peripheral retinal regions (2.5-9 mm of eccen-tricity). It was not possible to use the same method for the foveal slope due to the multi-layered structure of the ganglion cell layer in this region. M cell density decreased towards the retinal periphery in all quadrants. M cell density was higher in the nasal quadrant than in other retinal regions at similar eccentrici-ties, reaching about 740 cells/mm2 at 2.5 mm
of temporal eccentricity. P cell density in-creased from peripheral to more central retinal regions, reaching about 5540 cells/mm2 at 2.5
mm of temporal eccentricity.
Proportion of M and P cells in the total ganglion cell population
We compared the M and P cell density values obtained in the present study with the values published by Wilder et al. (3) for total ganglion cell density in the marmoset (Fig-ure 7). In Fig(Fig-ure 8, we replotted the data reported by Wilder et al. (3) for each retina and their mean total ganglion cell density, as well as our estimates for M and P cell den-sity. In the range of eccentricities studied here (2.5-9 mm from the fovea), M cells represent 8-14% of all ganglion cells, while P cells represent 20-50% in the nasal quad-rant and a larger proportion of all ganglion cells in the other quadrants, exceeding 80% in some locations. Also, all quadrants tended to show an increase in the proportion of P cells towards central retinal regions. In the present study, the M and P proportions were
Figure 7. Comparison between total ganglion cell den-sity (individual values for different animals, replotted from Wilder et al. (3) (open circles) and predicted M and P cell density from the present study as a function of eccentricity in the marmoset retina. The solid line represents the mean values for total ganglion cell
den-sity reported by Wilder et al. (3). Traced and dotted
lines represent 80 and 10% of the mean total ganglion cell density, respectively. M (filled squares) and P cell (filled circles) density values were replotted from Fig-ure 6. There is an increase in M and P cell density from the periphery towards more central regions. M cell density was about 10% in all retinal locations studied. P cell density was about 80% in all quadrants except the nasal quadrant where it decreased to 20-50%. TDV = temporal, dorsal, and ventral quadrants.
estimated using the mean total ganglion cell density reported by Wilder et al. (3). How-ever, since there is a wide variation in gan-glion cell density from animal to animal (see Figure 8), the exact proportion for each gan-glion cell class should be estimated ideally from M, P, and total ganglion cell densities measured in the same retina.
Having the density values for M and P cells, we were able to calculate the P/M density ratio for different regions of the mar-moset retina. In the nasal quadrant, the P/M density ratio decreased from 7 in central locations to 2 in the retinal periphery, but in other quadrants it remained between 9 and 8.
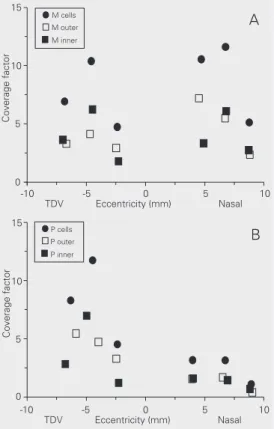
Dendritic coverage factor of M and P cells
the results obtained for each subpopulation to estimate the total M and P cell coverage factor at different retinal locations (Figure 8). We found that M and P cell coverage varies substantially throughout the marmo-set retina. The M cell coverage factor ranged from 5 to 12. The P cell coverage factor ranged from 1 to 3 in the nasal quadrant and from 5 to 12 in the other quadrants.
Regularity of M and P cell mosaics
The regularity of M and P cell mosaics in the marmoset retina after cell interpolation was calculated using the regularity index (14) and packing factor (13). The regularity index, also called conformity ratio (15), was obtained by estimating the ratio between mean nearest neighbor distance and its stand-ard deviation. Theoretically, a random popu-lation has a mean regularity index of 1.913 (15). Mosaics with a high degree of regular-ity have small standard deviations and, con-sequently, a high-regularity index (14). The
packing factor is an adimensional measure-ment of how packed mosaic elemeasure-ments are arranged which ranges from 0 to 1. A crystal-line hexagonal mosaic has a packing factor of 1, while random mosaics have lower val-ues near 0 (13). The regularity index ranged from 6 to 35 and from 9 to 50 for M and P cells, respectively. The packing factor ranged from 0.5 to 0.7 and from 0.25 to 0.72 for M and P cells, respectively (Table 2). Although the packing factor is a measure of packing, not of regularity, a large packing factor im-plies some degree of regularity (13). Thus, the packing factor values obtained for the majority of mosaics in the present study indicate that the mosaics have a fair degree of regularity.
Discussion
Retrograde labeling with Biocytin: a good method to study the morphology and distribution of M and P cells
Marmoset M and P cells retrogradely labeled with Biocytin were morphologically similar to those labeled by in vivo intracellu-lar injection of Neurobiotin or by DiI trans-port in fixed tissue (17,19). Differently from previous studies on marmoset retina (17), we had the advantage of obtaining many well-labeled cells in central retina, very close to the fovea. Thus, a more complete picture about how cell body and dendritic field sizes vary with distance from the fovea was achieved using Biocytin retrograde labeling. For each cell studied we were able to resolve cell body, dendrites and axon, as well as the level of dendritic stratification in the inner plexiform layer.
No differences were seen in the dendritic field sizes of the inner and outer varieties of marmoset M and P cells. This finding con-flicts with the data of Ghosh et al. (17) for the same animal, which show that the inner den-dritic trees are larger than the outer ones. Careful inspection of Figure 2 reveals that in
Figure 8. A, Coverage factor for
marmoset M cells at different
distances from the fovea. B,
some regions this might be the case but the opposite is also observed in other retinal eccentricities. The average difference for M cell dendritic field diameter reported by Ghosh et al. (17) was only 7%. This small difference can be easily obscured by pooling cells from different locations and different animals as we did in the present study.
Proportion of different cell classes throughout the marmoset retina
By means of spatial statistical methods we could calculate cell density, regularity, and coverage of M and P cell mosaics in different locations of the midperipheral and peripheral retina. Perry et al. (4) estimated that M cells, P cells, and other cell classes represented 10, 80, and 10% of all ganglion cells in the macaque retina, respectively. Silveira and Perry (8), Lima et al. (9) and Yamada et al. (7) found M cells to represent up to 20% of the total of ganglion cells in some regions of the capuchin and owl-mon-key retinae. Using our results for M and P cell density and those of Wilder et al. (3) for the density of all ganglion cells, we could estimate how the proportion of different cell classes changes with eccentricity in the mar-moset retina. In the temporal, dorsal, and ventral quadrants, the 1:8:1 proportion for M, P, and other ganglion cell classes seems to hold for the marmoset retina. In these retinal regions there was a good correlation between the predicted values for M and P cell proportions, such as 10 and 80% of total ganglion cell density estimated by Wilder et al. (3), and our results (Figure 7). However, in the nasal quadrant, the P cell proportion decreased and was accompanied by a slight increase in the proportion of M cells and other ganglion cell classes (Figure 7).
Dendritic coverage of M and P cells in the marmoset retina
There are only a few reports in the
litera-ture about M and P cell dendritic coverage (man: (5,6); macaque monkey: (1,4); capu-chin monkey: (7); common marmoset: (17)). In the marmoset retina, Ghosh et al. (17) estimated a coverage factor above 4 for 16 pairs of M cells located between 4.5 and 5.5 mm in the nasal retina. In the present study, we found that the M cell coverage factor ranged from 4.8 to 11.6 for different retinal locations (Figure 7). For another platyrrhine species, the capuchin monkey, Yamada et al. (7) also showed that M and P cell coverage factor changes with eccentricity, between 2-6.3 and 1.4-3.4, respectively, for different locations in the nasal and temporal retina. The numerical differences in the M and P cell coverage factor between capuchin mon-keys and marmosets may be a species differ-ence or may be related to the different meth-ods used in the two studies.
Limitations imposed by the mosaics of M and P cells on the visual acuity of marmosets
Retinal ganglion cell density limits visual acuity, especially at the retinal periphery, where there is a high cone convergence onto ganglion cells. Near the fovea, the main factor that determines the limit of spatial resolution is cone density and packing (20, 21). Troiloet al. (22) calculated the Nyquist frequency imposed by photoreceptors in cen-tral and nasal regions of the marmoset retina. In the foveal region, the Nyquist frequency was 30 cycles/degree for marmosets (22), as opposed to 66 cycles/degree for humans (23). In the retinal periphery, the Nyquist fre-quency was estimated using the total gan-glion cell density, and was found to be 3 cycles/degree for both humans and marmo-sets (3,22).
fre-References
1. Perry VH & Cowey A (1985). The ganglion cell and cone distribu-tions in the monkey’s retina: implication for the central
magnifica-tion factors. Vision Research, 25: 1125-1137.
2. Silveira LCL, Picanço-Diniz CW, Sampaio LES & Oswaldo-Cruz EO
(1989). Retinal ganglion cell distribution in the Cebus monkey: a
comparison with the cortical magnification factor. Vision Research,
29: 1471-1483.
3. Wilder HD, Grünert U, Lee BB & Martin PR (1996). Topography of ganglion cells and photoreceptors in the retina of a New World
monkey: the marmoset Callithrix jacchus. Visual Neuroscience, 13:
335-352.
4. Perry VH, Oehler R & Cowey A (1984). Retinal ganglion cells that project to the dorsal lateral geniculate nucleus in the macaque
monkey. Neuroscience, 12: 1101-1123.
5. Dacey MD & Petersen MR (1992). Dendritic field size and morphol-ogy of midget and parasol ganglion cells of the human retina.
Proceedings of the National Academy of Sciences, USA, 89: 9666-9670.
6. Dacey DM (1993). The mosaic of midget ganglion cells in the
human retina. Journal of Neuroscience, 13: 5334-5355.
7. Yamada ES, Silveira LCL & Perry VH (1996). Morphology, dendritic field size, somal size, density and coverage of M and P retinal
ganglion cells of dichromatic Cebus monkeys. Visual Neuroscience,
13: 1011-1029.
8. Silveira LCL & Perry VH (1991). The topography of magnocellular projecting ganglion cells (M-ganglion cells) in the primate retina.
Neuroscience, 40: 217-237.
9. Lima SMA, Silveira LCL & Perry VH (1996). Distribution of the M retinal ganglion cells in diurnal and nocturnal New World monkeys.
Journal of Comparative Neurology, 368: 538-552.
10. Gomes FL, Yamada ES, Silveira LCL, Lee BB & Muniz JAP (1997). Density and dendritic field size of M and P retinal ganglion cells of
dichromatic marmosets. Investigative Ophthalmology and Visual
Science, 38: S50 (Abstract).
11. Picanço-Diniz CW, Silveira LCL, Yamada ES & Martin KAC (1992).
Biocytin as a retrograde tracer in mammal visual system. Brazilian
Journal of Medical and Biological Research, 25: 57-62.
12. Shu SM, Raine L & Fagner H (1981). Use of avidin-biotin peroxidase
complex (ABC) in immunoperoxidase techniques. Journal of
Histo-chemistry and CytoHisto-chemistry, 29: 577-580.
13. Rodieck RW (1991). The density recovery profile: A method for
analysis of points in the plane applicable to retinal studies. Visual
Neuroscience, 6: 95-111.
14. Wässle H & Riemann HJ (1978). The mosaic of nerve cells in the
mammalian retina. Proceedings of the Royal Society of London.
Series B, Biological Sciences, 200: 441-461.
15. Cook JE (1996). Spatial properties of retinal mosaics: an empirical
evaluation of some existing measures. Visual Neuroscience, 13:
15-30.
16. Silveira LCL, Yamada ES, Perry VH & Picanço-Diniz CW (1994). M and P retinal ganglion cells of diurnal and nocturnal New World
monkeys. NeuroReport, 5: 2077-2081.
17. Ghosh KK, Goodchild AK, Sefton AE & Martin PR (1996). The mor-phology of retinal ganglion cells in the New World marmoset monkey
Callithrix jacchus. Journal of Comparative Neurology, 366: 76-92.
18. Polyak SL (1941). The Retina. University of Chicago Press, Chicago,
IL, USA.
19. Yamada ES, Silveira LCL, Gomes FL & Lee BB (1996). The retinal
ganglion cell classes of New World primates. Revista Brasileira de
Biologia, 56 (Suppl 1): 381-396.
20. Hirsch J & Hylton R (1984). Quality of the primate photoreceptor
lattice and limits of spatial vision. Vision Research, 24: 347-355.
21. Snyder AW & Miller WH (1977). Photoreceptor diameter and
spac-ing for highest resolvspac-ing power. Journal of the Optical Society of
America, 67: 696-698.
22. Troilo D, Howland HC & Judge SJ (1993). Visual optics and retinal
cone topography in the common marmoset (Callithrix jacchus).
Vision Research, 33: 1301-1310.
23. Curcio CA, Sloan KL, Kalina RE & Hendrickson AE (1990). Human
photoreceptor topography. Journal of Comparative Neurology, 292:
497-523.
24. Silveira LCL & de Mello Jr HD (1998). Parallel pathways of the primate vision: sampling of the information in the Fourier space by
M and P cells. In: Chalupa LM & Finlay BL (Editors), Development
and Organization of the Retina: From Molecules to Function. Ple-num Press, New York.
quency for M cells was 1.9 cycles/degree at 2.4 mm (19.4º) and 0.8 cycles/degree at 6.9 mm (55.5º). In the nasal region, this value was 4.2 cycles/degree at 4 mm (31.2º) and 1 cycle/degree at 8.9 mm (78º) for P cells and 1.6 cycles/degree at 4.7 mm (37º) and 0.8 cycles/degree at 8.8 mm (76º) for M cells. These values are compatible with the pro-posed roles of both cell classes in spatial vision. P cells might be important for high spatial frequency detection because they are the only ganglion cell class that sees at this end of the spatial frequency spectrum. How-ever, M cells are also important in intermedi-ate and low spatial frequencies due to their
superior sensitivity to low contrast. In the range of spatial frequency in which both cell classes are sensitive, the combination of their signals at the level of the primary visual cortex should provide the amount of infor-mation required for animal visual perfor-mance (24).
Acknowledgments