Note
DIGITAL-IMAGE ANALYSIS TO PREDICT WEIGHT AND
YIELDS OF BONELESS SUBPRIMAL BEEF CUTS
Gustavo Adolfo Teira1*; Eduardo Tinois2; Roberto de Alencar Lotufo3; Pedro Eduardo de Felício4
1
Depto. de Industria de Alimentos, Universidad Nacional de Entre Ríos, 3200 - Concordia, ER, Argentina. 2
UNICAMP/CEB, C.P. 6040 - 13084-971 - Campinas, SP - Brasil. 3
UNICAMP/FEEC Depto.de Engenharia de Computação e Automação Industrial , C.P. 6101 13083970 Campinas, SP - Brasil.
4
UNICAMP/FEA - Depto. de Tecnologia de Alimentos, C.P. 6121 - 13081-970 - Campinas, SP - Brasil. *Corresponding author <[email protected]>
ABSTRACT: For several decades, beef carcass evaluation for grading or research purposes has relied upon subjective visual scores, and manually taken measurements, but in recent times there has been a growing interest in new technologies capable of improving accuracy of estimates. Equations to predict weight and yield of beef pistol subprimal cuts were developed in this work using digital image analysis (VIA) of the 12th rib steak. Equations to predict total pistol subprimal cuts weight (CUTS) had coefficients of determination (CD) of 0.84, or 0.87 to 0.88, when the independent variables were the VIA parameters and the half carcass weight (HC) or the total pistol weight (TP), respectively. The predicted values for the total seven subprimal cuts, as a percentage of half carcass weight (CUTS%), presented CD values ranging from 0.37 to 0.47, or 0.21 to 0.31, using HC or TP as a principal independent variable. Likewise, the equation for weight of the individual subprimal cuts had CD values ranging from 0.40 to 0.72, or 0.43 to 0.74 using HC or TP, respectively. In this research, the developed VIA procedure has demonstrated good repeatability and accuracy to estimate the total pistol subprimal weights, and some individual subprimal weights.
Key words: beef industry, beef carcass, image analysis, rib eye area, fat thickness
ANÁLISE DE IMAGEM DIGITAL PARA A PREVISÃO DE PESOS
E RENDIMENTOS DE CORTES DE CARNE BOVINA
RESUMO: Por várias décadas, a avaliação de carcaça bovina em sistemas de tipificação ou em pesquisas tem dependido de escores subjetivos e medidas obtidas manualmente, mas ultimamente tem havido um crescente interesse por novas tecnologias capazes de aumentar a acurácia das estimativas. Este trabalho teve como objetivo desenvolver equações para a previsão de pesos e rendimentos de cortes bovinos, através da análise de imagem digital (VIA) de uma seção do contrafilé da 12a
costela. As equações de previsão do peso dos cortes do traseiro especial (CUTS) apresentaram coeficientes de determinação (CD) de 0,84 e de 0,87 – 0,88, quando as variáveis independentes usadas eram os parâmetros VIA e o peso da meia carcaça (HC) ou o peso total do traseiro especial (TP), respectivamente. As equações de previsão do rendimento dos cortes do traseiro especial (CUTS%) representaram de 37,1 a 46,8% e de 21,3 a 30,6% da variação total, quando a principal variável independente utilizada na equação era HC ou TP, respectivamente. Nas equações de previsão dos pesos individuais dos cortes do traseiro especial o CD variou de 0,40 – 0,72 e de 0,43 – 0,74, usando as variáveis HC ou TP, respectivamente. O sistema de análise de imagem digital utilizado apresentou boa repetibilidade, podendo ser considerado um procedimento confiável para a estimativa do peso em cortes do traseiro especial e de alguns dos seus cortes individuais.
Palavras-chave: indústria da carne, carcaça bovina, análise de imagem, área de olho de lombo, espessura de gordura
INTRODUCTION
The value of beef cuts should reflect both con-sumer demand and reliability, and marketing standards which emphasize quality, uniformity and consistency of the meat. Therefore, an evaluation procedure for predict-ing weights and yields of carcasses and beef retail cuts
becomes of great importance for the beef industry (Cross & Belk, 1994).
However their utilization in the beef industry is restricted. Only fast, consistent, accurate, non-destructive and rea-sonable priced methods are of interest to the industry (Swatland, 1995).
Digital image analysis has been identified as the most efficient procedure to evaluate yield of beef car-casses (Cross et al., 1983). It has also been utilized for other purposes: determination of color and fat thickness (Monin, 1998), marbling scores in beef (Albrecht et al., 1996) and pork (Scholz et al., 1996) and water retention capacity in beef (Irie et al., 1996). Li et al. (1999) reported that tenderness of beef could be predicted on the basis of color, marbling and texture measures obtained by im-age analysis.
The use of this technique has been reported to develop an objective system for carcass classification which has been used as a standard of payment to Euro-pean Union beef producers based mainly on the deter-mination of conformation and finish traits (Borggaard et al., 1996). Other studies have reported the use of
video image analysis of steaks removed from the 12th
rib for prediction of weight and yield of subprimal cuts (Cross et al., 1983; Wassenberg et al., 1986; Shackelford et al., 1998).
No information on the use of such systems for the determination of traits of carcasses and cuts produced from Zebu steers, predominantly slaughtered in Brazil, is available. In addition, it is necessary to follow current trends concerning international beef commercialization. The objectives of this work were to predict weight and yield of whole and individual pistol cuts by regression equations using variables obtained through image analy-sis of the 12th rib steak, and to test the accuracy and re-peatability of the procedure.
MATERIAL AND METHODS
Selection of carcasses - Carcasses produced from 51 Nelore crossbred steers, slaughtered at Bertin beef pro-cessing plant (Lins, SP-Brazil) were selected according to various carcass weight, maturity and fatness to obtain a trait variability as large as possible.
Cuts utilized - Carcasses were chilled for 24 hours (1
– 2°C) and broken between the 5th
and the 6th
rib into hindquarter (HQ) and forequarter (FQ). The former was separated from flank and plate (FP) using a
saw and knife, 50 mm to the side of the Longissimus
muscle to obtain the pistol (TP). This was further boned to obtain the following cuts: top round, bottom round, eye round, knuckle, rump, cube roll & strip loin, and tenderloin side strap off. Connective tissue, subcutane-ous fat and trimmings were separated following the stan-dard procedure for cuts exported to Germany by the beef plant.
Sample preparation - A 2.5 cm steak sample was removed from the 12th rib before boning each cube roll & strip loin, and the rib eye area of the steak was delineated for later mea-surement with a compensating polar planimeter. The sample weight was not considered in the total weight of the cut.
Image analysis - Images were captured using a Sony digital camera, MVC-FD71. Bone-in steak samples were placed flat on a non-glare black surface and illuminated with two tungsten, 150 W halogen bulbs. A reference white square paper was positioned on the black surface, next to the object such that the same distance and focus were kept when images were captured.
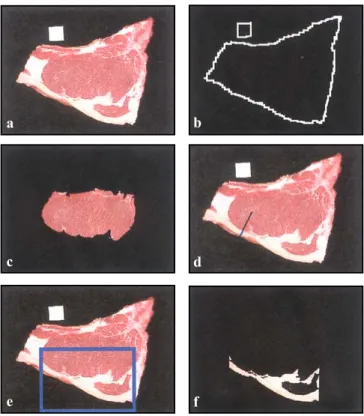
Digital images, saved in a 3.5” floppy disk, were processed using Matlab Mathematical Morphology Toolbox (Barrera et al., 1998). With these tools, a pro-gram for segmentation of the original digital image and extraction of selected parameters was developed. Figure 1a: input image (a known square is included in the im-age to calibrate the pixel dimensions).
To compute the total rib steak area (Figure 1b,
TRSA, cm2) the total rib was extracted from the
back-ground using a standard thresholding technique. The im-age illustrates only the contour of the rib and the square.
The rib eye area (Figure 1c, REA, cm2
) was detected by an automatic procedure based on the so-called watershed transform (Beucher & Meyer, 1993; Lotufo & Falcao, 2000). First the input image was pre-processed by an edge enhancement procedure. Then the best closed contour was found based on a prior knowledge of the approximate po-sition of the rib eye. The watershed transform was respon-sible to find the best closed contour on the edge enhanced image. The rib eye area percentage (REA%) resulted from REA/TRSA x 100.
Fat thickness (FT, mm) is shown in Figure 1d. The black line indicates where the thickness was mea-sured. This line was automatically drawn perpendicular to the rib eye contour. It was traced from a point located on a straight line segment determined by the ends of the rib eye at ¼ of its length from the left.
A rectangle was automatically generated from the points of the rib eye ends (Figure 1e). It shows the loca-tion and subsequent extracloca-tion of fat area, determined by subcutaneous fat in the lower part of rib eye area (Fig-ure 1f, FA, cm2
). This parameter was measured from an image generated using a thresholding technique to detect the fat area. Dark pixels were not considered and white pixels (fat) were counted. The fat area percentage (FA%) resulted from FA/TRSA x 100.
mean square error (MSE) with Stepwise/Maxr procedure, SAS Institute (1985). A second image was captured to test repeatability of the VIA procedure following the Bland & Altman (1986) methodology.
RESULTS AND DISCUSSION
Table 1 shows mean values, standard deviation, maximum and minimum values obtained for the 51 half carcasses used in the present study. The great variability shown by the dependent and independent variables were expected on account of the applied selected methodology. The pistol subprimal cut weights (CUTS), their weight as a percentage of the half carcass weight (CUTS%) and the weight of individual pistol subprimal cuts did not presented correlations (P > 0.01) with the VIA parameters. These parameters however in some cases were correlated
(P < 0.01): TRSA and REA (r = 0.62), REA and REA%
(r = 0.82), FT and FA (r = 0.59), FT and FA% (r = 0.59) and FA and FA% (r = 0.98). Rib eye area, measured by both VIA (REA) and manually with a planimeter (AOLPLAN) presented a significant correlation (P < 0.01) of 0.70. The graphic representation of the observed val-ues of CUTS and CUTS% variables against independent variables used did not show non-linear relationships.
Weight prediction of the seven subprimal cuts - To ob-tain the prediction equation of the CUTS variable, the two best individual indicators, HC or TP and all VIA
param-Figure 1 - Segmentation of selected parameters. a) original digital image of a rib steak. b) total rib steak area. c) rib eye area. d) fat thickness. e) fat area location. f) fat area.
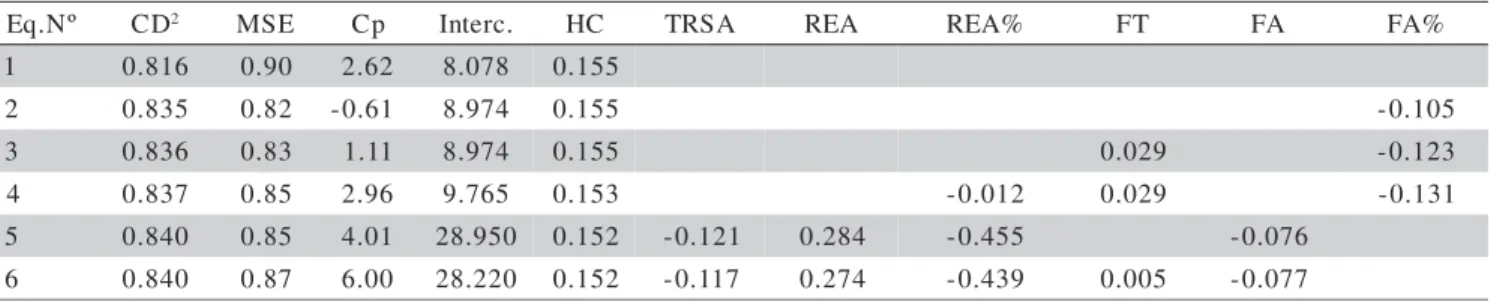
eters were used (Tables 2 and 3). When the HC variable was used, the best equations accounted for 83.5 to 84.0% of the observed variation of the subprimal cut weights. When HC was replaced by TP, the coefficient of deter-mination of the best equations varied from 0.87 to 0.88.
In order to select the most adequate models of re-gression equations, belonging to the same subset of vari-ables, a Cp graph (Mallow statistics) was plotted against p (number of parameters included in the equation). If there was no bias, Cp should be equal to p. In practice, models of Cps near to, but preferably less than p, should be chosen (Pike, 1986).
a b
c d
f e
Table 1 - Descriptive statistics of dependent and indepen-dent variables (N=51).
e l b a i r a
V 1 Mean S.D. Minimum Maximum
s e l b a i r a V t n e d n e p e D ) g k ( S T U
C 29.4 2.18 25.1 34.2
% S T U
C 21.4 0.86 19.7 23.5
) g k ( R P O
T 5.6 0.42 4.5 6.4
) g k ( R T T O
B 3.2 0.30 2.5 3.8
) g k ( R E Y
E 2.4 0.28 1.9 3.4
) g k ( C U N
K 5.0 0.43 4.0 5.8
) g k ( P M U
R 5.4 0.59 4.4 6.4
) g k ( L P I R T
S 6.0 0.59 5.1 7.6
) g k ( L D N E
T 1.8 0.21 1.4 2.3
s e l b a i r a v t n e d n e p e d n I ) g k ( C
H 137.3 12.70 119.4 165.6
) g k ( P
T 65.2 5.58 55.2 76.8
) g k ( Q
F 52.4 5.06 45.6 71.2
) g k ( P
F 19.5 2.98 14.0 25.8
R U T A
M 5.8 1.90 2.0 8.0
m c ( N A L P L O
A 2) 67.3 7.70 48.4 84.9
m c ( A S R
T 2) 156.2 11.70 127.0 195.1
m c ( A E
R 2) 71.0 9.50 52.0 97.3
% A E
R 45.4 4.80 33.9 56.1
) m m ( T
F 5.6 3.00 1.0 17.0
m c ( A
F 2) 12.4 4.60 4.0 24.6
% A
F 7.9 2.90 2.4 16.2
1CUTS: seven pistol sub-primal cuts weight (kg). CUTS%: seven
pistol sub-primal cuts percentage. TOPR: top round weight (kg). BOTTR: bottom round weight (kg). EYER: eye round weight (kg). KNUC: knuckle weight (kg). RUMP: rump weight (kg). STRIPL: cube roll & strip loin weight (kg). TENDL: tenderloin side strap off weight (kg). HC: half carcass weight (kg). TP: total pistol weight (kg). FQ: forequarter weight (kg). FP: flank and plate weight (kg). MATUR: maturity of carcass (number of permanent incisor teeth). AOLPLAN: rib eye area, measured with a planimeter (cm2). TRSA:
total steak area, measured by video image analysis (VIA, cm2). REA:
rib eye area measured by VIA (cm2). REA%: rib eye area percentage,
resulting of REA/TRSA x 100, measured by VIA. FT: fat thickness, measured by VIA (mm). FA: fat area, measured by VIA (cm2). FA%:
This kind of graphical representations, subsets corresponding to equations 1 to 6 (Table 2) and 7 to 12 (Table 3), indicates that the inclusion of VIA parameters results in obtaining the most appropriate models.
Comparison of predictions in relation to carcass weight - The simultaneous graphic representation of both observed and predicted values of the CUTS variable, using the dif-ferent regression equations, versus chilled carcass weight (kg) ranges (A:230-250; B:250-270; C:270-290; D:290-310; E:310-330) conveniently selected, indicated the re-sults of the different models under such conditions.
These equations including the HC variable tended to overestimate values for heavier carcasses (E range) and equations including the TP variable tended to underestimate values for lighter carcasses (A range). Equation n° 8 (Table 3) was considered the most adequate for any weight range carcass. These observations were validated through the Tukey test of residue mean comparison (observed values minus predicted values) for each equation and weight range.
Prediction of total yield of seven pistol subprimal cuts - Prediction of yield accounted for 37.1 to 46.0% or 21.3 to 30.6% of the variation when the major independent variable was HC or TP, respectively (Tables 4 and 5).
Prediction of weight of individual pistol cuts - It is im-portant to predict the weight of individual cuts in order to determine the true value of each carcass. That is why VIA parameters were used to develop different predic-tion equapredic-tions. The results obtained (Table 6 and 7) pre-sented coefficients of determination that varied from 0.40 to 0.72 or from 0.43 to 0.74 when the major independent variable was HC or TP, respectively. These prediction equations were considered satisfactory for some cuts (knuckle, rump) but they presented lower CDs than those reported by Shackelford et al. (1998). German export standards used at the Bertin beef plant may account for these lower values since the removal of all visible fat is required, connective tissue and the trimming of the cuts which may vary from one employee to another.
º N . q
E CD2 MSE Cp Interc. TP TRSA REA% FT FA FA%
7 0.855 0.70 4.29 5.821 0.362
8 0.872 0.63 0.32 6.692 0.360 -0.098
9 0.877 0.62 0.59 4.088 0.372 0.037 -0.049
0
1 0.879 0.63 2.07 4.107 0.371 0.037 0.034 -0.062
1
1 0.879 0.64 4.01 4.843 0.371 -0.004 0.036 0.035 -0.100
2
1 0.879 0.66 6.00 5.392 0.371 -0.008 0.035 0.036 0.042 -0.167
Table 3 - Prediction equations to estimate total pistol cut weights (kg) using total pistol weights (TP; N=51)1.
1Abbreviations are defined in the footnote of Table 1.
2CD: coefficient of determination; MSE: mean square error; Cp: Mallows´statistic; Interc: intersection.
Table 2 - Prediction equations to estimate total pistol cut weights (kg) using half carcass weights (HC; N=51)1.
º N . q
E CD2 MSE Cp Interc. HC TRSA REA REA% FT FA FA%
1 0.816 0.90 2.62 8.078 0.155
2 0.835 0.82 -0.61 8.974 0.155 -0.105
3 0.836 0.83 1.11 8.974 0.155 0.029 -0.123
4 0.837 0.85 2.96 9.765 0.153 -0.012 0.029 -0.131
5 0.840 0.85 4.01 28.950 0.152 -0.121 0.284 -0.455 -0.076
6 0.840 0.87 6.00 28.220 0.152 -0.117 0.274 -0.439 0.005 -0.077
1Abbreviations are defined in the footnote of Table 1.
2CD: coefficient of determination; MSE: mean square error; Cp: Mallow statistics; Interc: intersection.
º N . q
E CD2 MSE Cp Interc. HC MATUR TRSA REA REA% FT FA FA%
3
1 0.371 0.47 2.67 27.11 -0.041
4
1 0.446 0.43 -1.32 27.81 -0.042 -0.082
5
1 0.451 0.43 0.35 27.81 -0.042 0.023 -0.096
6
1 0.452 0.44 2.28 27.79 -0.041 -0.015 0.021 -0.096
7
1 0.453 0.45 4.14 26.63 -0.040 -0.021 0.007 0.018 -0.060
8
1 0.468 0.45 5.00 43.58 -0.042 -0.017 -0.097 0.227 -0.360 -0.058
Table 4 - Prediction equations estimate total pistol cut percentages, using half carcass weights (HC; N=51)1.
1Abbreviations are defined in the footnote in Table 1.
Repeatability of the digital image analysis procedure - Twenty five digital image sample duplicates were uti-lized to test repeatability of the procedure. VIA param-eters determined from duplicates were used in regression equation no6 to predict the CUTS variable. The new es-timated values were compared to those predicted by the same equation using VIA parameters which were ob-tained with the 25 original images. The repeatability of the system remained within the established limits (± 1.96 S.D).
CONCLUSIONS
Weight prediction equations with a high degree of accuracy for pistol cuts were obtained using the digi-tal image analysis procedure, equations no6 and no12 be-ing especially recommended. When grouped accordbe-ing to
T U
C CD2 MSE Cp Interc. TP TRSA REA REA% FT FA FA%
R P O
T 0.493 0.10 6.43 8.521 0.047 -0.037 0.022 0.390 -0.654
R T T O
B 0.518 0.05 4.14 -4.984 0.040 0.036 -0.077 0.121 -0.007
R E Y
E 0.428 0.05 4.10 -0.422 0.034 0.008 0.006 -0.051 0.073
C U N
K 0.737 0.05 4.21 1.186 0.065 -0.029 0.039 0.142 -0.238
P M U
R 0.721 0.11 4.17 7.265 0.084 -0.043 0.096 -0.159 -0.018
L P I R T
S 0.472 0.20 5.89 0.095 0.074 0.016 0.025 -0.058 0.069
L D N E
T 0.524 0.02 4.20 -3.280 0.028 0.020 -0.047 0.075 0.002
Table 7 - Prediction equations to estimate individual pistol cut weights (kg) using TP (N=51)1.
1Abbreviations are defined in the footnote of Table 1.
2CD: coefficient of determination; MSE: mean square error; Cp: Mallows´statistic; Interc: intersection.
T U
C CD2 MSE Cp Interc. HC TRSA REA REA% FT FA FA%
R P O
T 0.452 0.11 7.11 8.342 0.019 -0.033 0.020 0.355 -0.600
R T T O
B 0.426 0.06 4.28 -1.636 0.015 0.020 -0.040 0.058 -0.012
R E Y
E 0.396 0.05 4.11 0.157 0.014 0.021 -0.024 -0.108 0.163
C U N
K 0.626 0.08 4.01 3.185 0.025 -0.004 -0.010 0.103 -0.184
P M U
R 0.721 0.11 4.53 11.212 0.035 -0.061 0.141 -0.240 -0.016
L P I R T
S 0.522 0.18 5.20 3.790 0.033 0.029 0.018 -0.281 0.431
L D N E
T 0.536 0.02 4.31 -1.583 0.012 0.012 -0.028 0.041 -0.001
Table 6 - Prediction equations to estimate individual pistol cut weights (kg) using HC (N=51)1.
1Abbreviations are defined in the footnote of Table 1.
2CD: coefficient of determination; MSE: mean square error; Cp: Mallows´statistic; Interc: intersection.
º N . q
E CD2 MSE Cp Interc. TP MATUR TRSA FT FA FA%
9
1 0.213 0.59 1.63 26.09 -0.071
0
2 0.290 0.55 -1.13 26.82 -0.072 -0.083
1
2 0.297 0.55 0.41 26.71 -0.067 -0.042 -0.085
2
2 0.304 0.56 1.97 25.11 -0.066 -0.052 0.010 -0.053
3
2 0.305 0.57 3.91 25.13 -0.066 -0.049 0.010 0.011 -0.058
4
2 0.306 0.58 5.87 24.14 -0.066 -0.052 0.017 0.009 -0.136 0.124
Table 5 - Prediction equations to estimate total pistol cut percentages, using total pistol weights (TP; N=51)1.
1Abbreviations are defined in the footnote of Table 1.
2CD: coefficient of determination; MSE: mean square error; Cp: Mallows´statistic; Interc: intersection.
chilled carcass weight range, prediction presented a ten-dency to over or underestimate extreme values (ranges A and E). However equation n° 8 made acceptable pre-dictions for all considered weight ranges. Yield predic-tions of pistol subprimal cuts had a relatively low degree of accuracy. Prediction of individual pistol subprimal cut weights (kg) was good in some cases (knuckle, rump) but all values were below the expected. Current trends towards standardization of beef cuts especially for export require fur-ther work to be carried out along these lines to develop a “prototype” with features suitable for its implementation in industrial continuous lines.
ACKNOWLEDGEMENTS
par-Received January 09, 2002
tially funding this project. Engº Pedro Bertin Beloto, R&D manager of Bertin Beef Processing Plant, Lins, S.P.; Prof. Dr. Armando Infante, UNICAMP/IMECC, and De-partment of English from the School of Food Science at the University of Entre Ríos, Concordia, ER, Argentina.
REFERENCES
ALBRECHT, E.; WEGNER, J.; ENDER, K. A new technique for objective evaluation of marbling in beef. Fleischwirtschaft, v.4, p.11-16, 1996. BARRERA, J.; BANON, G.J.; LOTUFO, R.A.; HIRATA JR., R. MMach:
a mathematical morphology toolbox for the KHOROS system. Journal of Electronic Imaging, v.7, p.174-210, 1998.
BEUCHER, S; MEYER, F. The morphological approach to segmentation: the watershed transformation. In: DOUGHERTY, E.R. (Ed.)
Mathematical morphology in image processing. New York: Marcel Dekker, 1993. cap.12, p.433-481.
BLAND, J.M.; ALTMAN, D.G. Statistical methods for assessing agreement between two methods of clinical measurement. The Lancet, v.1, p.307-310, 1986.
BORGGAARD, C.; MADSEN, N.T.; THODBERG, H.H. In line image analysis in the slaughter industry, illustrated by beef carcass classification. Meat Science, v.43, p.s151-s163, 1996.
CROSS, H.R.; BELK, K.E. Objective measurements of carcass and meat quality. Meat Science, v.36, p.191-202, 1994.
CROSS, H.R.; GILLILAND, D.A.; DURLAND, P.R.; SEIDEMAN, S. Beef carcass evaluation by use of a video image analysis system. Journal of Animal Science, v.7, p.908-917, 1983.
IRIE M.; IZUMO, A.; MOHRI, S. Rapid method for determining water-holding capacity in meat using video image analysis and simple formulae.
Meat Science, v.42, p.95-102, 1996.
LI, J.; TAN, J.; MARTZ, F.A.; HEYMANN, H. Image texture features as indicators of beef tenderness. Meat Science, v.53, p.17-22, 1999. LOTUFO, R.; FALCAO, A. The ordered queue and the optimality of the
watershed approaches. In: GOUTSIAS, J.; VINCENT, L.; BLOOMBERG, D. (Ed.) Morphology and its application to image and signal processing. Dordrecht: Kluwer Academic, 2000. p.341-350. (Computational Imaging and Vision, 12)
MALLOWS, C.L. Some comments on Cp. Technometrics, v.15, p.661-675, 1973.
MONIN, G. Recent methods for predicting quality of whole meat. Meat Science, v.49, p.s231-s243, 1998.
PIKE, D.J. A practical approach to regression. In: PIGGOT, J.R. (Ed.)
Statistical procedures in food research. London: Elsevier Applied Science, 1986. cap.3, p.61-100.
SAS INSTITUTE. User’s guide: Statistic. 5.ed. Cary: Statistical Analysis System Institute, 1985. 956p.
SCHOLZ, A.; PAULKE, T.; EGER, H. Determining the degree of marbling in the pig. Use of computer-supported video picture analysis.
Fleischwirtschaft International, v.1, p.9-11, 1996.
SHACKELFORD, S.D.; WHEELER, T.L.; KOOHMARAIE, M. Coupling of image analysis and tenderness classification to simultaneously evaluate carcass cutability, longissimus area, subprimal cut weights, and tenderness of beef. Journal of Animal Science, v.76, p.2631-2640, 1998. SWATLAND, H.J. Objective assessment of meat yield and quality. Trends
in Food Science and Technology, v.6, p.117-120, 1995.