Matching methods to produce maps for pest risk analysis to resources
Texto
Imagem

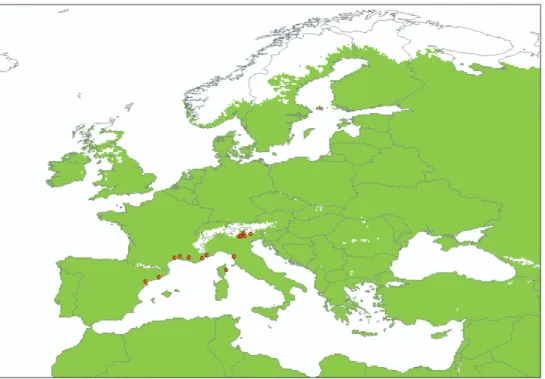
![Figure 1. Distribution of Juniperus communis in Great Britain and Ireland from the National Biodiver- Biodiver-sity Network Gateway (NBN Gateway: data.nbn.org.uk) © Crown copyright and database rights 2011 Ordnance Survey [100017955]](https://thumb-eu.123doks.com/thumbv2/123dok_br/16414323.194701/7.701.179.523.89.576/distribution-juniperus-ireland-national-biodiver-biodiver-copyright-ordnance.webp)

Documentos relacionados
Defendemos, ao longo do capítulo, que os dados fornecidos pelas produções orais e escritas infantis e/ou pelo desempenho de tarefas metafonológicas consti- tuem uma das vias
A história de Portugal e do Brasil distingue-se inteiramente da história da Espanha e das suas colônias americanas nesta época, constituindo um caso interessante para o estudo
Extending the analysis to the financial support provided by MDB, all the risk dimensions are important determinants for the decision to provide support, except the political,
Neste caso particular, foi possível detectar: um sinal de instabilidade (evolução crescente de uma componente de deslocamento de um ponto de referência), identificar a causa
Inicialmente, são apresentadas considerações a respeito de alguns aportes legais que orientam o trabalho com a oralidade, como, por exemplo, as Orientações Curriculares para o
In all population types, populations of 500 and 1,000 individuals were the ones providing the best genetic maps relative to the original genome as shown by the fact that
Desta forma, diante da importância do tema para a saúde pública, delineou-se como objetivos do es- tudo identificar, entre pessoas com hipertensão arterial, os
