Effects of eutrophication and
Typha domingensis Pers
on methanogenesis in tropical constructed wetland
Efeitos da eutrofização e da Macrófita Aquática
Typha domingensis Pers
sobre a metanogênese em alagados construídos tropicais
Joanna Maria da Cunha de Oliveira Santos Neves1, Glauca Torres Aragon2 and Emmanoel Vieira da Silva Filho1
1Departamento de Geoquímica, Instituto de Química, Universidade Federal Fluminense – UFF, Outeiro de São João Batista, CEP 24020-141, Niterói, RJ, Brazil
e-mail: [email protected], [email protected]
2Laboratório de Ciências Ambientais, Universidade Estadual do Norte Fluminense – UENF, Av. Alberto Lamego, 2000, CEP 28013-602, Campos dos Goytacazes, RJ, Brazil
e-mail: [email protected]
Abstract:Aim: Constructed wetlands (CWs) have shown to be an efficient way for removing nutrients from wastewaters. However, a negative effect is the emission of greenhouse gases (GHGs). Methane (CH4) is a GHG released from the organic matter degradation under anaerobic conditions by methanogenic bacteria. In CWs, the excessive nutrient inputs may stimulate both primary production and methanogenesis and then affect the overall cost-benefit balance of this system. Here, we assessed the role of cattail stands (Typha domingensis Pers) on CH4 concentrations in eutrophic and mesotrophic constructed wetlands. Methods: CWs were filled with water and sediment colonized by the aquatic macrophyte Typha domingensis Pers from two tropical freshwater lakes, one mesotrophic and another eutrophic. Results: Our results showed consistently higher CH4 concentrations in waters and sediment in the eutrophic CWs than in the mesotrophic CWs (two times), indicating a positive influence of eutrophication on methanogenesis.
Conclusion: In conclusion, CH4 emissions from tropical CWs demand to be considered or even mitigated in any use of this system.
Keywords: methane, constructed wetlands, Typha domingensis Pers.
Resumo: Objetivo: Os alagados contruídos (CWs) tem sido evidenciados como uma maneira eficiente de remover nutrientes presentes em efluentes. No entanto, um efeito negativo desse processo é a emissão de gases de efeito estufa (GHGs). Metano (CH4) é um gás estufa liberado a partir da degradação da matéria orgânica sob condições anaeróbicas mediada por bactérias metanogênicas. Em alagados construídos, as entradas excedentes de nutrientes podem estimular a produção primária e a metanogênese então pode afetar todo o balanço entre custo-benefício do sistema. Métodos: Nesse trabalho, foi investigado o papel dos bancos de macrófitas (Typha domingensis Pers) sobre as concentrações de CH4 em alagados construídos eutróficos e mesotróficos. Os alagados construídos foram elaborados com água e sedimento colonizado por macrófitas aquáticas da espécie
Typha domingensis Pers provenientes de duas lagoas tropicais, uma mesotrófica e a outra eutrófica. Resultados: Os resultados indicaram concentrações de CH4 significativamente superiores (duas vezes) na coluna d’água e no sedimento nos alagados construídos eutróficos do que nos alagados construídos mesotróficos, fato que indica a influência positiva da eutrofização sobre a metanogênese. Conclusão: Como conclusão, as emissões de metano em alagados construídos tropicais devem ser consideradas e mitigadas, caso esses sistemas sejam utilizados.
Palavras-chave: metano, alagados construídos, Typha domingensis Pers.
B
iological L
The hydrochemical characterization of the water column and sediments from these eutrophic and mesotrophic lake are presented in Table 1.
Lake Vigário (area of 0,3 km2) is a urban ecosystem located between Parque Guarus and Parque Prazeres neighborhoods in Campos dos Goytacazes City, Rio de Janeiro state, Brazil (21° 45’ 15” S and 41° 19’ 28” W). This lake displays an intense development of a marginal population that settled in around from the 60´s,
1. Introduction
The use of constructed wetlands (CWs) as an alternative to conventional wastewater treatment has increased in recent decades in order to reduce the excessive nutrient loading from human activities (Vymazal et al., 1998; Maltais-Landry et al., 2009). These systems can act as buffers between the main sources of pollution and natural watercourses by reducing the inputs of nitrogen (N) and phosphorous (P), nutrients that result in eutrophication of freshwater and saline systems (Schindler, 2006). However, CWs show high emissions of greenhouse gases, including methane (CH4). This gas is produced during the last step of organic degradation under anaerobic conditions (Jones, 1991; Boone, 1991; Fonseca et al., 2004; Conrad et al., 2010). Methanogenesis is influenced by temperature (Kang and Freeman, 2002), redox potential, pH, organic matter contents (Van-Hulzen et al., 1999; Bodegom and Stams, 1999), salinity, absence of oxygen (Keltjens and Vogels, 1993; Oren, 1994; Munson et al., 1997; Thauer, 1998) and other electrons acceptors (Lovley et al., 1982).
High emissions of CH4 to the atmosphere have been observed especially from warm tropical inland waters (Bastviken et al., 2010). Tropical wetlands are broadly distributed in Brazil. These ecosystems are often degraded by the human activities. Nutrient-enriched inputs from sewage, agricultural fertilizers or residuals from the sugarcane processing, for biodiesel production, have been commonly related to eutrophication in inland waters and wetlands at low latitudes. Our hypothesis is that the high nutrient levels in eutrophic constructed wetlands with Typha domingensis Pers. favor the the
methanogenesis.
2. Material and Methods
2.1.Experimental design
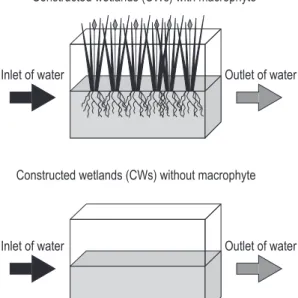
We used twelve 40 L–CWs (length 41.0 cm, height 32.0 cm, depth 41.0 cm) with controlled temperature in a greenhouse. Details of the CWs design are illustrated in the Figure 1. The CWs were filled with water and sediment and replanted with
Typha domingensis Pers. from two tropical lakes in Brazil (one eutrophic – Lake Vigário – and another mesotrophic – Lake Cima). Lake Vigário receives the inputs of sugarcane residuals and domestic waste, while Lake Cima only sugarcane residuals. Both lake are costal coastal, shallow (maximum depth <5.0 m) and relatively close to one another.
Figure 1. Experimental design of constructed wetlands (CWs), showing planted and unplanted plots with
Typha domingensis Pers.
Table 1. Nitrogen, Phosphorus and Organic Carbon in waters and the sediment of Lake Vigário and Lake Cima (References: 1Lannes, 2004 and 2Santos, 2003).
Parameters Vigario Lake1
Cima Lake2
Concentrations in water column N-NH4+ (µg.L–1) 160.0 30.6
N-NO2
– (µg.L–1) 20.0 4.6
N-NO3– (µg.L–1) 110.0 8.7
P-PO4–3 (µg.L–1) 40.0 65.8
DOC (µg.L–1) 16800.0 54.0
Concentrations in sediments
C (mg.L–1) 93.7
-N (mg.L–1) 4.0
-P (mg.L–1) 0.2
-Physico-chemical Parameters of water column
pH 8.2 6.7
Eh 119.0 233.0
Electrical conductivity (µS.cm–1) 827.0 39.2
Total Alkalinity (mEq.L–1) 2.3 0.1
multiparametric probe (Hanna Instruments). Additionally, we determined the macrophyte growth measuring height, leaves, and a general characterization of sediment from all experimental CWs (granulometry – wet sieving and organic matter contents – dry weight) (Kimble et al., 2001). Data were not normally distributed even after transformations (Kolmogorov-Smirnov, p < 0.05). Non parametric tests were then used to compare differences (Kruskal–Wallis followed by the Dunn`s post test, significant p < 0.05 for both).
3. Results
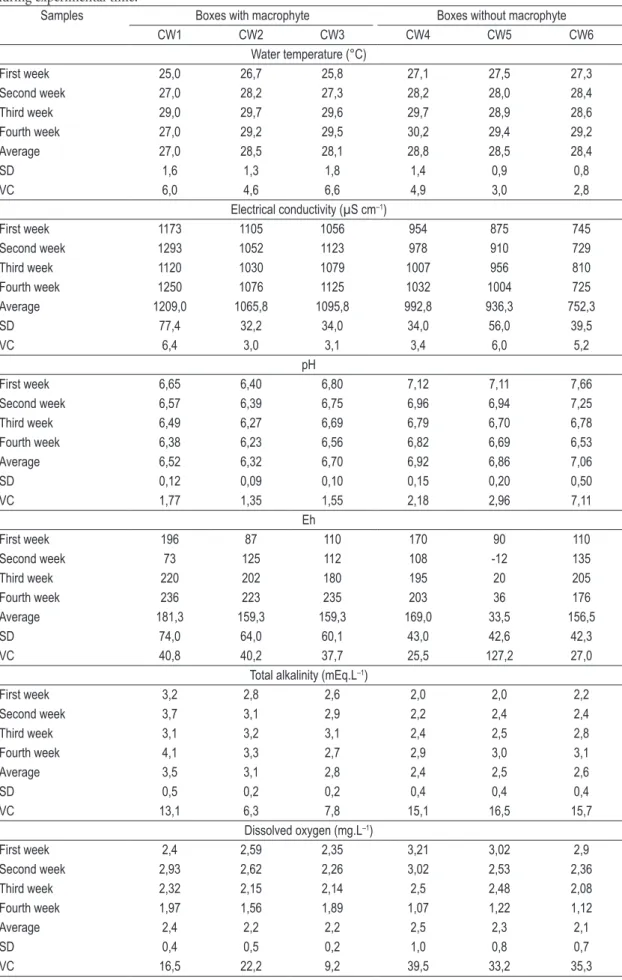
Table 2 indicates the variation of physico-chemical parameters from Eutrophic CWs (Lake Vigário) planted and unplanted plots; and Table 3 indicates the variation of physico-chemical parameters from mesotrophic CWs (Lake Cima) planted and unplanted plots during experimental time.
pH, temperature, electrical conductivity, redox potential, alkalinity and dissolved oxygen concentration in waters were not significantly different comparing CWs within each eutrophic and mesotrophic lake (Kruskal–Wallis, p > 0.05). Granulometric fractions of the sediment and the being a receptor of wastewater. The lake is densely
colonized by emergent and floating aquatic macrophytes, respectively Typha domingensis Pers
and Eicchornia crassipes (Lannes, 2004), but the marginal area colonized by this vegetation has been substantially reduced by silting up from human activities. Lake Vigário shows pH around 7.5 and electrical conductivity around 0.7 mS.cm–1 (Lannes, 2004). On the other hand, Lake Cima has a lower human disturbance. This lake is located in the northern region of Rio de Janeiro state, in Campos dos Goytacazes (21° 45’ 23” S, 41° 19’ 49” W), showing freshwaters with a conductivity around 50 µS.cm–1 (Luz, 2003).
The experimental design was conducted using two hydraulic systems containing six 40 L–boxes of asbestos and one 200 L–box (general source of water). In each one of 40 L–boxes, a drip system on the surface to keep constant the water level with the continuous water inflow(water depth was maintained in 15 cm, accordingly to Figure 1). Three CWs filled with sediment and waters from each mesotrophic and eutrophic lake were planted with the aquatic macrophyte Typha domingensis Pers
collected in the respective lakes (five young individuals), while other three were kept unplanted, in order to assess the effects of macrophytes on the methane concentrations in waters and sediments.. First measurements in our experimental CWs were conducted after 30 days for stabilization.
CH4 concentrations in waters and the bottom sediment were analyzed 5 mL of surface waters which were collected in all CWs water surface using. Water samples (5 mL) were taken using plastic syringes with needle and stored in 10 mL– glass vials closed with massive rubber stoppers. In addition, a small amount of NaCl was added in each vial to expurgate methane from waters to the headspace (Casper, 1992). These vials were kept under refrigeration before headspace analysis in a Gas Cromatographer (GC–14B Shimadzu), using a chromatographic packed column Porapak-Q at 60 °C; column injector at 120 °C, FID detector at 200 °C, and nitrogen was adopted as gas carrier. Then, 4 mL of NaOH 4% (v/v) was added using a syringe with needle to expurge CH4 from the pore water to the headspace (Casper, 1992). After shaking, 0.2 mL of gas from headspace was also extracted using plastic syringes with needle, and then injected in the GC described above). Abiotic variables measured during the experiment in waters were temperature, electrical conductivity, pH, total alkalinity and dissolved oxygen using a calibrated
Figure 2. CH4 concentrations in waters of eutrophic (Lake Vigário) and mesotrophic (Lake Cima) CW`s with and without macrophyte. a) Lake Vigário CWs with macrophyte Typha domingensis Pers; b) Lake Vigário CWs without macrophyte; c) Lake Cima CWs with
Typha domingensis Pers; and d) Lake Cima unplanted
Table 2. Variation of physico-chemical parameters from Eutrophic CWs (Lake Vigário) planted and unplanted plots during experimental time.
Samples Boxes with macrophyte Boxes without macrophyte
CW1 CW2 CW3 CW4 CW5 CW6
Water temperature (°C)
First week 25,0 26,7 25,8 27,1 27,5 27,3
Second week 27,0 28,2 27,3 28,2 28,0 28,4
Third week 29,0 29,7 29,6 29,7 28,9 28,6
Fourth week 27,0 29,2 29,5 30,2 29,4 29,2
Average 27,0 28,5 28,1 28,8 28,5 28,4
SD 1,6 1,3 1,8 1,4 0,9 0,8
VC 6,0 4,6 6,6 4,9 3,0 2,8
Electrical conductivity (µS cm–1)
First week 1173 1105 1056 954 875 745
Second week 1293 1052 1123 978 910 729
Third week 1120 1030 1079 1007 956 810
Fourth week 1250 1076 1125 1032 1004 725
Average 1209,0 1065,8 1095,8 992,8 936,3 752,3
SD 77,4 32,2 34,0 34,0 56,0 39,5
VC 6,4 3,0 3,1 3,4 6,0 5,2
pH
First week 6,65 6,40 6,80 7,12 7,11 7,66
Second week 6,57 6,39 6,75 6,96 6,94 7,25
Third week 6,49 6,27 6,69 6,79 6,70 6,78
Fourth week 6,38 6,23 6,56 6,82 6,69 6,53
Average 6,52 6,32 6,70 6,92 6,86 7,06
SD 0,12 0,09 0,10 0,15 0,20 0,50
VC 1,77 1,35 1,55 2,18 2,96 7,11
Eh
First week 196 87 110 170 90 110
Second week 73 125 112 108 -12 135
Third week 220 202 180 195 20 205
Fourth week 236 223 235 203 36 176
Average 181,3 159,3 159,3 169,0 33,5 156,5
SD 74,0 64,0 60,1 43,0 42,6 42,3
VC 40,8 40,2 37,7 25,5 127,2 27,0
Total alkalinity (mEq.L–1)
First week 3,2 2,8 2,6 2,0 2,0 2,2
Second week 3,7 3,1 2,9 2,2 2,4 2,4
Third week 3,1 3,2 3,1 2,4 2,5 2,8
Fourth week 4,1 3,3 2,7 2,9 3,0 3,1
Average 3,5 3,1 2,8 2,4 2,5 2,6
SD 0,5 0,2 0,2 0,4 0,4 0,4
VC 13,1 6,3 7,8 15,1 16,5 15,7
Dissolved oxygen (mg.L–1)
First week 2,4 2,59 2,35 3,21 3,02 2,9
Second week 2,93 2,62 2,26 3,02 2,53 2,36
Third week 2,32 2,15 2,14 2,5 2,48 2,08
Fourth week 1,97 1,56 1,89 1,07 1,22 1,12
Average 2,4 2,2 2,2 2,5 2,3 2,1
SD 0,4 0,5 0,2 1,0 0,8 0,7
Table 3. Variation of physico-chemical parameters from mesotrophic CWs (Lake Cima) planted and unplanted plots.
Samples Boxes with macrophyte Boxes without macrophyte
CW1 CW2 CW3 CW4 CW5 CW6
Water temperature (°C)
First week 28,3 27,5 26,9 28,5 27,9 27,2
Second week 27,5 28,2 27,3 28,9 28,2 28,6
Third week 29,0 28,7 27,9 29,2 28,6 29,2
Fourth week 28,3 29,3 29,6 29,8 28,9 28,7
Average 28,3 28,4 27,9 29,1 28,4 28,4
SD 0,6 0,8 1,2 0,5 0,4 0,9
VC 2,2 2,7 4,3 1,9 1,5 3,0
Electrical Conductivity (µS cm–1)
First week 42,0 45,7 42,3 52,7 56,3 42,9
Second week 47,0 49,0 46,0 50,3 59,7 53,6
Third week 56,0 54,0 54,3 45,0 41,6 57,2
Fourth week 59,0 48,2 57,8 42,3 42,5 47,4
Average 51,0 49,2 50,1 47,6 50,0 50,3
SD 7,9 3,5 7,2 4,8 9,3 6,4
VC 15,4 7,1 14,3 10,0 18,6 12,7
pH
First week 6,7 6,9 6,8 6,7 6,5 6,7
Second week 6,5 6,7 6,7 6,5 6,3 6,6
Third week 6,2 6,6 6,7 6,5 6,3 6,6
Fourth week 6,4 6,0 6,5 6,3 6,0 6,3
Average 6,5 6,6 6,7 6,5 6,3 6,6
SD 0,2 0,4 0,1 0,2 0,2 0,2
VC 3,2 5,9 1,9 2,5 3,3 2,6
Eh
First week 229 234 312 253 232 220
Second week 275 221 298 243 227 216
Third week 178 252 276 240 220 208
Fourth week 154 198 254 224 214 210
Average 209,0 226,3 285,0 240,0 223,3 213,5
SD 54,0 22,7 25,4 12,0 7,9 5,5
VC 25,8 10,0 8,9 5,0 3,5 2,6
Total alkalinity (mEq.L–1)
First week 0,63 0,64 0,60 0,66 0,63 0,62
Second week 0,55 0,60 0,56 0,64 0,57 0,56
Third week 0,42 0,57 0,43 0,56 0,54 0,54
Fourth week 0,52 0,42 0,47 0,52 0,58 0,57
Average 0,5 0,6 0,5 0,6 0,6 0,6
SD 0,1 0,1 0,1 0,1 0,0 0,0
VC 16,4 17,2 15,2 11,1 6,5 5,9
Dissolved oxygen (mg.L–1)
First week 7,6 7,4 7,4 7,0 6,9 6,5
Second week 7,0 7,2 7,2 6,7 6,5 6,2
Third week 6,5 7,2 7 6,5 6,2 6,0
Fourth week 6,2 6,8 6,4 6,3 5,9 6,0
Average 6,8 7,2 7,0 6,6 6,4 6,2
SD 0,6 0,3 0,4 0,3 0,4 0,2
ranging from 50.2 to 79.6 mmol.L–1 and from 26.6 to 36.2 µmol.L–1 respectively (Figure 3). Planted and unplanted eutrophic CWs showed methane concentrations in the sediment significantly higher than those mesotrophic (Kruskal–Wallis test: p < 0.05 and Dunn´s test p < 0.05).
organic matter contents indicated that the silt-clay fraction was predominant for both lakes. Higher organic matter contents were observed in the eutrophic than in the mesotrophic lake sediments, respectively 14 and 8%.CH4 concentrations in waters of the eutrophic CWs (Figure 2 and Table 4) ranged from 0.13 to 1.40 µmol.L–1, showing higher values than in mesotrophic CWs (0.12-0.55 µmol.L–1, Figure 2). Comparing planted and unplanted eutrophic CWs, CH4 concentrations were higher in planted than in unplanted plots (Kruskal–Wallis, p < 0.05 and Dunn, p < 0.05), but no significant differences were observed between mesotrophic CWs (Kruskal–Wallis, p < 0.05). Indeed, we did not find any significant relationship between presence of vegetation and methane concentrations in mesotrophic CWs, (linear regression, R2 = 0.61; p < 0.05). Planted plots also showed higher methane concentrations in waters than unplanted plots, considering both eutrophic and mesotrophic CWs (Kruskal–Wallis, p < 0.05 and Dunn, p < 0.05).
Typha domingensis was not related to significant differences for CH4 concentrations in eutrophic and mesotrophic CWs (Kruskal–Wallis, p < 0.05 and Dunn, p < 0.05). Higher methane concentrations in waters were found in eutrophic CWs, ranging from 63.4 to 69.7 µmol.L–1, than in mesotrophic CWs (Kruskal–Wallis test: p < 0.05 and Dunn´s test p < 0.05), ranging from 29.3 to 34.1 µmol.L–1. In the sediment, methane concentrations in the eutrophic CWs were higher than in mesotrophic ones,
Table 4. Results obtained with Dunn´s test for evaluate the significant differences of treatments (with
Typha domin-gensis Pers and without macrophyte) for Lake Vigário CWs (eutrophic) and Lake Cima CWs (mesotrophic).
MSD Critical value Interpretation Treatments Vigario CWs 6.09 2.93 Significant difference
Tratments Cima CWs 2.33 2.93 Not significant
Table 5. Methane concentration in waters for others aquatic ecosystems.
Location CH4 (µmol.L
–1) References
Freshwater marsh - China (vegetated) 8.0-232.0 Ding et al. (2004) Cabiunas lagoon - Rio de Janeiro, Brazil 12.3-16.4 Fonseca et al. (2004) Diogo lake - São Paulo, Brazil (macrophyte stand) 0.84-2.60 Ballester and Santos (2001) Diogo lake - São Paulo, Brazil (limnetic region) 0.73-1.35 Ballester and Santos (2001) Agacha river - Georgia, USA 0.33-1.65 Pulliam (1993) Grasil lake - Fuchskahld, Germany 3.7-14.7 Chan et al. (2002 Denmark coast 0.0004 (maximum) Hansen et al. (2001) Mediterranean sea 0.0015-0.0045 Karisiddaiah (2000) Open water (water surface) 0.0018-0.0031 Heyer (1990) Cima CWs - Rio de Janeiro, Brazil 0.12 v 0.55 This research Vigario CWs - Rio de Janeiro, Brazil 0.13-1.40 This research
this study, macrophyte Typha domingensis Pers may be acting as methane source to the atmosphere, as is widely discussed in literature. This shows the importance of eutrophication and organic matter contents in eutrophic CWs, reducing dissolved oxygen and stimulating methanogenesis. The use of constructed wetlands is usually applied for wastewater treatment and nutrient removal, but the GHG’s emissions to the atmosphere demand to be considered and subsequently mitigated. Our data confirms the contribution of constructed wetlands for GHG production; nonetheless further investigations mainly in tropical ecosystems are required.
Acknowledgements
This study was supported by Fundação de Amparo a Pesquisa do Estado do Rio de Janeiro – FAPERJ.
References
BALLESTER, MVR. and SANTOS, JE. 2001. Biogenic gases (CH4, CO2 and O2) distribution in a riverine wetlands system. In FARIA, BM., FARJALLA, VF. and ESTEVES, FA., eds. Aquatic Microbial Ecology
in Brazil. Rio de Janeiro: UFRJ. Series Oecologia
Brasiliensis. vol. 9, p. 21-30.
BASTVIKEN, D., SANTORO, AL., MAROTTA, H., PINHO, LQ., CALHEIROS, DF., CRILL, P. and ENRICH-PRAST, A. 2010. Methane emission from Pantanal, South America, during low water season: toward more comprehensive sampling. Environmental Science and Technology, vol. 44, p. 5450-5455. http:// dx.doi.org/10.1021/es1005048
BODEGOM, PMV. and STAMS, AJM. 1999. Effects of alternative electron acceptors and temperature on methanogenesis in rice paddy soils. Chemosphere, vol. 39, no. 2, p. 167-182. http://dx.doi.org/10.1016/ S0045-6535(99)00101-0
BOONE, DR. 1991. Ecology of methanogenesis. In ROGERS, JE. and WHITMAN, WE., eds.
Microbial production and consumption of greenhouse
gases: methane, nitrogen oxides and halomethanes.
Washington: American Society of Microbiology. BRIX, H., BRIAN, K. and SORREL, HH. 1996.
Gas fluxes achieved by in situ convective flow in
Phragmites australis. Aquatic Botany, vol. 54, no. 2-3, p. 151-163. http://dx.doi.org/10.1016/0304-3770(96)01042-X
CASPER, P. 1992. Methane production in lakes of different trophic state. Archiv für Hydrobiologie– Beiheft Ergebnisse der Limnologie, vol. 37, p. 149-154. CHAN, OC., WOLF, M., HEPPERLE, D. and
CASPER, P. 2002. Methanogenic archael community
4. Discussion
Our results consistently indicate a positive influence from eutrophication and the presence of aquatic macrophyte Typha domingensis Pers
on methanogenesis. Additionally, high alkalinity of eutrophic CWs is likely caused by the sewage inputs into this lake, supporting anaerobic processes of organic matter cycling (Brix et al., 1996; Singh, 2001; Chang and Yang, 2003; Wang and Han, 2005).
For unplanted eutrophic CWs, CH4
concentrations in waters and sediments increased
over the experiment, confirming lower CH4
production related to absence of aquatic macrophyte (Chan et al., 2002). In contrast, higher CH4 concentrations found in eutrophic CWs were likely caused by the sewage inputs into Lake Vigário, increasing the availability of organic substrates to methanogenesis (Neue et al., 1995, Singh et al., 2000; Liikanen and Martikainen, 2003).
Lake Vigário is a freshwater lake, nonetheless in this lake is important detach the role of sulphate-reduction competing with methanogenesis by organic substrates in Lake Vigário (Lannes, 2004); high methane concentrations in waters and sediments of CWs also suggested potentially elevated rates of methanogenesis in this eutrophic lake. This confirms that besides sulphate-reduction, the methanogenesis might be also an important organic degradation processes under highly eutrophic conditions that are typically related to substantial sewage inputs.
Planted plots also showed higher CH4
concentrations in waters than those unplanted, confirming the role of the aquatic vegetation to increase methanogenesis like in artificial rice fields (Schütz et al., 1989) or natural tropical lakes (Bastviken et al., 2010). The CH4 concentrations observed in experimental CWs are within the range for other tropical lakes in Brazil (Table 5), with the exception was a brackish tropical coastal lagoons (e.g. Lagoon Cabiúnas), which showed lower CH4 concentrations probably by the higher salinity limiting CH4 production (Fonseca et al., 2004).
do Norte Fluminense. [Tese de Doutorado em Biociência e Biotecnologia].
LIIKANEN, A. and MARTIKAINEN, PJ. 2003. Effect of ammonium and oxygen on methane and nitrous oxide fluxes across sediment-water interface in a eutrophic lake. Chemosphere, vol. 52, no. 8, p. 1287-1293. http://dx.doi.org/10.1016/S0045-6535(03)00224-8
LOVLEY, DR., DWEYER, DF. and KLUG, MJ. 1982. Kinetic analysis of competition between sulfate reducers and methanogens for hydrogen in sediments. Applied Environmental Microbiology, vol. 43, no. 6, p. 1373-1379.
LUZ, CFP. 2003. Os registros palinológicos como sensores das dinâmicas da vegetaçãono Holoceno da Região Norte do Estado do Rio de Janeiro (Brasil). Rio de Janeiro : Instituto de Geociências, Universidade Federal do Rio de Janeiro. [Tese de Doutorado em Geologia]. MALTAIS-LANDRY, G., MARANGER, R. and
BRISSON, J. 2009. Effect of artificial and macrophyte species on nitrogen cycling and gas flu in constructed wetlands. Ecologycal Engineering, vol. 35, p. 221-229. MUNSON, MA., NEDWELL, DB. and EMBLEY,
TM. 1997. Phylogenetic diversity of Archaea in sediment samples from a coastal salt marsh. Applied Environmental Microbiology, vol. 63, no. 3, p. 4729-4733..
NEUE, HU., WASSMANN, R., LANTIN, RS., ALBERTO, MA., ADUNA, JB. and JAVELLANA, AM. 1995. Factors affecting methane emission from rice fields. Atmospheric Environment, vol. 30, no. 10-11, p. 1751-1754. http://dx.doi.org/10.1016/1352-2310(95)00375-4
OREN, A. 1994. The ecology of the extremely halophilic Archaea. FEMS Microbiology Ecology, vol. 13, no. 4, p. 415-440.
PULLIAM, WM. 1993. Carbon dioxide and methane exports from a southeastern floodplain swamp.
Ecological Monographs, vol. 63, no. 1, p. 29-53. http:// dx.doi.org/10.2307/2937122
SANTOS, JMCO. 2003. C o m p a r t i m e n t a ç ã o
biogeoquímica da bacia de drenagem do Rio Imbé.
Campos dos Goytacazes: Universidade Estadual do Norte Fluminense. [Monografia de Graduação em Biologia].
SCHINDLER, DW. 2006. Recent advances in the understanding and management of eutrophication.
Limnology and Oceanography, vol. 51, no. 1, part 2, p. 356-36.
SCHÜTZ, H., HOLZAPFEL-PSCHORN, A., CONRAD, R., RENNENBERG, H. and SEILER, W. 1989. A three year continuous record on influence of daytime, season and fertilize treatment on methane emission: rates from an Italian rice paddy field.
Journal of Geophysical Research, D Atmospheres, vol. 94, no. 16.
in the sediment of an artificially portioned acidic bog lake. FEMS Microbiology Ecology, vol. 42, p. 119-129. CHANG, TC. and YANG, SS. 2003. Methane emissions
from wetlands in Taiwan. Atmospheric Environment, vol. 37, no. 32, p. 4551-4558.
CONRAD, R., KLOSE, M., CLAUS, P. and ENRICH-PRAST, A. 2010. Methanogenic pathway 13C isotope fractioning, and archaeal community composition in the sediment of two clear-water lakes of Amazonia. Limnology and Oceanography, vol. 55, no. 2, p. 689-702. http://dx.doi.org/10.4319/ lo.2009.55.2.0689
DING, W., CAI, Z. and TSURUTA, H. 2004. Methane concentration and emissions affected by methane transport capacity of plants in freshwater marsh. Water, air and soil pollution, vol. 158, p. 99-111. http://dx.doi.org/10.1023/ B:WATE.0000044836.71634.3d
FONSECA, ALS., MINELLO, M., MARINHO, CC. and ESTEVES, FA. 2004. Methane Concentration in Water Column and in Pore Water of a Coastal Lagoon (Cabiúnas Lagoon, Macaé, RJ, Brazil).
Brazilian Archives of Biology and Technology, vol. 47, no. 2, p. 301-308. http://dx.doi.org/10.1590/S1516-89132004000200018
HANSEN, LK., JAKOBSEN, R. and POSTMA, D. 2001. Methanogenics in a shallow sandy aquifer, Romo, Denmark. Geochimica et Cosmochimica Acta, vol. 65, no. 17, p. 2925-2935. http://dx.doi. org/10.1016/S0016-7037(01)00653-6
HEYER, J. 1990. Der Kreislauf des Methans. Berlin: Akademie-Verlag.
JONES, WJ. 1991. Diversity and physiology of methanogens. In ROGERS, JE. and WHITMAN, WB., eds. Microbial Production and Consumption
of Greenhouse gases: Methane, Nitrogen oxides and
Halomethanes. Washington: American Society for Microbiology.
KANG, H. and FREEMAN, C. 2002. The influence of hydrochemistry on methane emissions from two contrasting northern wetlands. Water, air and soil pollution, vol. 141, no. 1-4, p. 263-272. http://dx.doi. org/10.1023/A:1021324326859
KIMBLE, JM., LAL, R. and FOLLET, RF. 2001. Methods for assessing soil C pools. In LAL, R., KIMBLE, JM., FOLLET, RF. and STEWART, BA., eds. Assessment methods for soil carbon: Advances in soil science. BocaRaton: CRC Press.
KELTJENS, JT. and VOGELS, GD. 1993. Conversion of methanol and methylamines to methane and carbon dioxide. In FERRY, JG., eds. Methanogenesis. New York: Chapman and Hall.
VAN-HULZEN, JB., SEGERS, R., VAN BODEGOM and LEFFELAAR, PM. 1999. Temperature effects on soil methane production: an explanation for observed variability. Soil Biology Biochemistry, vol. 31, no. 14, p. 1919-1929. http://dx.doi.org/10.1016/S0038-0717(99)00109-1
VYMAZAL, J., BRIX, H., COOPER, PF., GREEN, MB. and HABERL, R. 1998. Constructed wetlands for wastewater treatment in Europe. Leiden: Blackhyus Publishers.
WANG, ZP. and HAN, X.G. 2005. Diurnal variation in methane emissions in relation to plants and environmental variables in the Inner Mongolia marshes. Atmospheric Environment, vol. 39, no. 34, p. 6295-6305. http://dx.doi.org/10.1016/j. atmosenv.2005.07.010
Received: 21 October 2010 Accepted: 23 November 2011 SINGH, SN. 2001. Exploring correlation between
redox potential and other edaphic factors in field and laboratory conditions in relation to methane efflux. Environmental International, vol. 27, no. 4, p. 265-274. http://dx.doi.org/10.1016/S0160-4120(01)00055-1
S I N G H , S N . , K U L S H R E S H T H A , K . a n d AGNIHOTRI, S. 2000. Seasonal dynamics of methane emission from wetlands. Chemosphere: Global Change Science, vol. 2, no. 1, p. 39-46. http://dx.doi.org/10.1016/S1465-9972(99)00046-X THAUER, R. 1998. Biochemistry of methanogenesis: