Printed version ISSN 0001-3765 / Online version ISSN 1678-2690 http://dx.doi.org/10.1590/0001-3765201620150788
www.scielo.br/aabc
Morphometry and mixing regime of a tropical lake: Lake Nova (Southeastern Brazil)
MoNica a. GoNçaLveS1
, FáBio c. Garcia2
and GiLBerto F. BarroSo2
1
Agência Estadual de Recursos Hídricos/AGERH, Rua Desembargador José Fortunato Ribeiro, 95, Mata da Praia, 29066-070 Vitória, ES, Brasil
2Universidade Federal do Espírito Santo, Departamento de Oceanografia e Ecologia,
Avenida Fernando Ferrari, 514, 29075-910 Vitória, ES, Brasil
Manuscript received on November 10, 2015; accepted for publication on April 18, 2016
aBStract
Lake Nova (15.5 km2
) is the second largest lake in the Lower Doce River Valley (Southeastern Brazil). A better understanding of ecosystem structure and functioning requires knowledge about lake morphometry, given that lake basin form influences water column stratification. The present study aims to contribute to the understanding of relationship between morphometry and mixing patterns of deep tropical lakes in Brazil. Water column profiles of temperature and dissolved oxygen were taken on four sampling sites along the lake major axis during 2011, 2012 and 2013. The bathymetric survey was carried out in July 2011, along 131.7 km of hydrographic tracks yield 51,692 depth points. Morphometric features of lake size and form factors describe the relative deep subrectangular elongated basin with maximum length of 15.7 km, shoreline development index 5.0, volume of 0.23 km3
, volume development of 1.3, and maximum, mean and relative depths of 33.9 m, 14.7 m and 0.7 %, respectively. The deep basin induces a monomictic pattern, with thermal stratification during the wet/warm season associated with anoxic bottom waters (1/3 of lake volume), and mixing during dry and cool season. Based on in situ measurements of tributary river discharges, theoretical retention time (RT) has been estimated in 13.4 years. The morphometry of Lake Nova promote long water RT and the warm monomictic mixing pattern, which is in accordance to the deep tropical lakes in Brazil.
Key words: lake morphometry, bathymetry, tropical lakes, mixing pattern, geographic information system.
Correspondence to: Monica Amorim Gonçalves E-mail: [email protected]
iNtroDUctioN
Morphometric features of lake ecosystems
influence several aspects of lake physics, chemistry
and ecology. Lake size and form are related to
the heat exchanges with the adjacent atmosphere,
and therefore with water column mixing pattern.
The mixing pattern, in turn, influences spatial and
temporal variability of hydrochemistry regarding the distribution of nutrients and dissolved gases. Wind work on the lake surface may influence mixing depths, as well as sediments resuspension on shallow areas, reducing water transparency. Hydrodynamics of tributary rivers pondered with lake volume yield the retention time, which in turn control mass balance of substances, such
as contaminants. Therefore, lake morphometry
secondary productivity, and the overall lake trophic state (Håkanson 2005).
In Brazil, lake morphometry studies are relative incipient with emphasis on artificial lakes for management purposes of hydropower generation. In contrast, natural lakes are seldom investigated
regarding their morphometric features. The work
by Schwarzbold and Schäfer (1984) is the most comprehensive comparing basic morphometry parameters of 61 coastal lakes of Rio Grande do Sul State. In the Middle Doce River Valley – MDRV (Minas Gerais) there is a lake district with about 158 lakes (Barbosa et al. 2013) with a great variety of size and form, with attention to Lake Dom Helvécio, a deep lake with maximum (Zmax) and mean (Zmv) depths of 39.2 and 11.3 m, respectively
(Bezerra-Neto and Pinto-Coelho 2008). These deep
Brazilian tropical lakes show a trend for typical warm monomictic systems with anoxic bottom
waters during the stratification season (Henry et al.
1989). In the Lower Doce River Valley - LDRV, at the Espírito Santo State, there is a lake district with 90 lakes ranging from 0.8 ha to 62 km2 of surface
area, with a total of 165 km2 and distributed into a coastal plain and within alluvial valleys of Barreiras geological formation (Barroso 2007). Some lakes in the alluvial valleys can be considered relatively deep compared to natural Brazilian lakes (mean Zmax = 11.8 m, N = 30; mean Zmv = 5.1 m, N = 20), with Lake Palmas with maximum and mean depths of 50.7 and 21.3 m, respectively (Barroso et al. 2014).
The present study aims to contribute to the un -derstanding of relationship between morphometry and mixing patterns of deep tropical lakes in Brazil, which seems to show a warm monomictic regime.
MateriaLS aND MetHoDS
Study AreA
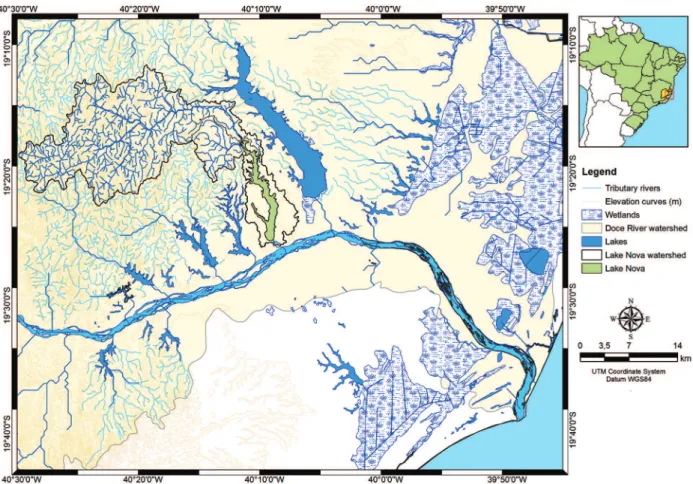
Lake Nova is a tropical natural lake of the Lower Doce River Valley – LDRV (Linhares, ES, Brazil)
(Figure 1). Regional geomorphology is characterized
by alluvial plain, coastal plains and plateaus. The plateaus of Barreiras Formation (Tertiary period)
are desiccated by alluvial valleys dammed by
deposition of fluvial sediments, including material
deposited by Doce River (Martin et al. 1996). Recently, evidences of neotectonics have been found with fractures and faults controlling the regional geomorphology of Barreiras Formation with NW-SE orientation of hydrographic network (Hatushika et al. 2007, Bricalli and Mello 2013).
Regional climate is characterized with warm and wet summers and dry and cool winters, with mean annual air temperatures and rainfall of 24.8 °C and 1,177.1 mm, respectively. Mean rainfall for warm and wet and dry and cool seasons are 220.2 and 48.4 mm, respectively (F.A. Mello, unpublished data).
In contrast to the neighboring Lakes Juparanã,
Palmas, Palminhas and Terra alta, there is no fish farming operation (floating cages) in Lake Nova.
Major water uses are related to recreational, unreg-ulated water abstraction for irrigation, and boating.
LAke SurfAceAnd WAterShed dAtA
A geographic information system (GIS) was developed to handle hydrographic and watershed
data with ArcGIS 10.1 ESRI® and Universal
Transverse Mercator - UTM and datum World
BAthymetric Survey
Bathymetric survey was carried out in July 2011
with an Ohmex SonarMite BT and DGPS Trimble GeoXH with a real time correction with a Trimble
Geobeacon on a grid with transversal tracks of 300 m distance along the lake axis. Navigation on the sampling grid was oriented with GPS
Trimble Juno receiver with arcPad 7.0 ESRi®
. Navigation speed was under 5 km/h (2.7 knots).
XYZ data with Easting and Northing coordinates
and depth (m), respectively, were converted to a
point shapefile, and then edited to remove spike
data. Lake shoreline polygon was converted to a
point file and each point was assigned as 0 m depth. This file was later merged with the hydrographic survey points file. Simple kriging was applied to
the point data as an interpolation method using
Geostatistical Analyst 10.1 (ArcGIS 10.1, ESRI®). Semivariogram modeling, bivariate distribution and cross validation done according to Isaks and Srivastava (1989) and Burrough and MacDonnel
(1998). a triangular irregular network – TiN model
was generated from the lake bathymetric map in order to allow computation of size and special morphometry parameters.
LAke BASin morphometry
The accuracy of bathymetric map was evaluated according to Håkanson (2004). The ratio of the lake
area (km2) and the total distance traveled in transects
(km) defines the intensity of the bathymetric survey
(Lr). The accuracy of the bathymetric map was assessed with the Information Value (I), which is completely correct when I = 1. In order to determine
(I’) and the Information Number (I”). The latter is
dependent from the number of contour lines in the bathymetric map. Assessment of I, I’ and I” were according to:
I = I’*I’’
I’ = [A-0.14*Lr*Ld2*(1/(n+2))0.5*Σ√Ai]/A
I’’ =(e0.4π -1)/(e0.4π +0.02)
where:
A = lake area (km2)
Ai= cumulative area (km2) within the limits of an specific contour line;
Lr = ratio between lake area (A in km2) and the effective total distance
surveyed (km) (Lr = A/∑Li);
Ld = normalized lake shore development;
DL = shoreline development index (DL = {L0 / [2*(√π*A)]});
e = the base for natural logarithm, e = 2.718.
Lake size, form and special factors were calculated according to Håkanson (2004). Symbols for morphometric parameters were according to Hutchinson (1957). Lake size factors, such as lake area (A), shoreline length (L0), maximum length (Lmax), maximum breadth (Bmax), maximum depth (Zmax) were calculated from bathymetric data. Volume (V) was calculated with Functional Surface of ArcGIS 10.1, ESRI® 3D analyst Tools, and the
TiN model. Lake form factors were calculated
for mean depth (Zmv = V/A), relative depth (Zr = {50*Zmax*[(√π)/(√A)]}), shoreline development
index (DL = {L0 / [2*(√π*A)]}), volume
development index (Vd = [(3Zmv) / Zmax]) and mean slope (Smv) according to Smv = {(L0 + 2*Lctot)*Zmax/ [(2*n*A)]}
where,
L0 = the shoreline length in km;
Lctot = the total length for all contour lines in km excluding the shoreline;
Zmax = the maximum depth in m;
n = the number of contour lines;
A = the lake water surface area in km2.
The A:V and Zmv:Zmax ratios were calculated
ac-cording to Hutchinson (1957) The ratio of lake area
to volume (A:V) provides an indication of potential evaporation and thermal stability of water column, while the Zmv:Zmaxratio describes the basin shape
(Hutchinson 1957). The ratio between watershed
area (WA) and lake surface area (A) was calculated. Among special morphometric factors wave base depth (Zwb), effective fetch (Lef), wave height (H), volumes of epilimnion (Vep), littoral (Vlitt), pelagic (Vpel), hypoxic (Vhypox) and anoxic
zones (Vanox), as well as the Index of Basin
Permanence (iBP) (Kerekes 1977) and dynamic
ratio (DR) (Håkanson 2004) were calculated. Zwb
was determined according to Zwb= [45.7*(√A)/ (21.4+√A)]. To calculate Lef and H for NE (wet and warm season) and SE (dry and cool season) winds a grid of 112 points with a regular distance of 400 m was set on a lake surface polygon GIS layer. Lef in each site was calculated based on fetch distances from lake shores considering the predominant wind (0°) and every 6°, up to 42°, for both sides of the predominant wind. Distances were integrated according to Beach Erosion Board (1972 in Håkanson 2004) Lef = {Σxicos(ai)/ [(Σcos(ai))*SC’]}, where Σcos(ai) = 13, a = calculation constant, and SC’ = scale constant. In this study a scale constant, based on a map with scale of 1:30,000, was 0.3. Wave height (H) were calculated with Lef on each of the 112 points based on H = (0.105 * √F (cm), where F is fetch. Surface models for NE and SE Lef (km) and H (m) were interpolated in ArcGIS 10.1 using Spline with 0.01 weight, 3 neighborhood points, and cell size of 10.
0.2 mg dissolved oxygen.L-1) were based on the depth of water column vertical profiling in the wet and warm season. Cryptic depth (Zc), which is the depth below mean sea level, and volume were calculated considering the elevation of lake surface above sea level. All volumes were determined with
arcGiS 3D analyst Tools routines.
The index of Basin Permanence – iBP (Kerekes
1977) in m3.km-1, which indicate the influence of
littoral zone on lake volume, was calculated with the ratio of lake volume (x 106.m3) and lake shoreline length (km) (IBP = V/L0). The dynamic ratio – DR,
which indicate the influence of turbulence and resuspension of sediments due to wind and waves processes was calculated according to DR = (Håkanson 2004).
Lake water theoretical retention time (RT) was determined from the ratio of lake volume in m3 by the mean annual flow (Qmean) in m3.s-1 of the three tributary streams (Figure 3), RT = V/Qmean. Qmean was determined from in situ discharge measurements (N=24) during wet (November/December/2012 and March/2013) and dry (August/2011, September/2012 and July/August/September/2013)
seasons with an YSi Sontek FlowTracker Handheld
– Acoustic Doppler Velocimeter (ADV).
WAter coLumn Structure
Forty-four profiles of temperature and dissolved
oxygen and Secchi disk depths were recorded on four lake sampling sites on eleven sampling events during warm/wet (December/2011, January/March/ November/December/2012 and March/2013) and dry/cool (July/2011, July/2012, July/August/ September/2013) seasons.
During warm/wet and dry/cool seasons lake samplings were carried out in 4 sampling sites
along Lake Nova axis (Figure 3). Vertical profiling
for temperature (°C) and dissolved oxygen (mg.L-1)
were recorded with a Horiba U-53G with 30 m cable water quality probe. Mixing depth (Zmix) was determined considering the maximum discontinuity
of water column relative thermal resistance (RTR) (Dadon 1995).
Thermal resistance of water column was
calculated for each sampling site and sampling
event using Wedderburn (W) number according
to Imberger and Hamblin (1982) and Reynolds (2006). Wind data was acquired from Linhares meteorological station (A614) based on hourly records from 2007 to 2009 (Barroso et al. 2014). W
was calculated according to:
W = {[Drω ∗g*(hm)2] / [rω ∗(u*)* L]0.5}
where:
Drω = difference of specific water mass from the upper and lower layers of thermocline in kg.m-3; hm = thermocline depth in m;
L= effective fetch in m;
u*= wind friction velocity according:
u* = √ρair /ρsur * Cd * u 2
where:
rair: air specific mass in kg.m-3;
rsur: specific water mass at lake surface in kg.m-3;
Cd: friction coefficient = 0.0014; u: wind speed in m.s-1.
When, W > 1 water column is stable and when
W < 1 water column is unstable and susceptible to mixing by wind forces.
Water transparency was determined with a Secchi disk and the extension of euphotic zone (Zeu) determined with an underwater light meter system LiCor LI-250A with a LI-193 spherical
quantum sensor (μmol s-1
.m-2). Light limitation for phytoplankton photosynthesis was determined with
Zeu:Zmix ratio (Jensen et al. 1994, Naselli-Flores 2000).
reSULtS
BAthymetric mAp
131.7 km as a total distance navigated. The intensity
of hydrographic survey (Lr) was 0.11 km, which is suitable for relative small size lakes.
The resulting bathymetric map produced on
1:60,000 with a spatial resolution of 22.6 m is shown on Figures 2 and 3.
The overall map accuracy based on an
Information Value (I) of 0.8 was calculated
considering a Correctly identifi ed area (I’) of 0.9 and an Information Number (I”) of 0.9. That means
with a 5 m interval of contours lines the percentage
of Correctly identifi ed area was 88%, with an error
of 12 % or 1.8 km2.
LAke SiZeAnd form
Lake Nova lies 22 m above mean sea level and has a surface area (A) of 15.5 km2, maximum depth (Zmax) of 33.9 m and a volume (V) of 0.23 km3 (2.28 x 10⁸ m3) (Table i). The lake basin is subretangular
elongated and slightly dendritic oriented N-S, with
three infl ections towards SE. Three tributary streams
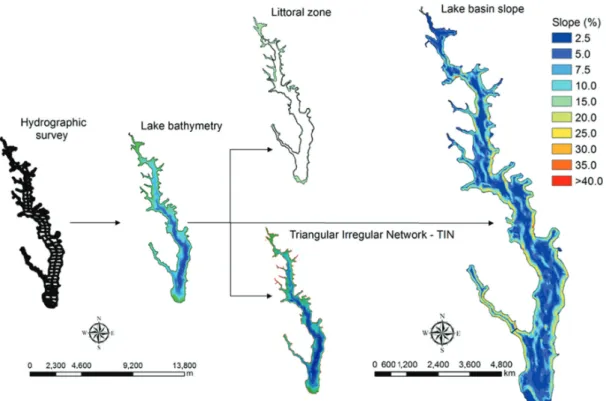
on the upper part of the basin feeds the lake, which has a drainage stream at the southernmost shore. Figure 2 show the sequence of generating the main cartographic products, from depth data points, the bathymetric model, the triangular irregular network
– TiN, and the bottom slope (%).
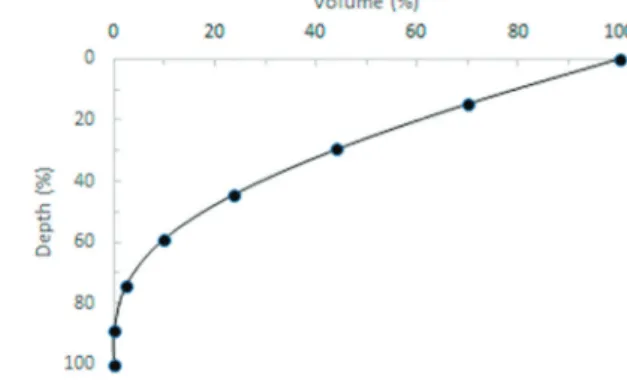
Hypsographic curves show the distribution of
area and volume with lake depth. The relative deep
and elongated shape of lake basin is described by
area and volume curves showing a single infl ection
point and a slightly convex (SCx) form (Figure 4).
The basin shape can be described by steep
shores showing rapid decrease of lake volume and a milder decrease of surface area for increasing
depths close to the surface. This shape is also
supported with high values of relative depth (Zr), and volume development index (Vd) (Table i).
Figure 3 - Bathymetric map of Lake Nova draped on an aerial photography and showing lake and fluvial sampling sites.
taBLe i
Lake Nova size and form factors.
Lake A L0 Lmax Bmax Zmax V Zmv Zr DL Vd Smv
Nova (km2
) (km) (km) (km) (m) (km3
) (m) (%) (%)
15.5 70.4 15.7 (S-N)
2.4 (E-W)
33.9 0.23 14.7 0.7 5.0 1.3 3.2
Alongside lake N-S axis there are 13 indentation with depths up to 5 m, with the exception of SW embayment in lower section of lake, which is 3.6 km long and has depths up to 20 m. In the riverine
influence zone, located at the northernmost section
of the lake, depths are limited to 5 m. Shallow areas are also located in the southern shore, with bottom depths shallower than 2 m colonized by aquatic grass. Deep basins (> 20 m) are delimited by 20 m depth curve beginning from the second shoreline
inflection, while the 30 m depth contour begins from the third inflection and extends up to 1.5 km
to the South shore.
The moderate mean slope (Smv), 3.2%, indicate a smooth topography, although in the slope map (Figure 2) steep slopes, up to 42%, can be observed along parts of the shore with hills of Barreiras plateaus (~60 m) to the lake surface (22 m). While overall smooth slope, Lake Nova basin can be considered as relative deep according to Zr of 0.7%,
A/V ratio of 0.06, Zmax 2.3 times Zmv and Zmv:Zmaxratio of 0.4 that indicate a paraboloid bottom contour.
LAke SpeciAL fActorS
The slight convex hypsographic volume curve
(Figure 4) show that about 76% (1.74 x 10⁸ m3) of lake volume is within the first 10 m of depth,
while less than 10% (0.49 x 10⁸ m3) is below 20 m. Considering that lake surface is at 22 m above sea level and Zmax is 33.9 m, lake cryptic depth (Zc)
is 11.9 m, thus cryptic volume (Vc) correspond to 64% (1.47 x 10⁸ m3) of lake volume.
Wind regime is characterized by wet/warm period associated with NE winds, while dry/cool period is related to S-SE winds from cold fronts, blowing up to 11.1 m/s (Figures 5a and 5b). Wind effects on lake surface was estimated based on effective fetch (Lef), which varied from 0.01 to 0.6 km for NE winds and 0.01 to 0.5 km for SE winds.
The Lef model for NE wind show higher influence
on SW lake shores (Figure 5c), while during cold
fronts, SE wind, most influenced areas lies between the second and third shoreline inflection and at the
entrance of the SW embayment (Figure 5d). Wave height pattern follow the same patterns (Figures 5e and 5f) with heights up to 0.5 to 0.8 m for NE and SE winds, respectively.
The estimate of wave base depth (Zwb) is 6.9 m.
The dynamic ratio (DR) yield 0.2, which accord-ing to Håkanson (2004) implies that about 15% of lake area is subjected to slope process with
shore-line erosion and transport. The index of Basin Per -manence – IBP of 3.2 m3.km-1 indicates that Lake Nova is less willing to develop a littoral zone with rooted aquatic vegetation. Based on Zeu of 9 m the area of littoral zone is 4 km2 or 26% of lake area,
while pelagic area make 11.5 km2 or 74% (Figure
2). The volume of littoral zone (Vlit) is 4.5% (0.101 x 10⁸ m3) while the pelagic volume (Vpel) holds 95.5% (2.18 x 10⁸ m3) of the total lake volume.
Lake Nova watershed drains an area (WA) of 394.6 km2, which may imply in significant inputs of nutrients to the lake, considering the relative high WA:A ratio of 25.8 and watershed land use. The
mean annual discharge of the three tributary rivers is 0.5 m3.s-1, consequently the theoretical retention time (RT) of lake volume is 13.4 years. If mean dis-charges for dry/cool (0.5 m3.s-1) and wet/warm (0.6 m3.s-1) seasons were considered, RT would increase and decrease to 14.7 and 11.8 years, respectively.
WAter coLumn Structure
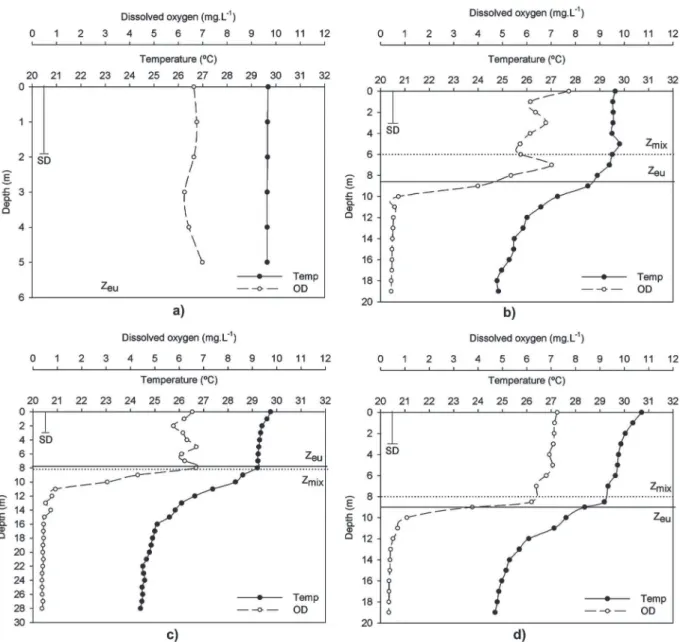
Water column remain stratified during the wet and
warm season at sample sites 2, 3 and 4, with a temperature difference from surface to bottom up to 6 °C and mean thermal stability measured with a mean Wedderburn number of 3.5 ± 1.6 (Figure 6
and Table ii). Under this condition mean Zmix was 7 ± 3.4 m, which is very close to the depth of wave base (Zwb), 6.9 m, indicating the extension of water
column subject to wave turbulence and sediments resuspension. Considering the mean Zmix and Zwb the volume of epilimnetic waters (Vep) contain 59% of lake volume (1.35 x 10⁸ m3), while bottom volume
hold the other 41% (0.93 x 10⁸ m3).
During wet and warm season the mean euphotic zone, delimited by 1% of subsurface light (Zeu reaches 9 m depth) yielding an euphotic volume (Veu) of 51% of lake volume (1.17 x 10⁸ m3), while the other 49% (1.06 x 10⁸ m3) holds the aphotic volume. For this season Zeu:Zmix ratio was 1.3, while in the dry and cool season, when
eventual stratification is weaker, yields only 0.6. That implies in light limitation for phytoplankton
primary productivity during the later season, as phytoplankton can be trapped in the dark.
Profiles of dissolved oxygen during wet and
warm season show a clear trend to hypoxic (< 2.0 mg.l-1) and anoxic bottom waters, with the decline of dissolved oxygen at the end of thermocline, 13 m depth. Considering this depth 35% of lake volume (0.8 x 10⁸ m3) can be considered as poor or depleted in dissolved oxygen.
Throughout dry and cool season temperature profiles have shown low variability with Wedder -burn number yielding zero value indicating mixing
conditions (Table ii and Figure 7). Dissolved oxy
-gen profiles shown slight stratification but without
bottom hypoxia.
Sampling site 1, which lies under the fluvial
influence of River Bananal, the main tributary for Lake Nova, have shown through both seasons mixed water column (Wedderburn number = 0).
Homogeneous dissolved oxygen profiles and Zeu
extending to lake bottom were also registered throughout the sampling seasons.
DiScUSSioN
Deep tropical lakes show a trend of monomictic and amictic mixing patterns (Lewis 1983). Although Brazilian natural lakes are usually shallow systems, some lakes in the Doce River Valley – DRV, such as Lake Dom Helvécio (Bezerra-Neto and Pinto-Coelho 2008), Lake Palminhas (Barroso et al. 2012), and Lake Palmas (Barroso et al. 2014) are deep (< 50 m depth), showing a monomictic mixing pattern, which also match Lake Nova pattern.
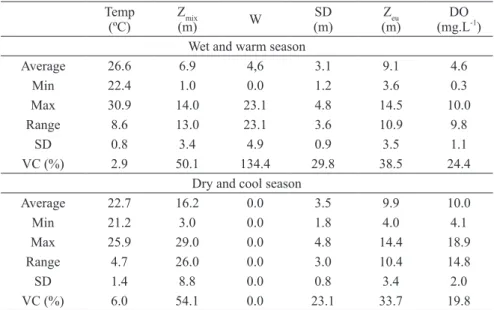
taBLe ii
Descriptive statistics for physical and physic-chemical variables in water column. Temp
(ºC)
Zmix
(m) W
SD (m)
Zeu (m)
DO (mg.L-1
) Wet and warm season
Average 26.6 6.9 4,6 3.1 9.1 4.6
Min 22.4 1.0 0.0 1.2 3.6 0.3
Max 30.9 14.0 23.1 4.8 14.5 10.0
Range 8.6 13.0 23.1 3.6 10.9 9.8
SD 0.8 3.4 4.9 0.9 3.5 1.1
VC (%) 2.9 50.1 134.4 29.8 38.5 24.4
Dry and cool season
Average 22.7 16.2 0.0 3.5 9.9 10.0
Min 21.2 3.0 0.0 1.8 4.0 4.1
Max 25.9 29.0 0.0 4.8 14.4 18.9
Range 4.7 26.0 0.0 3.0 10.4 14.8
SD 1.4 8.8 0.0 0.8 3.4 2.0
VC (%) 6.0 54.1 0.0 23.1 33.7 19.8
Temp: temperature; Zmix: mixing depth; W: Wedderburn number; SD: Secchi disk in m; Zeu:
The subretangular elongated shape, N-S ori -ented, slightly dendritic with several indentations, and a slight linear bottom hypsography with
mod-erate slope is in accordance to its fluvial and ne -otectonic genesis of alluvial lakes in the LDRV.
The former process is related with the damming of
River Bananal (Martin et al. 1996), while the later may explain the overdeepened valley, such as the case of Lakes Palmas and Nova, which may be
as-sociated with tectonic faults (Hatushika et al. 2007, Bricalli and Mello 2013). Among shape morpho-metric factors, DL of 5.0 for Lake Nova is in the
in-termediate range for the LDRV lakes such as Terra
Alta, Juparanã, Palmas and Palminhas, with 3.1, 3.9, 4.3 and 8.1, respectively (Barroso et al. 2012).
The values of Zmax (33.9 m) and Zmv (14.7) of
Lake Nova are significant high in relation to other
Brazilian lakes. Among 61 coastal lakes of Rio
Figure 7 - Vertical profiles of temperature (°C) and dissolved oxygen (mg.L-1
Grande do Sul State, South of Brazil, the deepest two lakes shown Zmax of 11 m. Comparing with the two deepest natural lake in Brazil, Lake Palmas (Zmax of 50.7 m and Zmv of 21.4 m) at the LDRV (Barroso et al. 2014), and Lake Dom Helvécio (Zmax of 39.3 m and Zmv of 11.3 m) at the MDRV (Bezerra-Neto and Pinto-Coelho 2008), Lake Nova can be considered the third in Zmax, but the second one considering Zmv. This is also valid considering lake volumes. The significant Zc and the high Vcare related with the lake geomorphology, which was
associated with fluvio-marine processes (Martin et
al. 1996).
Hypsographic curves with a linear shape for area and slightly convex for volume, likewise moderate Zr, Vd, Zmv:Zmax, IBP and DR, low A/V
ratio, and Zmax 2.3 times Zmv describe a relative deep basin with paraboloid bottom contour. As a result, the basin has a relative small littoral zone, with 26% of lake area corresponding to only 4% of lake volume.
Moderate steep shores of Barreiras plateau, as indicated by paraboloid bottom contour, may overcome turbulence process by wind and wave, prevailing process of erosion and transport of sediments. As overall indicator of sediment resuspension Zwb of (6.9 m) prevent turbulence on sediments, reducing turbidity and improving water clarity in great part of Lake Nova (mean Secchi
disk depths of 3.1 ± 0.9 m). The effective fetch (Lef) is higher for cold front winds, blowing from S-SE.
Under this condition the most influenced section is between the second and third lake axis inflections.
As this area is deep with steep shores, sediments resuspension does not occur.
The relative deep basin with limited littoral
effects on basin volume complies with thermal stability of water column, as it has been shown with
thermal profiles during the wet and warm season.
Even though high Lef for this season, predominant NE wind work was not effective to promote a deep turbulence in water column. Wedderburn numbers,
calculated for each sampling site at every sampling event, were very high during warm and wet season, indicating a strong resistance to mixing. Under these conditions Zwb, as an indicator to distinguish surface waters from deep waters, corresponds to
Zmix. Consequently, about 41% of lake volume in the mixing layer receives most of thermal energy.
The riverine zone of the main tributary (River
Bananal, sampling site 1), is completely distinct
form sampling sites 2, 3 and 4. The shallow area
(< 3.0 m) is subject to turbulence of wind and
fluvial flow, therefore water column stratification
and hypoxia seldom occur at this part of the lake, which can be regarded as a riverine zone according
to the concept of longitudinal zonation (Kimmel
et al. 1990). Sampling sites 2 to 4 are related to a lacustrine zone, where thermal stratification occurs. In this zone thermal and density gradients along water column control the distribution of
chemical compounds. The extent and duration of water column stratification is a seasonal process
related to climate.
Chemical stratification is also a common
feature for the stratified condition in Lake Nova.
Hypoxic/anoxic conditions start at the end of thermocline, at the depth of 13 m, representing
up to 35% of lake volume. This implies into a key
process of solubility of nutrients form sediment porewater to hypolimninetic waters (Cole 1994, Wetzel 2001, Conley et al. 2009). Although water
column stratification is characteristic of the wet and
warm summer season it may last for the transition
seasons of autumn and spring. Therefore, areal
hypolimnetic oxygen deficit may become a key control for nutrient internal loading to Lake Nova.
During dry and cool season water column is unstable with lake mixing as a consequence of atmosphere cooling and increasing incidence of cold fronts with S-SE winds, which causes high Lefand wave height (H). The homogeneous water column
owing to oxidizing surface sediments porewater (Mortimer 1971, Conley et al. 2009).
Regarding the influence of drainage basin on
Lake Nova, the ratio WA:A of 25.8 is relative high compared to other LDRV Lakes such as Palminhas
(8) and Palmas (18), but lower in contrast to Terra
Alta (37) and Juparanã (39) (Barroso et al. 2012).
This has major implications on lake structure and functioning, mainly in relation to fluvial tributary
inputs of water and dissolved and suspended materials.
Higher WA:A ratios imply in higher fluvial inputs, so lake water tend to be rich in nutrients and organic matter, with high pH, conductivity and alkalinity (Nõges 2009). However, in deep basin lakes with longer retention time, chlorophyll
content is lower and water clarity is higher. This
seems to be the case of Lake Nova in which mean chlorophyll a is very low, < 1.0 µg L-1according to Bozelli et al. (1992) and 1.5 ± 0.7 µg L-1 according to M.A. Gonçalves (unpublished data).
The oligotrophic status can be a consequence of
nutrients trapped in hypolimnetic waters, and phytoplankton light limitation during the mixing season, when Zeu:Zmix< 1.0.
Watershed hydrology also influences lake longitudinal zonation with river discharge in the lake controlling water retention time (Ambrosetti et al. 2003, Nõges et al. 2011). With a mean annual
fluvial input of 0.5 m3
.s-1 Lake Nova theoretical
retention time (RT) is estimated in 13.4 years. This seems to be a long RT compared with the average
of 5.5 ± 17.9 years for 310 European lakes (Nõges
2009). Even large lakes may show short RT, such
as Lake Maggiore (A = 212.5 km2, Zmax = 370 m; Zmv = 177 m, V = 37.1 km3 and W
A:A ratio of 31.1), a subalpine lake between Italy/Switzerland, has a
RT of only 4 years (ambrosetti et al. 2003). in the case of Lake Nova it appears that the long RT is due
to low hydrological input by the tributary rivers. Although Lake Nova watershed can be considered a well drained basin (drainage density
of 1.5 km.km-2), the intensive water and land use may exert significant controls on fluvial inputs. According to Barroso and Mello (2013) about 70% of lake watershed is composed by seminatural systems (i.e., pastureland, cropland and forestry). Besides the intensive land use 44 impoundments
(0.3 km2 of impoundments), most of them for
irrigation uses, are located in the Lake Nova watershed.
Therefore, the compromised natural vegetation
buffer of rivers and lake in addition to the river network fragmentation and regularization can drive hydrological changes in quantity, quality and timing
of fluvial inputs, which in turn reduce lake flushing
capacity and increase physical and chemical lake
stratification. This scenario of environmental
changes may be chiefly severe under extreme hydrological events.
coNcLUSioNS
Lake Nova basin is a subrectangular elongated and
relatively deep, with limited littoral influence on
pelagic processes. Based on mean depth (Zmv) Lake Nova can be considered the second deepest natural
lake in Brazil. The deep tropical basin promote
water column thermal stability with a warm monomictic mixing pattern with stratification on warm and wet season and mixing during dry
and cool season. This pattern is in agreement of
other deep tropical Brazilian lakes. During the
stratification season bottom waters become hypoxic and anoxic, holding up to 1/3 of lake volume. The
effect of wind work is restricted to eplimnetic layer
depth, which was estimated with thermal profiles
and wave base depths. Water column turbulence related to sediment resuspension is limited. Lake Nova water clarity promotes penetration of photosynthetic active radiation in the water column, with half of lake volume within the euphotic zone. However, during the dry and cool season, when
depths can be deeper than the euphotic layer, thus phytoplankton can be limited by light availability.
The relative long theoretical retention time of
13.4 years and the relative deep basin, although intensive land and water uses in watershed, may induce environmental chances in terms of
hydrological flows to the lake, thus increasing its
retention time.
reFereNceS
aMBROSETTi W, BaRBaNTi L aND SaLa N. 2003. Residence time and physical processes in lakes. J Limnol 62(1): 1-15.
BaRBOSa FaR, LOVaTO MB, NaSCiMENTO aMa, Maia-BaRBOSa PM, MONTE-MOR RL, PaGLia a aND STEHMaNN JR. 2013. Dinâmica Biológica e Conservação da Biodiversidade da Mata atlântica do Médio Rio Doce, MG (PELD/UFMG). in: Tabarelli M, Rocha CFD, Romanowski HP, Rocha O and Lacerda LD (Eds), PELD – CNPq: dez anos do Programa de Pesquisas Ecológicas de Longa Duração do Brasil: achados, lições e perspectivas. Recife: Ed. Universitária da UFPE, 446 p. BARROSO GF. 2007. Lagoas costeiras do Espírito Santo:
perspectivas para conservação. Menezes LFT, Pires FR and Pereira OJ (Eds), Ecossistemas costeiros do Espírito Santo: conservação e restauração. Vitória, EDUFES, p. 71-86.
BaRROSO GF, GaRCia FC, GONÇaLVES Ma, MaRTiNS FCO, VENTURiNi JC, SaBaDiNi SC, aZEVEDO aK, FREiTaS aCT, DELaZaRi-BaRROSO a aND BERTOLDi L. 2012. Estudos integrados no sistema lacustre do Baixo Rio Doce (Espírito Santo). In I Seminário Nacional de Gestão Sustentável de Ecossistemas Aquáticos: Complexidade, Interatividade e Ecodesenvolvimento, COPPE/UFRJ.
BARROSO GF, GONçALVES MA AND GARCIA FC. 2014. The Morphometry of Lake Palmas, a Deep Natural Lake in Brazil. PLoS One 9(11): e111469.
BARROSO GF AND MELLO FA. 2013. Compartimentação da paisagem e indicadores de pressões ambientais em ecossistemas lacustres e fluviais na região do Baixo Rio Doce (ES). anais do XV Simpósio Brasileiro de Geografia Física Aplicada. Vitória, UFES, p. 158-165. Available at http://www.xvsbgfa2013.com.br/anais/.
BEZERRa-NETO JF aND PiNTO-COELHO RM. 2008. Morphometric study of lake Dom Helvécio, Parque Estadual do Rio Doce (PERD), Minas Gerais, Brazil: a re-evaluation. Acta Limnol Bras 20(2): 161-167.
BOZELLi RL, ESTEVES Fa, ROLaND F aND SUZUKi MS. 1992. Padrões de funcionamento das lagoas do Baixo
Rio Doce: variáveis abióticas e clorofila a (Espírito Santo – Brasil). Acta Limnol Bras 4: 13-21.
BRICALLI LL AND MELLO CL. 2013. Padrões de lineamentos relacionados a litoestrutura e faturamento neotectônico (Estado do Espírito Santo, SE do Brasil). Rev Bras de Geom 14: 301-311.
BURROUGH PA AND MACDONNELL RA. 1998. Principles of geographical informations systems. Oxford, Oxford University Press, 333 p.
COLE Ga. 1994. Textbook of Limnology. 4th
ed., Prospect Heights, Illinois: Waveland Press, 412 p.
CONLEY DJ, CaRSTENSEN J, VaQUER-SUNYER R aND DUaRTE CM. 2009. Ecosystem thresholds with hypoxia. Hydrobiologia 629(1): 21-29.
DADON JR. 1995. Calor y temperatura em cuerpos lenticos. in: Lopretto EC and Tell G. Ecosistemas de aguas continentales: metodologias para su estúdio. La Plata, Ediciones SUR 1: 47-56.
HÅKaNSON L. 2004. Lakes: form and function. Cladwell, The Blackburn Press, 201 p.
HÅKaNSON L. 2005. The importance of lake morphometry and catchment characteristics in limnology – ranking based on statistical analyses. Hydrobiologia 541(1): 117-137. HaTUSHiKa RS, SiLVa CG aND MELLO CM. 2007.
Sismoestratigrafia de alta resolução no lago Juparanã, Linhares (ES-Brasil) como base para estudos sobre a sedimentação e tectônica quaternária. Rev Bras Geof 25(4): 433-442.
HENRY R, PONTES MCF aND TUNDiSi JG. 1989. O déficit de oxigênio no Lago Dom Helvécio (Parque Estadual do Rio Doce, Minas Gerais). Braz J Biol 49(1): 251-260. HUTCHiNSON GE. 1957. a treatise on limnology. Volume i:
Geography, physics and chemistry. New York, J Wiley & Sons, Inc., 115 p.
IMBERGER J AND HAMBLING PF. 1982. Dynamics of lakes, reservoirs and cooling ponds. Annu Rev Fluid Mech 14: 153-187.
iSaKS EH aND SRiVaSTaVa RM. 1989. applied geostatistics. Oxford, Oxford University Press, 561 p. JENSEN P, JEPPESEN E, OLRiK K aND KRiSTENSEN K.
1994. Impact of nutrients and physical factors on the shift from cyanobacterial to chlorophyte dominance in shallow Danish lakes. Can J Fish Aquat Sci 51: 1692-1699. KEREKES J. 1977. The index of lake basin permanence.
Intern. Revue Hydrobiol Hydrogr 62(2): 291-293. KiMMEL BL, LiND OT aND PaULSON LJ. 1990. Reservoir
primary production. in: Thornton KW, Kimmel BL and Payne FE (Eds), Reservoir Limnology: Ecological Perspectives. New York: J Wiley & Sons, inc., 245 p. LEWIS WM. 1983. A revised classification lakes based on
mixing. Can J Fish Aquat Sci 40: 1779-1787.
part of the state of Espírito Santo (Brazil). An Acad Bras Cienc68: 389-404.
MORTiMER CH. 1971. Chemical exchanges between sediments and water in the Great Lakes – speculations on probable regulatory mechanisms. Limnol Oceanogr 16: 387-404.
NASELLI-FLORES L. 2000. Phytoplankton assemblages in twenty-one sicilian reservoirs: relationships between species composition and environmental factors. Hydrobiologia 424: 1-11.
NÕGES T. 2009. Relationships between morphometry, geographic location and water quality parameters of European lakes. Hydrobiologia 633: 33-43.
NÕGES P, NÕGES T, GHiaNi M, PaRaCCHiNi B, GRANDE JP AND SENA F. 2011. Morphometry and trophic state modify the thermal response of lakes to meteorological forcing. Hydrobiologia 667: 241-254. REYNOLDS CS. 2006. The Ecology of Phytoplankton
(Ecology, Biodiversity and Conservation).Cambridge University Press, Cambridge, 537 p.
SCHWARZBOLD A AND SCHÄFER A. 1984. Gênese e morfologia das lagoas costeiras do Rio Grande do Sul – Brasil. Amazoniana 9(1): 87-104.