NUMERICAL INVESTIGATION OF TIME-DEPENDENT CLOUD
CAVITATING FLOW AROUND A HYDROFOIL
by
De-Sheng ZHANG *, Guan-Gjian ZHANG, Hai-Yu WANG, and Wei-Dong SHI Re search Cen ter of Fluid Ma chin ery En gi neer ing and Tech nol ogy, Jiangsu Uni ver sity,
Zhenjiang, China
Orig i nal sci en tific pa per DOI: 10.2298/TSCI1603913Z
Timede pend ent cloud cav i ta tion around the 2D ClarkY hy dro foil was in ves ti gated in this pa per based on an im proved fil ter based model and a den sity cor rec -tion method. The fil ter-scale in fil ter based model sim u la -tion was dis cussed and val i dated ac cord ing to the grid size. Nu mer i cal re sults show that in the tran si tion from sheet cav i ta tion to cloud cav i ta tion, the sheet cav ity grows slowly to the max i -mum length dur ing the re-en trant jet de vel ops. The mild shed ding bub ble clus ter con vects down wards the hy dro foil and con tin ues to grow up af ter de tach ing from the suc tion sur face of hy dro foil, and a bub ble clus ter in tro duced at the rear part of hy dro foil. While the sheet cav ity gen er ates, the bub ble clus ter break ups.
Key words: sheet cavitation, cloud cavitation, hydrofoil, filter based model, density correction method
In tro duc tion
Cav i ta tion is more like a pro tec tive mech a nism of liq uid, pre vent ing lo cal pres sure from drop ping be low the va por iza tion pres sure of the liq uid. Early re searches on cav i ta tion mainly fo cused on op er a tional and de sign is sues in the mar i time and hy drau lic en gi neer ing fields [1, 2]. In re cent de cades, a broader range of top ics have been brought in. Cav i ta tion in hy drau lic ma chines of ten re sults in ero sion dam age, tran sient loads, vi bra tion, noise, and per for -mance de crease by highly un sta ble be hav ior of gas-liq uid two-phases flow [2-4].
Cav i ta tion model most com monly used now a days is based on the con sump tion that the mix ture of liq uid and va por phase can be con sid ered as one, which means that two phases share the same ve loc ity and no slip ve loc ity ex ists be tween the two phases. Coutier-Delgosha et al. [5, 6] as sume that barotropic state law gov erns mix ture den sity, but this may ne glect vorticity gen er a tion which is cru cial for the highly un sta ble cav i ta tion flow [7, 8]. An other cat e gory of cav i -ta tion mod els is based on the first or der sim pli fied Ray leigh-Plesset equa tions, from which interphase mass trans fer term be tween gas and liq uid [9-12] is de duced. Morgut and Nobile [13] cal i brated the em pir i cal co ef fi cients in Kunz, Zwart, and Singhal cav i ta tion model [9-11], us ing an op ti mi za tion strat egy for a bal ance of ac cu racy and sta bil ity.
The ob jec tive of this pa per is to con struct an im proved fil ter based model (FBM) tur -bu lence model on the ba sis of ran dom num ber gen er a tor (RNG) k-e tur bu lence model, cou pled
with den sity cor rec tion method, and em ploy it in the study of time-de pend ent cavitating from sheet cav i ta tion to cloud cav i ta tion around the 2-D Clark-Y hy dro foil.
Im proved FBM tur bu lence model
In spired by the orig i nal idea of FBM model, FBM model based on RNG k-e has sim i lar ex pres sions:
m r
e m t
RANS
= = é
ë
ê ù
û ú
C k F F C
l
2
3 10
, min . , D (1)
where C3 = 1.0. In small tur bu lence scale re gion, tur bu lence vis cos ity mt = Cmrk2/e, and RNG
k-e tur bu lence model is used. In area with large tur bu lence scale, tur bu lence vis cos ity mt = =iCmrDk1/2, which is ac tu ally one-equa tion large eddy sim u la tion (LES) pro posed by Schumann and stud ied by Yoshizawa [2].
The hy brid method for the fil ter func tion, F, and den sity cor rected model (DCM) [5] was added in the ki ne matic eddy vis cos ity equa tion to re duce the tur bu lent eddy vis cos ity and limit the over pre dic tion in the cavitating flow over wall of the hy dro foil and in the wake:
m r e m t MFBM RANS - = = é ë ê ù û ú
C k F F f n C l
2
3
, min ( ), D (2)
f n l n
n l l l ( ) ( ) ( ), = + -+ - =
r a r r
r a r r
v v
v v
10 (3)
It was val i dated that the FBM model can limit the tur bu lent eddy vis cos ity in the cavitating wake of the hy dro foil [5], where the DCM is not ef fec tive in re duc ing the tur bu lent eddy vis cos ity be cause of the high va por frac tion in the shed ding cloud cav ity.
Com pu ta tional do main, mesh ing, and bound ary con di tions
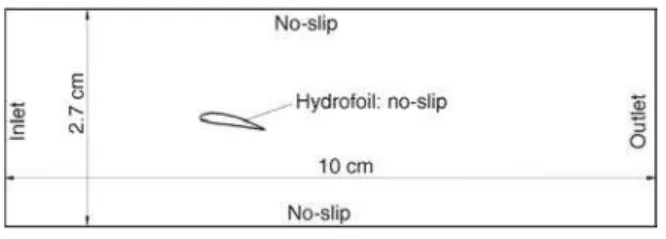
Clark-Y hy dro foil is in ves ti gated in this pa per, and the ex per i ment of this hy dro foil with chord length c = 70 mm, an gle of at tack a = 8°, was con ducted by Wang et al. [14]. The rect an gle com -pu ta tional do main is il lus trated in fig. 1, which is in stalled the same as the ex per -i ment set-up. The lead -ing edge -is set at the orig i nal point of co-or di nates. The dis tant be tween up per wall and bot tom wall is 2.7 cm, out let is 10 cm away from in let and lead ing edge of hy dro foil is 3 cm from in let.
The main bound ary con di tions are set: in let ve loc ity Uin = 10 m/s, cor re spond ing Re = = rLcUin/mL =7·105, low in let tur bu lence in ten sity (1%), pres sure out let. No-slip wall is adopted in the up per and bot tom wall. The out let pres sure is de ter mined by the cav i ta tion num ber. Dur -ing the un steady cal cu la tion, con ver gence in each phys i cal time step was achieved from 4 to 10 it er a tions when the root mean square re sid ual dropped be low 10–5. The un steady sim u la tions used time step Dt = 0.1 ms for the rev o lu tion cal cu la tion. The me dium is wa ter and wa ter va por in 25 °C, cor re spond ing phys i cal char ac ter is tics of wa ter are set: wa ter den sity rL = 998 kg/m3, wa ter dy namic vis cos ity mL = 1.139·10–3 Pa·s, sat u ra tion pres sure of wa ter va por p
sat = 3574 Pa, va por den sity rv = 0.02308 kg/m3, dy namic vis cos ity of va por m
v = 9.8626·10–6 Pa·s.
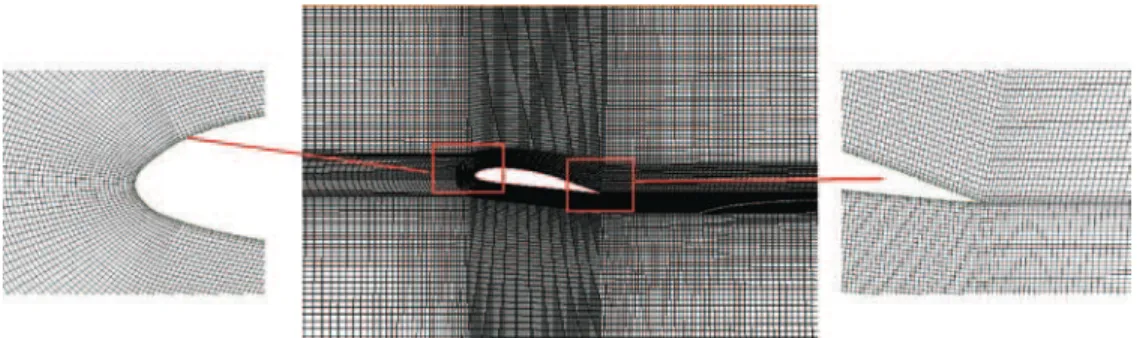
As shown in fig. 2, struc tured grid is es tab lished in the com pu ta tion do main. A C-type block was used around the hy dro foil, con sid er ing the round shape in head of hy dro foil and the sharp rear part. Three grids are gen er ated to eval u ate the grid in de pend ence as shown in tab. 1.
Ta ble 1. Pre dicted cal cu lated by dif fer ent grids
Grid Nods num ber Cpmax CL CD
Coarse 1 30502 1.02 1.200 0.041
Me dium 2 59673 1.11 1.150 0.038
Re fined 3 118321 1.13 1.140 0.038
Ex per i ment [5] – 1.20 1.152 0.037
As shown in tab.1, the me dium den sity grid has nearly the same re sult with fine grid, and con sists with ex per i men tal re sults as well. Con sid er ing the large ve loc ity gra di ent at the head of hy dro foil and the com plex flow in the wake of hy dro foil, mesh is in ten si fied in ar eas pre vi ously men tioned as show in fig. 2. The value of y+ for me dium grid var ies be tween 40~100, with an av er age of 71.
De ter mi na tion of fil ter scale in FBM
The FBM com bines the ad van tages of RANS and LES equa tions, but it re quires a rea -son able fil ter scale, D. When fil ter scale D is very small, FBM is al most one-equa tion LES model, re sult ing in en large grid num ber and com pu ta tional re sources. In or der to ac quire a proper fil ter scale D, we tested 0.7 L, 1.01 L, 2.0 L, 4.0 L, and RANS (in fin ity L) in un steady cav -i ta t-ion s-im u la t-ion around Clark-Y w-ith a cav -i ta t-ion num ber s = 0.8. The mon i tor ing lo ca tion is at the 1.2c down-stream of hy dro foil lead ing edge, shown as the fig. 3. The nu mer i cal re sults show that smaller the fil ter scale be comes the more mas sive bub ble cloud shed ding is ob tained and the in ter face of liq uid and va por tends to be frac tured. How ever, the res o lu tion will not im prove con tin u ously with out a re fined grid. Time av er aged lift and drag co ef fi cients in five cy -cles are pre sented in tab. 2, in which both co ef fi cients are ap proach ing the ex per i men tal re sults. The time-av er age ve loc ity pro file of dif fer ent nu mer i cal sim u la tion model are com pared with the ex per i ment data when the FBM fil ter scale is re duced to 0.70 L, the pre dic tion data tend to be sta ble as shown in fig. 4.
Con se quently, a proper fil ter scale is crit i cal to the pre ci sion of cal cu la tion. A smaller fil ter scale in creases FBM ca pac ity to re solve smaller scale vor tex. How ever, it is not lin ear and also lim ited by the grid scale. Thus, fil ter scale D = 1.01 L was fi nally used in the pres ent study.
Ta ble 2. The av er age lift and drag co ef fi cients com puted with dif fer ent fil ter sizes
RNG k-e 4.0L 2.0L 1.01L 0.70L Ex per i ment [5]
CL 0.693 0.702 0.719 0.735 0.738 0.760
CD 0.109 0.112 0.113 0.115 0.115 0.119
Re sults and dis cus sion
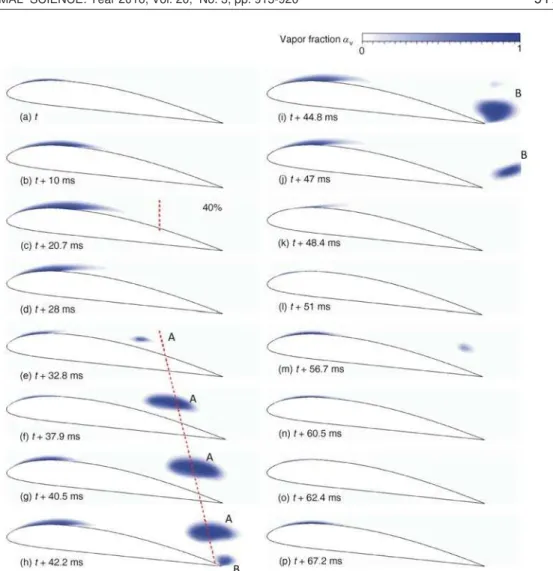
As shown in fig. 5, when cav i ta tion num ber, s, de creases to 1.2, sheet cav ity starts to be un steady. Par tic u larly, mas sive bub ble clus ter sheds from the rear part of clo sure, in di cat ing that cav i ta tion is con vert ing from quasisteady sheet cav i ta tion to quasipe ri odic cloud cav i ta tion. The time av er aged lift and drag co ef fi cients of tran si tion stage are 0.982 and 0.064, re spec tively. The pe riod is ap prox i mately 65.3 ms. The cav ity evo lu tion in one typ i cal pe riod is pre -sented in fig. 5. The time av er aged lift co ef fi cient is 0.982 and drag co ef fi cient is 0.064, with a pe riod time T = 65.3 ms. Cav ity grow slowly in figs. 5(a)-(c) to the max i mum length 0.4 cm and the re-en trant jet de vel ops at the same time. In fig. 5(d), when re-en trant jet is strong enough to force the cav ity back to the head of hy dro foil, pri mary shed ding oc curs. In figs. 5(e)(g), the pri -mary shed ding, A, moves down wards the hy dro foil with a ve loc ity of 2.23 m/s, which is smaller than the main flow ve loc ity 10 m/s. Bub ble clus ter, A, con tin ues to grow up af ter shed ding off and in duces a bub ble clus ter, B, in fig. 5(h), when A passes the trail ing edge of hy dro foil. Sheet cav ity grows up again in fig. 5(i) and shrinks in the fol low ing three fig ures, dur ing which bub ble B ex pands at first and breakup. The pres sure wave de gen er ates the sheet cav ity at the lead ing edge of hy dro foil tem po rarily. Sheet cav ity os cil lates and de vel ops again in an other cy cle in fig. 5(m)-(p).
Lift co ef fi cients, va por vol ume and pres sure co ef fi cients are given in fig. 6. One typ i cal pe riod is di vided into four phases by five dashed lines. Phase 1 cor re sponds to (a)-(e) in fig. 5, in which growth and os cil la tion of cav ity dom i nate most of time, and pri mary shed ding oc curs at the end of phase. In this phase, lift co ef fi cient in clines steadily. The pres sure on suc tion side, at chord ra tio x/c = 0.1, keeps low 3574 Pa, which is the sat u ra tion pres sure of va por. As the max i mum length of cav ity is about 0.4 cm and con tin ues to grow, pres sure at x/c = 0.5 per sist de clin ing.
How ever, pres sure at x/c = 0.9 re mains high with out much fluc tu a tion since it's far from cav ity. Phase 2 cor re sponds to (f)(h) in fig. 5, in which va por vol ume as cends dra mat i cally at trib -ut ing to the ex pan sion of de tached bub ble A and de vel op ment of bub ble B in duced by vor tex at rear part of hy dro foil. At the same time, lift co ef fi cient drops rap idly be cause of the bub ble shed -ding. In flu enced by the rear part bub ble, pres sure at x/c = 0.9 de creases se verely. From phases 1
and 2, it's ob served that there is a lag be tween the vari able va por vol ume and the pres sure fluc tu a -tion as well as the lift co ef fi cient. The for mer is al ways slightly slower than the lat ter for the cav ity is pres sure field driven and the bub ble needs time to gen er ate or de gen er ate. Phase 3 cor re sponds to (i)-(k) in fig. 5, in which pri mary shed ding bub ble A and rear part bub ble B col lapse when they move to ward the high pres sure re gion. Con se quently, va por vol ume de creases dra mat i cally and lift co ef fi cient tends to go up. When the pri mary bub ble col lapses, an ex tremely high pres sure wave oc curs in the pres sure field, which is pre sented by high peaks in pres sure at x/c = 0.1, 0.5, 0.9. Lift co ef fi cient promptly jumps to the low est be cause of this pres sure wave. Phase 4 cor re sponds to (l)(p) in fig. 5, in which it's free of cav ity on the suc tion side of hy dro foil at first, im -pacted by the pres sure wave, and cav ity grows and os cil lates again later.
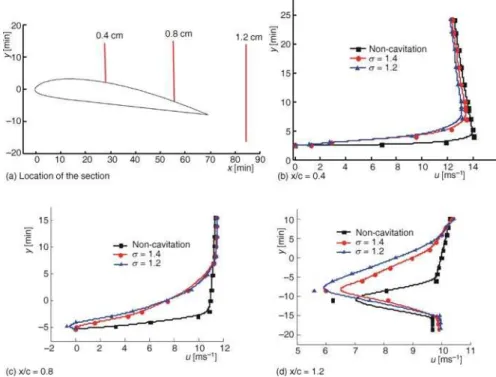
Three ver ti cal lines is ar ranged at x = 0.4, 0.8, and 1.2 cm to de tect the time av er aged hor i zon tal ve loc ity, u, in con di tion of non-cav i ta tion, s = 1.4 and s = 1.2 il lus trated in fig. 7(a).
In the noncav i ta tion sim u la tion re sult, the vis cous layer near wall shows large ve loc -ity gra di ent in flu enced by wall at x/c = 0.4 and 0.8. How ever, time-av er aged ve loc ity, u, ap
Figure 6. Time evolution of lift coefficient, total cavity volume and pressure coefficients in three cycles
proaches main flow ve loc ity 10 m/s out side the vis cous layer. The bound ary layer at x/c = 0.8 is thicker than that at x/c = 0.4 but still re mains at tached. As shown in the fig. 7(a) x/c = 1.2 lo cates in the wake of hy dro foil, a pro found low ve loc ity oc curs. When cav i ta tion is ac ti vated, the bound ary layer near hy dro foil sur face is sig nif i cantly im pacted. The bound ary layer at x/c = 0.4 and 0.8 be comes thicker in a large de gree, and tends to sep a rate. When cav i ta tion num ber s= =i1.2, av er aged hor i zon tal ve loc ity at x/c = 0.8 de creases to neg a tive, which is a solid ev i dence of ad verse re-en trant jet. In ten sity and area of re-en trant jet tends to be en hanced and ex panded with the de crease of cav i ta tion num ber. The strong un steady char ac ter is tics in clud ing the pri -mary shed ding have pre sented in the tran si tion from sheet cav i ta tion to cloud cav i ta tion.
Con clu sions
· An improved FBM model combining RNG k-e and one equation LES, together with additional density correction is proposed and validated in this paper. The filter scale, D, is tested and selected properly on the basis of grid scale to validate the prediction accuracy. · The sheet cavity grows slowly to the maximum length 0.4 cm at cavitation number s = 1.2,
during re-entrant jet develops at the same time. When re-entrant jet is strong enough to force the cavity back to the head of hydrofoil, primary shedding occurs. The primary shedding bubble A flows downwards the hydrofoil and continues to grow up after shedding off and induces a bubble cluster B at rear part of hydrofoil. While sheet cavity oscillates and generates, bubble cluster B breakups.
· The velocity profile of non-cavitation, cavitation s = 1.2 and 1.4 were simulated to explain the reason of the re-entrance jet flow which induces the shedding cavitation.
Ac knowl edg ment
This work was sup ported by Na tional Nat u ral Sci ence Foun da tion of China (Grant No. 51479083), Pro spec tive joint re search pro ject of Jiangsu Prov ince (Grant No. BY2015064-08), Key Re search & De sign pro grams of Jiangsu Prov ince (Grant No. BE2015146 and BE2015001-3) and PAPD.
Ref er ences
[1] Arndt, R. E., Cav i ta tion Re search from an In ter na tional Per spec tive, Pro ceed ings, IOP Con fer ence Se ries: Earth and En vi ron men tal Sci ence, IOP Pub lish ing, Beijing, 2012, Vol. 15, Part 1, 012002
[2] Arndt, R. E., Some Re marks on Hy dro foil Cav i ta tion, Jour nal of Hy dro dy nam ics, Ser. B, 24 (2012), 3, pp. 305-314
[3] Brennen, C. E., Cav i ta tion and Bub ble Dy nam ics, Cam bridge Uni ver sity Press, Cam bridge, UK, 2013 [4] Brennen, C. E., Hy dro dy nam ics of Pumps, Cam bridge Uni ver sity Press, Cam bridge, UK, 2011
[5] CoutierDelgosha, O., et al., Legoupil, Anal y sis of Cavitating Flow Struc ture by Ex per i men tal and Nu -mer i cal In ves ti ga tions, Jour nal of Fluid Me chan ics, 578 (2007), May, pp. 171-222
[6] CoutierDelgosha, O., et al., Nu mer i cal Sim u la tion of the Un steady Be hav iour of Cavitating Flows, In ter -na tio-nal Jour -nal for Nu mer i cal Meth ods in Flu ids, 42 (2003), 5, pp. 527-548
[7] Senocak, I., Shyy, W., Eval u a tions of Cav i ta tion Mod els for Navier-Stokes Com pu ta tions, Pro ceed ings, ASME 2002 Joint USEu ro pean Flu ids En gi neer ing Di vi sion Con fer ence, Amer i can So ci ety of Me chan i -cal En gi neers, Mon treal, Que., Can ada, 2002, Vol. 1, pp. 395-401
[8] Gopalan, S., Katz, J., Flow Struc ture and Mod el ing Is sues in the Clo sure Re gion of At tached Cav i ta tion, Phys ics of Flu ids, 12 (2000), 4, pp. 895-911
[9] Kunz, R. F., et al., A Pre con di tioned Navier-Stokes Method for Two-Phase Flows with Ap pli ca tion to Cav i ta tion Pre dic tion, Com put ers & Flu ids, 29 (2000), 8, pp. 849-875
[11] Zwart, P. J., et al., A Two-Phase Flow Model for Pre dict ing Cav i ta tion Dy nam ics, Pro ceed ings, 5th In ter -na tio-nal Con fer ence on Multiphase Flow, Yo ko hama, Ja pan, 2004
[12] Schnerr, G., Sauer, J., Phys i cal and Nu mer i cal Mod el ing of Un steady Cav i ta tion Dy nam ics, Pro ceed ings, 4th In ter na tional Con fer ence on Multiphase Flow, New Or leans, La., USA, 2001
[13] Morgut, M., Nobile, E., Nu mer i cal Pre dic tions of Cavitating Flow around Model Scale Pro pel lers by CFD and Ad vanced Model Cal i bra tion, In ter na tional Jour nal of Ro tat ing Ma chin ery, 2012 (2012), ID618180, p. 11
[14] Wang, G., et al., Dy nam ics of At tached Tur bu lent Cavitating Flows, Prog ress in Aero space Sci ences, 37 (2001), 6, pp. 551-581