Received from Anesthesiology Department, Faculdade de Medicina, Universidade de São Paulo (USP), Brazil.
1. Medical Student, Faculdade de Medicina, Universidade de São Paulo (USP) 2. Mathematician, Center for Development in Medical Education Prof. Eduardo Marcondes, Faculdade de Medicina, USP
3. MD, Anesthesiology, Department of Surgery, Faculdade de Medicina, USP
4. MD, Associate Professor of Anesthesiology, Department of Surgery, Faculdade de Me-dicina, USP
5. MD, Anesthesiology Professor; Department of Surgery, Faculdade de Medicina, USP Submitted on March 28, 2011.
Approved on May 19, 2011. Correspondence to: Dr. José Otávio Costa Auler Jr.
Secretary of Anesthesiology Teaching of FMUSP Av. Dr. Enéas de Carvalho Aguiar nº 155 - 8ª Andar Prédio dos Ambulatórios - Bloco 3
Cerqueira César
05403000 – São Paulo, SP, Brazil E-mail: [email protected] SCIENTIFIC ARTICLE
Anesthesiology Teaching during Undergraduation through an
Academic League: what is the Impact in Students’ Learning?
Alan Saito Ramalho
1, Felipe Duarte Silva
1, Tatiana Barboza Kronemberger
1,
Regina Albanese Pose
2,
Marcelo Luis Abramides Torres, TSA
3,
Maria José Carvalho Carmona, TSA
4, José Otávio Costa Auler Jr, TSA
5Summary: Ramalho AS, Silva FD, Kronemberger TB, Pose RA, Torres MLA, Carmona MJC, Auler Jr JOC – Anesthesiology Teaching during Undergraduation through an Academic League: what is the Impact in Students’ Learning?
Background and objectives: Academic leagues have been consolidated as instruments of medical teaching and for the introducing of medical students to practice of specialties, including anesthesiology. As the role of leagues in the development process of competencies and learning of their students is not well known, the learning of members of an anesthesiology academic league was evaluated after participating in its activities for one year.
Method: Students of an anesthesiology academic league were followed up from March to December 2010 and evaluated through objective cog-nitive tests of multiple choice applied before the beginning of activities and after their conclusion. Attendance in activities and epidemiologic profile of students were correlated with the tests results.
Results: Twenty medical students from 3rd to 6th year were analyzed, with an average age of 22.8 (21-26) years. The average participation in the proposed activities was 10.4/13 (80%). The average of right answers on the first test was 8.1/17 (47.6%), and 3rd year students had lower grades (p < 0.02) compared with other students. In the post league test, the average of right answers was 11.9/17 (70%), showing an improvement in performance (p < 0.05), and there was no difference between grades of different years of the medical undergraduation. A strong relationship between participation in activities and improved grades was found (r = 0.719; p < 0.001).
Conclusions: Students who participated in the league had improvement in knowledge evaluation tests, suggesting that the league is a useful teaching instrument that can provide improved learning of anesthesiology. Participation in activities was connected with improved performance. Activities developed in leagues may have a positive role in students’ academic education, more specifically in this article, in anesthesiology.
Keywords: Teaching; Anesthesiology; Educational Measurement; Peer Group; Education, Medical, Undergraduation.
©2012 Elsevier Editora Ltda. All rights reserved.
INTRODUCTION
The growth of academic leagues in Brazil and their process of regional and national organization in the last years are highlighted. The Brazilian Association of Medical Academic Leagues was created in 2006 1. In 2010, the Faculdade de
Medicina daUniversidade de São Paulo registered 62 leagues in activity 2.
Academic leagues are associations of students from differ-ent years of medical school that are oridiffer-ented and supervised by professors and professionals connected to an educational institution or hospital to carry out educational, assistential, research and science outreach activities in a certain medi-cal specialty or area. Among different teaching techniques in medicine, the leagues have become more important in stu-dents’ education as extracurricular activity due to its potential to contribute with medical teaching 3.
The contact with anesthesiology within the core curriculum of medical undergraduation varies depending on the institu-tion, but it is usually limited, not only in Brazil, but also in other countries 4,5. Nowadays, our institution provides a regular course to 4th year undergraduate students. There is no intern-ship in anesthesiology during the two years of internintern-ship 6.
The main mission of Anesthesiology, Pain and Intensive
Therapy League of Faculdade de Medicina daUniversidade
The evaluation of students’ learning is a constitutive ele-ment of all teaching-learning process and developele-ment of
competencies 7. Competence, in medicine, was defined by
Epstein and Hundert 8 as “customary and wise use of com-munication, knowledge, technical skills, clinical reasoning, emotions, values and reflexions in daily practice for benefiting both individuals and communities”.
To evaluate the evolution of knowledge of member students of an academic league, such as LADTI, it is essential to deter-mine its value as a teaching technique of medical competences; in anesthesiology in this case. The evaluation has a fundamen-tal role so that people and institutions involved in medical edu-cation identify and respond to their own learning needs 9.
Even though more modern evaluation models, like simula-tions, are more appropriate to evaluate diagnostic reasoning and application of knowledge, it was evidenced that objective tests of multiple choice can meet the five criteria for a proper evaluation 7,10: reliability (data consistency), validity to mea-sure what is proposed, impact in learning and future practice, acceptability and cost 11. Multiple choice tests are useful to evaluate knowledge and problem resolution, especially after a course. They also have the merit of evaluating different ar-eas of knowledge in a relatively short time, at low cost and with high reliability, in addition to enabling an easy analysis of the outcomes. Their main limitations are: difficulty to prepare questions and the possiblity of being corretly answered even if there is no real knowledge 7.
The purpose of this study was to evaluate the learning of members of an anesthesiology academic league after a one-year participation in the actitivies.
METHOD
A prospective population study was carried out between March and December 2010 at LADTI. All students who participated in LADTI’s activities in 2010 were included. Medical students who stopped participating in LADTI during the year or refused to participate in the study were excluded from the analysis.
The evaluation instruments used in the study were two ob-jective cognitive tests of multiple choice, each one consisting of 17 questions based on three levels of complexity according to Palmer et al. 10 (Table I). The questions addressed basic anes-thesiology topics mentioned during LADTI’s activities and were classified according to the level of difficulty in: easy (5 ques-tions), intermediate (6 questions) and difficult (6 questions).
A test was given to the LADTI students on the first day of activities (pre LADTI test). During the nine months of the study, LADTI provided their students with monthly lectures, practical activities instructed by anesthesiology residents, simulation of airway handling and control of oncologic pain, participation in 57th Brazilian Congress of Anesthesiology and preparation of a review about basic anesthesiology subjects supervised by a professor or an assistant physician. The students’ participa-tion data were collected in those activities and 13 attendances were the maximum possible in the considered period. In the last day of activities a new test (post LADTI test) was applied,
which kept the same distribution of characteristics of evalu-ated skills and number of questions by level of difficulty as in the pre LADTI test.
The outcomes of pre and post LADTI tests, the participa-tion in the suggested activities, as well as gender, age and year of course data were organized in Microsoft Excel® (Red-mond, WA, USA) spreadsheets.
Based on the obtained data, the following hypothesis were tested: (a) was there an improvement in academic perfor-mance (higher grades)?; (b) is there a correlation between performance in post LADTI test and participationin the activi-ties?; (c) is there a difference in students’ performance ac-cording to the year coursed (3rd, 4th, 5th, 6th years)?
A descriptive analysis and verification of formulated hy-potheses were conducted with non-parametric tests consider-ing a 95% reliability interval, with SPSS v.15 for Windows and Minitab v.14 for Windows softwares.
RESULTS
There were 25 students in LADTI at the beginning of study. There was a follow-up loss of 4 students, who stopped partici-pating in LADTI. One student refused to participate the study.
Student’s profile and attendance to activities (descriptive population study)
Study’s population was formed by 20 students, aged between 21-26 years, enrolled on 3rd, 4th, 5th and 6th years of the medi-cal course of the institution (Table II). The average age of par-ticipants at the end of LADTI was 22.8 years (21-26), with median and mode of 23.0 years and standard deviation of 1.2 years.
Right answers in pre and post ladti tests and participation in activities (Table III)
The average of right answers in the first test (pre LADTI) was 8.1/17 (47.6%), and in the second test (post LADTI) was 11.9/17 (70%). The mode of right answers went from 9/17
Table I – Composition of Applied Tests, According to Complexity Levels
Complexity Level Number of
Questions I – Knowledge Registration of information 12
II – Understanding Data interpretation 2
III – Application Data interpretation associated with application of knowledge to new circumstances
3
in the pre LADTI test to 11/17 in the post LADTI, which was the same value of maximum grade obtained in the pre LADTI evaluation. The average attendance of students in the activi-ties was 10.4/13 (80%), ranging from 3/13 (23.1%) to 13/13 (100%). Median and mode of participation were 11.0 with stan-dard deviation of 2.7 (Table III). A box graph was plotted to evaluate the relationship between participation in activities and the number of right answers in the tests taken 12 (Figure 1).
For the 3rd year group, the average of right answers in the pre LADTI test was 6/17 (35.3%) and in the post LADTI test was 11.4/17 (67.1%). Among 4th year students, these percent-ages of right answers in the pre and post LADTI tests were 8.8/17 (51.8%) and 12.5 (73.5%), respectively. In the 5th and 6th year groups (internship), average grades were 8.5/17 (50.0%) in the pre and 11/17 (64.7%) in the post LADTI tests (Figure 2).
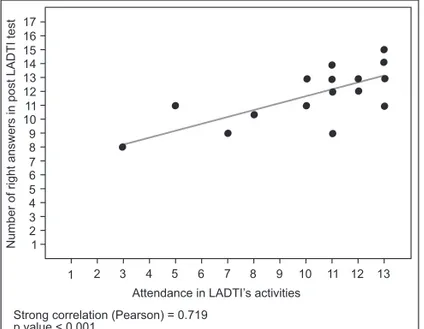
The Kolmogorov-Smirnov normality test was conducted for inference analysis with the purpose of evaluating the distribu-tion of number of right answers in pre and post LADTI tests with regard to participation in the suggested activities. That indicated the absence of normal distribution to all three vari-ables (p-values of 0.929; 0.804; 0.192, respectively). Thus, linear association between the participation in the suggested activities and the number of right answers in the post LADTI test was calculated by Pearson’s test, which showed a sta-tistically significant positive correlation between variables
(r = 0.719; p < 0.001) (Figure 3). That showed a strong rela-tionship between participation in the activities and improve-ment of grades between tests.
As normality assumptions were not met, non-parametric analysis techniques (Mann-Whitney and Kruskal-Wallis tests) were applied to locate the differences between groups, ac-cording to the hypotheses suggested by this study. A sig-nificant difference between the average of right answers in pre LADTI test (8.1/17) and post LADTI (11.9/17) was found (p < 0.05).
The Kruskal-Wallis test was used in order to compare the difference between the performance in tests and the participa-tion in the suggested activities according to the course year
Table II – Absolute and Relative Distributions of LADTI Students in 2010 According to Course Year, Age and Gender
Course year 3rd 4th 5th 6th
N (%) 5 (25%) 11 (55%) 2 (10%) 2 (10%)
Age 21 22 23 24 25 26
N (%) 3 (15%) 6 (30%) 7 (35%) 1 (5%) 2 (10%) 1 (5%)
Gender Female Male
N (%) 5 (25%) 15 (75%)
17 Scale Attendance in suggested activities Right answers in pre LADTI test Right answers in post LADTI test 16 15 14 13 12 11 10 9 8 7 6 5 4 3 2 1
Figure 1 – Box plot Graph with Distribution of Variables: Attendance in suggested activities, right answers in pre LADTI and post LADTI tests. The attendance scale (0 to 13) was linearly transformed from 0 to 17 to coincide with right answers scale (attendance number was multiplied by 17/13). The triangle and the circle correspond, respecti-vely, to average and median of each variable.
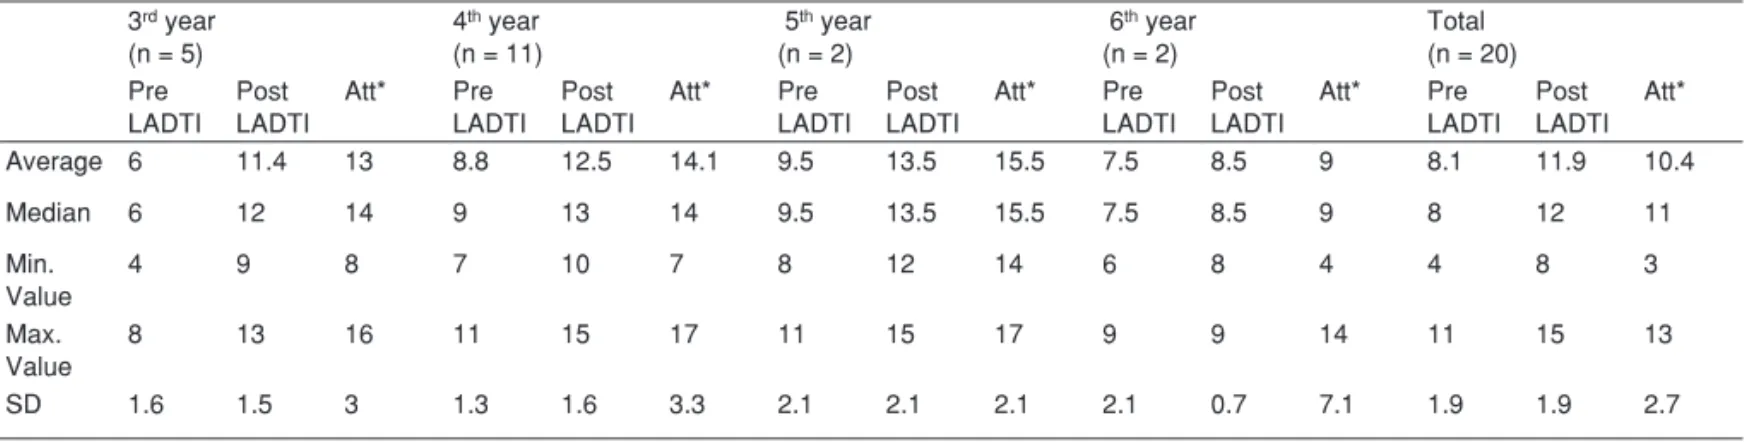
Table III – Descriptive Analysis of Number of Right Answers in Pre and PostLADTI Tests (maximum 17 right answers) and Students Attendance in Suggested Activities (max. 13 attendances), According to Year Coursed in Undergraduation
3rd year (n = 5)
4th year (n = 11)
5th year (n = 2)
6th year (n = 2)
Total (n = 20) Pre LADTI Post LADTI Att* Pre LADTI Post LADTI Att* Pre LADTI Post LADTI Att* Pre LADTI Post LADTI Att* Pre LADTI Post LADTI Att*
Average 6 11.4 13 8.8 12.5 14.1 9.5 13.5 15.5 7.5 8.5 9 8.1 11.9 10.4
Median 6 12 14 9 13 14 9.5 13.5 15.5 7.5 8.5 9 8 12 11
Min. Value
4 9 8 7 10 7 8 12 14 6 8 4 4 8 3
Max. Value
8 13 16 11 15 17 11 15 17 9 9 14 11 15 13
SD 1.6 1.5 3 1.3 1.6 3.3 2.1 2.1 2.1 2.1 0.7 7.1 1.9 1.9 2.7
Right answers 17 16 15 14 13 12 11 10 9 8 7 6 5 4 3 2 1 0
Pre LADTI test Post LADTI test Difference 3rd year 4th year 5th year 6th year Total
17 16 15 14 13 12 11 10 9 8 7 6 5 4 3 2 1
1 2 3 4 5 6 7 8 9 10 11 12 13
Number of right answers in post LADTI test
Attendance in LADTI’s activities
Strong correlation (Pearson) = 0.719 p value < 0.001
Figure 2 – Number of Students’ Right Answers in Pre and Post LADTI tests and Difference between Both Tests, According to Year Coursed in Undergraduation.
Figure 3 – Association between Attendance in Activities and Number of Right Answers in Post LADTI Test.
and the age of the students in this study. It was observed that the performance of 3rd year students was significantly inferior in the pre LADTI tests when compared with grades of other years (p < 0.02). There was no difference between right an-swers of 4th, 5th and 6th year (p > 0.05). On the other hand, in the post LADTI test all years had similar scores, namely, there was no statistical difference between grades of 3rd, 4th, 5th and 6th year in the last test.
When 3rd, 4th, 5th and 6th years were compared in rela-tion to participarela-tion in the activities suggested by the league and to the age, no statistically significat difference was found (p > 0.05).
The Kruskal-Wallis test was conducted to check if there was any difference in students’ performance in the post LADTI test
according to the presence in activities suggested by LADTI and to the number of right answers in the pre LADTI test. Dif-ference was found between students who participated in the league activities and their performance in the post LADTI test (p < 0.036). There was no association between right answers in the pre and post LADTI tests, indicating that the first grade obtained in the first test did not influence the number of right answers in the last one (p > 0.05). There was no statistically significant difference (p > 0.05) between grades in the pre LADTI and post LADTI tests or between attendances accord-ing to gender.
DISCUSSION
In this study, the main observed outcome was the increased performance of students in cognitive tests applied after par-ticipating in LADTI’s activities. This growth showed linear cor-relation with participation in the suggested activities.
Together with the increased grade average from pre to post LADTI test, the permanence of variability between mini-mum and maximini-mum grades in both leads to the conclusion that there was a relatively uniform improvement in students’ performance. The maximum number of right answers in the pre LADTI test is the same mode value in the post LADTI test (11/17), and the average number of right answers on the first test (8.1/17) is equivalent to the minimum value on the second test (8/17).
The limited size of the analyzed sample was determined by the restricted number of LADTI participants. It did not al-low a factorial analysis of the data obtained and has hindered more statistical inferences, since it is a group of volunteers and not a randomized sample. The results apply to the own group and cannot be generalized yet. Therefore, more studies with larger sample size are necessary.
However, this is a pioneer study for objectively evaluating the students’ learning in an academic league. Notwithstanding the great number of leagues and their growth, few studies on the subject describe activities developed by the leagues 13-15, evaluate students’ satisfaction, describe the reasons for the student’s interest in the leagues, or even their scientific pro-duction 13,16. Improvement in learning among students partici-pating in academic leagues had not yet been demonstrated, as highlighted in this article.
This study shows that, in addition to the higher number of right answers in the post LADTI test in comparison to the pre LADTI test, there was a strong positive association between performance improvement and participation in the suggested activities. This study indicates that students with higher at-tendance to the activities tend to have increased growth in performance in relation to the grade of the first test and when compared to the population. On the other hand, the applied tests detected deficiency in the personal performance of stu-dents who had smaller participation.
test performance could be explained solely by the participa-tion in the league or if there are other factors impacting in the increased performance.
Comparing the different years of medical undergraduation, the 3rd year had worse grades when compared with other years on the first test. This was expected as in our institution, students only begin the formal contact with the practice of surgical spe-cialties in the clinical cycle of the course (3rd and 4th year) 6.
The highest increase of grades was observed in the 3rd year and no difference was found in the post LADTI grades among different years of undergraduation. That means that for LADTI students who had no contact with anesthesiology yet, the league impact is even greater than for those who had already studied this subject at university. However, at the end of LADTI, all groups showed improvement in performance. In other words, the activities suggested by league fostered the development of the knowledge of anesthesiology among stu-dents regardless of the year studied. Again, the small sample limits generalization of these findings.
The learning and improved cognitive performance evi-denced in this study reinforce the importance of academic leagues in the medical students’ education and can mean competence gain in the specialty 3,13.
In addition to this aspect, as students are dealing with a subject of their interest in an environment built and managed by themselves and are under the guidance of a professor, it is possible to acquire knowledge and experience, to develop clinical-scientific reasoning and to foster team work. Such skills may be transferred to different areas in the practice of medicine 16; for instance, anesthesiology training centers.
Characteristics like the constant search for learning, com-munication and interpersonal relationships that may be devel-oped among students in an academic league environment are within the ones identified by Smith et al. 17 as important for the excellence in the anesthetic practice.
Although there is criticism about the fact that academic leagues may induce early specialization of undergraduate students, distorting the moment of their general education 3,16, academic leagues are useful instruments to bring medical stu-dents closer to the reality of specialties, including anesthesiol-ogy. They also stimulate the interest in teaching, research and science outreach fundaments 13,18.
Observing medical schools in Brazil and abroad, there is a great variability in the way anesthesiology is taught at
undergraduation courses. Its space is usually limited when compared with other subjects and is sometimes restricted to sparse training 4,5. In teaching hospitals where this specialty is well-structured, anesthesiologists deal not only with intraop-erative anesthetic handling, but also with periopintraop-erative medi-cine, pain medicine and critical patient care 5,19.
Undergraduation is the ideal moment to expose students to the challenges in anesthesiology and to identify who is in-terested in persuing a career in the specialty 5. The contact with anesthesiology is important not only due to the funda-mental knowledge of the subject to the physician (regardless of his future practice); it is also clear the importance of the contact with professionals and professors when students are to choose their specialty. Positive models in anesthesiology teaching are usually identified among those who choose this specialty 20,21. The little contact in undergraduation may es-trange students from certain specialties 22.
Academic leagues may contribute to this choice process and stand out as a feasible alternative by providing contact with anesthesiology when the space in the basic curriculum of medical undergraduation is limited. They are also a way of promoting acquisition of knowledge in the specialty as dem-onstrated in this study, thus contributing to the academic edu-cation of students.
Subsequent, controlled studies and with a greater number of students are required to increase evaluation consistency of the impact of leagues on students’ learning, perhaps leading to the inclusion of this teaching process as a suggestion for teaching centers of the Brazilian Society of Anesthesiology.
CONCLUSION
Students who participated in the activities of Anesthesiology, Pain and Intensive Therapy League had an improved out-come in applied knowledge evaluation tests (increase in the average of right answers from 8.1 to 11.9/17). Participation in the suggested activities had a strong linear association with improved performance.
REFERÊNCIAS / REFERENCES
1. Associação Brasileira de Ligas Acadêmicas de Medicina. Disponível em: http://www.ablam.org.br/institucional.html. (Acessado em 20/03/2011). 2. Departamento Científico da Faculdade de Medicina da Universidade de São
Paulo - Cadastro das Ligas Acadêmicas da Faculdade de Medicina da Uni-versidade de São Paulo 2010. Disponível em http://www.dcfmusp.com.br/ ligas.htm. (Acessado em 23/03/2011).
3. Pego-Fernandes P, Mariani A – Medical teaching beyond graduation: under-graduate study groups. Sao Paulo Med J, 2010;128:257-258.
4. Cheung V, Critchley LA, Hazlett C et al. – A survey of undergraduate teach-ing in anaesthesia. Anaesthesia, 1999;54:4-12.
5. Longnecker DE – Education in anesthesiology for the twenty-first century. J Anesth, 2002;16:65-69.
7. Epstein RM – Assessment in medical education. N Engl J Med, 2007;356:387-396.
8. Epstein RM, Hundert EM – Defining and assessing professional competence. JAMA, 2002;287:226-235.
9. Fraser SW, Greenhalgh T – Coping with complexity: educating for capabil-ity. BMJ, 2001;323:799-803.
10. Palmer EJ, Devitt PG – Assessment of higher order cognitive skills in under-graduate education: modified essay or multiple choice questions? Research paper. BMC Med Educ, 2007;7:49.
11. Van Der Vleuten C – The assessment of professional competence: develop-ments, research and practical implications. Adv Health Sci Educ, 1996;1:41-67.
12. Bussab WO, Morettin PA – Estatística Básica, 5ª Ed, São Paulo, Editora Saraiva; 2006.
13. Fernandes FG, Hortencio LOS, Unterpertinger FV et al. – Cardiothoracic Surgery League from University of São Paulo Medical School: twelve years in medical education experience. Rev Bras Cir Cardiovasc, 2010;25:552-558.
14. Kara José AC, Passos LB, Kara José FC et al. – Ensino extracurricular em Oftalmologia: grupos de estudos / ligas de alunos de graduação. Rev Bras Educ Med, 2007;31:166-172.
15. Neves F, Vieira P, Cravo E et al. – Inquérito nacional sobre as Ligas Acadê-micas de Medicina Intensiva. Rev Bras Ter Intensiva, 2008;20:43-48.
16. Monteiro LLF, Cunha MS, Oliveira WL et al. – Ligas acadêmicas: o que há de positivo? Experiência de implantação da Liga Baiana de Cirurgia Plástica. Rev Bras Cir Plást, 2008;23:158-161.
17. Smith AF, Glavin R, Greaves JD – Defining excellence in anaesthe-sia: the role of personal qualities and practice environment. Br J Anaesth, 2011;106:38-43.
18. Torres A, Oliveira G, Yamamoto F et al. – Academic Leagues and medical education: contributions and challenges. Interface - Comunic Saúde Educ, 2008;12:713-720.
19. Rohan D, Ahern S, Walsh K – Defining an anaesthetic curriculum for medi-cal undergraduates. A Delphi study. Med Teach, 2009;31:e1-5.
20. Akinyemi OO, Soyannwo AO – The choice of anaesthesia as a career by undergraduates in a developing country. Anaesthesia, 1980;35:712-715. 21. Watts RW, Marley J, Worley P – Undergraduate education in anaesthesia:
the influence of role models on skills learnt and career choice. Anaesth Inten-sive Care, 1998;26:201-203.