Claudio Shigueki SuzukiI Suzana Alves de MoraesII Isabel Cristina Martins de FreitasI
I Programa de Pós-Graduação de Enfermagem e Saúde Pública. Escola de Enfermagem de Ribeirão Preto (EERP). Universidade de São Paulo (USP). Ribeirão Preto. SP. Brasil
II Departamento de Enfermagem Materno-Infantil e Saúde Pública. EERP-USP. Ribeirão Preto. SP. Brasil
Correspondência | Correspondence:
Suzana Alves de Moraes Av. dos Bandeirantes. 3900 14040-902 Ribeirão Preto. SP. Brasil E-mail: [email protected]
Recebido: 24/5/2010 Aprovado: 28/9/2010
Artigo disponível em português e inglês em: www.scielo.br/rsp
Physical activity and correlates
among adults living in Ribeirão
Preto, Southeastern Brazil
ABSTRACT
OBJECTIVE: To identify physical activity patterns and associated factors among adults.
METHODS: A cross-sectional population-based epidemiological study was conducted in Ribeirão Preto, Southeastern Brazil, in 2006, with a three-stage sampling process. Physical activity patterns were assessed in a weighted sample of 2,197 adults aged 30 years and over, using the International Physical Activity Questionnaire (short version), which has been validated in Brazil. Associated fators were identifi ed using Poisson regression. Prevalence ratios were estimated through points and 95% confi dence intervals, in univariate and multiple models. Insuffi cient versus suffi cient practice of physical activity was taken to be the outcome for calculating prevalence ratios.
RESULTS: Suffi cient practice of physical activity was presented by 37.5% of the men and 32.1% of the women. The prevalence of insuffi cient practice was higher than the prevalence of suffi cient practice in practically all the categories of variables, for both sexes. Different variables remained in the fi nal models when males and females were considered separately. For males, the following remained in the fi nal model: working for more than ten hours/day [PR = 1.30; 95%CI: 1.07;1.57]; three or more medications taken over the last 15 days [PR = 1.56; 95%CI: 1.16;2.08]; and poor/very poor self-reported health [PR = 1.54; 95%CI: 1.01;2.34]. For females, the following remained: education level of one to three years of schooling [PR = 1.20; 95%CI: 1.02;1.41]; not having any income [PR = 0.78; 95%CI: 0.66;0.93]; and income less than R$ 520.00 [PR = 0.74; 95%CI: 0.60;0.90].
CONCLUSIONS: The prevalence of insuffi cient practice of physical activity was high. The results suggest that there is a need to implement specifi c programs to promote physical activity, directed towards men who work for more than ten hours/day, take three or more medications and consider that their health is poor or very poor; and towards women of low income and schooling levels.
DESCRIPTORS: Sedentary Lifestyle. Cross-Sectional Studies. Physical Activity. Correlates.
INTRODUCTION
Estimates from the World Health Organization (WHO) for the year 2001 showed that 58.5% of deaths due to all causes worldwide resulted from chronic diseases. These estimates indicate that this group of diseases is responsible for around 45.9% of the Disability-Adjusted Life Years (DALY) indicator for the world population.23 Changes in morbidity-mortality patterns
have been targeted by epidemiological studies on the relationship between chronic degenerative diseases and associated factors, among which the pattern of physical activity is highlighted.14
Regular practice of physical activities has been shown in the literature to be an important factor for protection against chronic diseases.7,22 In a systematic review of
the literature, Shepard18 (1995), classifi ed the evidence
associating this practice to reduced risk of coronary heart disease, arterial hypertension, kidney disease, type 2 diabetes, osteoporosis, colon and breast cancer, depression and anxiety, among others, as conclusive. Therefore, these diseases should not be considered inevitable in modern society and could be prevented at a lower cost than that of curative and care interventions.24
Over recent decades, there has been an increase in the volume of national and international published papers involving the epidemiology of physical acti-vity. However, the availability of different methods for evaluating physical activity patterns in population-based studies makes it diffi cult to compare the results from different investigations. According to the systematic review carried out by Hallal et al10 (2007), among the 39
studies that used questionnaires to assess physical acti-vity patterns in Brazil over the past two decades, 69% were conducted with instruments created by the authors themselves. In this light, and with the support from the World Health Organization (WHO), the International Physical Activity Questionnaire (IPAQ) was developed, which has the purpose of assessing physical activity levels in a standardized manner, across the world.6
The present study aimed to identify physical activity patterns and associated factors among adults.
METHODS
The data come from the OBEDIARP (Risk factors for overweight, obesity and diabetes mellitus in the muni-cipality of Ribeirão Preto, SP, 2006) Project, which had a cross-sectional population-based design.21 Adults aged
30 years or more of both sexes, living in the urban area of the municipality of Ribeirão Preto, Southern Brazil, in 2006, composed the sample. The sampling process was developed in three stages. The precision of the estimates was calculated on a sample of 1,205 individuals and
a Instituto Brasileiro de Geografi a e Estatística. Censo Demográfi co 2000. Rio de Janeiro; 2000.
b Guidelines for Data Processing and Analysis of The International Physical Questionnaire, November 2005 (www.ipaq.ki.se).
corresponded to fi xed sampling errors of around 2% (for prevalence below 15% or above 75%) and around 3% (for prevalence between 20% and 80%). The primary sampling unit (2000a) was the census tract and the units
drawn were the household and the people in the second and third stages, respectively. For the fi rst two stages, a cluster draw method allocated proportionally to size was used. Stratifi cation according to the mean income in the name of the head of the family was introduced in the second stage of the draw. In the third stage, one person aged 30 years or over was drawn from among the (N) residents of the households selected and the stratifi cation took into consideration the composition by age group for each sex,19 excluding pregnant women
or women up to the sixth month after delivery. In total, 930 participants were interviewed, with a response rate of 78%. The variability that was introduced, especially in the third fraction of the sampling, was corrected by attribution of sample weights equal to the number of eligible units of each household, which originated a weighted sample of 2,197 participants.
The practice of physical activity (dependent variable) was assessed by means of the IPAQ instrument (short version), which is recommended by WHO for popula-tion-based studies.6 Based on continuous measurements
of the physical activity scores (METs-minutes/week), the participants were initially classifi ed in three levels: “insuffi ciently active”; “active” and “very active”. The participants who accomplished fi ve or more days of any combination of walking and moderate to vigorous-intensity activities, accumulating at least 600 METs-minutes/week were classifi ed as “active”. Those who accomplished out seven or more days of any combi-nation of these activities, accumulating at least 3,000 METs-minutes/week, were classifi ed as “very active”. The participants who did not reach either of these two criteria were considered “insuffi ciently active.”b The
categories “active” and “very active” were grouped into a single category, corresponding to suffi cient practice of physical activity, and those originally classifi ed as “insuffi ciently active” composed the category corres-ponding to insuffi cient practice of physical activity.
by WHO15 for epidemiological studies, with a cutoff
point of ³ 8 for classifi cation of abusive consumption);13
consumption of medications (use and quantity of medi-cations in the 15 days prior to the interview); work conditions (number of hours worked, on typical days, during the week). Block 3 - variables relating to health: nutritional status, according to specifi c cutoff points for the body mass index (BMI), according to WHO25
(eutrophic (BMI: 18.50 to 24.99), pre-obese (BMI: 25.00 to 29.99) and obese (BMI: ≥ 30.00); self-reported health (the participant’s perception of his/her state of health, comparing it with that of relatives and friends of the same age) and number of family antecedents of obesity going back to the third ascendant generation.
Data were collected through structured interviews at the participants’ homes by a previously trained team. Measurements obtained from volunteers were assessed twice by the interviewers and by a supervising anthro-pometrist (gold standard) to evaluate the calibration of the interviewers in training.5 Precision and exactness
measurements were calculated, according to Habicht.9
To minimize typing errors, the data entry fi elds were validated by means of creating specifi c amplitudes for the digits (acceptable value intervals and codes for each variable). The typists were previously trained to ensure the quality of the typing process and, for the external consistency test, the data typing was done with double data entry into the formatted databases of the EpiData software, version 2.1 for Windows.
The prevalence of physical activity was stratifi ed by sex and estimated by points and 95% confi dence intervals. These estimates were calculated for the set of socio-demographic, behavioral and health-related variables.
To identify the factors associated with insuffi cient physical activity practice, Poisson regression models were created,11 in which prevalence ratios in univariate
and multiple models were estimated by points and 95% confi dence intervals. A “positive” outcome was considered to be insuffi cient practice, while a “nega-tive” outcome was suffi cient physical activity practice. Univariate models were created containing each of the independent variables and the response variable. The variables with p values ≤ 0.25 (Wald test) were candidates for the multiple models. In the fi nal multiple models, only the variables with p < 0.05 were kept.
The estimates took into consideration the sample design effect and the analyses were carried out using specifi c commands (survey commands) of the STATA software, version 8.2 for Windows.
The OBEDIARP Project was approved by the Research Ethics Committee of Escola de Enfermagem de Ribeirão Preto da Universidade de São Paulo, on April 20, 2005 (procedural no. 0528/2005). The participants signed a free and informed consent statement, in accor-dance with the recommendations of the Resolution 196 of the National Health Council.
Table 1. Sociodemographic characteristics, according to sex. Ribeirão Preto, Southeastern Brazil, 2006.
Characteristic Male Female
Nwa %a Nwa %a
Age Group (years)
30 to 39 250.8 38.0 404.7 26.3
40 to 49 160.0 24.3 506.9 33.0
50 to 59 125.7 19.0 328.6 21.4
60 or over 123.5 18.7 296.7 19.3
Marital Status
Without partner 158.7 27.0 421.7 29.5
With partner 429.8 73.0 1007.0 70.5
Educational Level (years)
Illiterate < 1 24.0 3.6 57.5 3.7
1 to 3 69.3 10.5 192.2 12.5
4 to 7 206.5 31.3 472.8 30.8
8 or more 360.1 54.6 814.4 53.0
Income in reais (terciles)
No income 133.2 20.2 692.3 45.1
< 520.00 62.8 09.5 375.2 24.4
520.00 to 1100.00 218.4 33.1 226.3 14.7
> 1100.00 245.6 37.2 243.1 15.8
RESULTS
Most of the sociodemographic characteristics were similar for both sexes (Table 1). However, there was male predominance in the age group between 30 and 39 years (38%) and female predominance among those with no income (45.1%). A greater percentage of men were from the third tercile of income (37.2%) than of the women (15.8%).
The prevalence of insuffi cient physical activity practice was higher than suffi cient practice for the sociodemo-graphic, behavior and health-related variables among both sexes (Tables 2, 3 and 4). There were exceptions among men who did not make use of medication and among those belonging to the lower third of the “dura-tion of smoking” variable, although these differences were small.
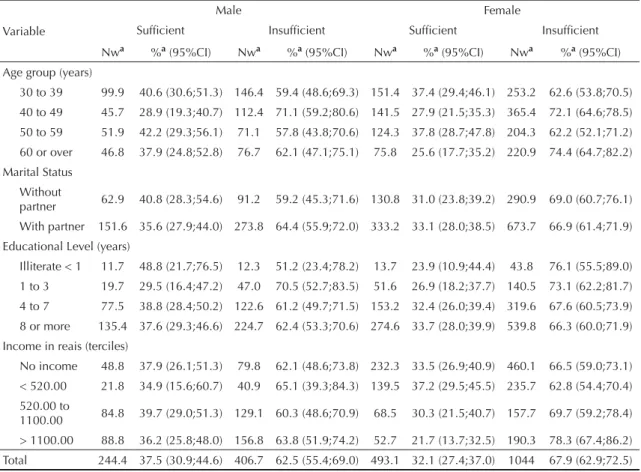
Greater prevalences of suffi cient practice were identi-fi ed among men with less than one year of education (48.8%) and among those between the ages of 50 and 59 years (42.2%). Among women, greater prevalences of suffi cient practice were observed between the ages of 30 and 39 years (37.4%) and 50 to 59 years (37.8%) and among those classifi ed in the fi rst third of income (37.2%) (Table 2).
An inverse relationship between the “number of hours of work/day” and prevalence of suffi cient practice was observed among men. The variables: “duration of smoking”, “use of medications” and “number of medications consumed in the last 15 days”, presented an overall association with the dependent variable for male sex (p < 0.05) (Table 3).
There was an inverse relationship between the preva-lence of suffi cient practice and nutritional status among male participants, as well as for the state of health compared with that of their friends. Among the women, a direct relationship was observed for the categories of self-perception of their state of health (Table 4).
The fi nal models were composed of different sets of variables when considering the male and female sexes separately (Table 5). Number of work hours (> 10 h/ day), number of medications consumed in the last 15 days and self-reported health (“poor/very poor”) remained in the fi nal model for men. For women, educational level (“1-3 years” of education) and income (“1st third of income” and “without income”) remained.
For the adjusted prevalence ratios, there was a statisti-cally signifi cant (p < 0.05) linear trend for the number of hours at work/day and the number of medications
Table 2. Prevalence of physical activity practice, according to sociodemographic factors. Ribeirão Preto, Southeastern Brazil, 2006.
Variable
Male Female
Suffi cient Insuffi cient Suffi cient Insuffi cient
Nwa %a (95%CI) Nwa %a (95%CI) Nwa %a (95%CI) Nwa %a (95%CI) Age group (years)
30 to 39 99.9 40.6 (30.6;51.3) 146.4 59.4 (48.6;69.3) 151.4 37.4 (29.4;46.1) 253.2 62.6 (53.8;70.5) 40 to 49 45.7 28.9 (19.3;40.7) 112.4 71.1 (59.2;80.6) 141.5 27.9 (21.5;35.3) 365.4 72.1 (64.6;78.5) 50 to 59 51.9 42.2 (29.3;56.1) 71.1 57.8 (43.8;70.6) 124.3 37.8 (28.7;47.8) 204.3 62.2 (52.1;71.2) 60 or over 46.8 37.9 (24.8;52.8) 76.7 62.1 (47.1;75.1) 75.8 25.6 (17.7;35.2) 220.9 74.4 (64.7;82.2) Marital Status
Without
partner 62.9 40.8 (28.3;54.6) 91.2 59.2 (45.3;71.6) 130.8 31.0 (23.8;39.2) 290.9 69.0 (60.7;76.1) With partner 151.6 35.6 (27.9;44.0) 273.8 64.4 (55.9;72.0) 333.2 33.1 (28.0;38.5) 673.7 66.9 (61.4;71.9) Educational Level (years)
Illiterate < 1 11.7 48.8 (21.7;76.5) 12.3 51.2 (23.4;78.2) 13.7 23.9 (10.9;44.4) 43.8 76.1 (55.5;89.0) 1 to 3 19.7 29.5 (16.4;47.2) 47.0 70.5 (52.7;83.5) 51.6 26.9 (18.2;37.7) 140.5 73.1 (62.2;81.7) 4 to 7 77.5 38.8 (28.4;50.2) 122.6 61.2 (49.7;71.5) 153.2 32.4 (26.0;39.4) 319.6 67.6 (60.5;73.9) 8 or more 135.4 37.6 (29.3;46.6) 224.7 62.4 (53.3;70.6) 274.6 33.7 (28.0;39.9) 539.8 66.3 (60.0;71.9) Income in reais (terciles)
No income 48.8 37.9 (26.1;51.3) 79.8 62.1 (48.6;73.8) 232.3 33.5 (26.9;40.9) 460.1 66.5 (59.0;73.1) < 520.00 21.8 34.9 (15.6;60.7) 40.9 65.1 (39.3;84.3) 139.5 37.2 (29.5;45.5) 235.7 62.8 (54.4;70.4) 520.00 to
1100.00 84.8 39.7 (29.0;51.3) 129.1 60.3 (48.6;70.9) 68.5 30.3 (21.5;40.7) 157.7 69.7 (59.2;78.4) > 1100.00 88.8 36.2 (25.8;48.0) 156.8 63.8 (51.9;74.2) 52.7 21.7 (13.7;32.5) 190.3 78.3 (67.4;86.2) Total 244.4 37.5 (30.9;44.6) 406.7 62.5 (55.4;69.0) 493.1 32.1 (27.4;37.0) 1044 67.9 (62.9;72.5)
consumed in the last 15 days, among men. Although among women there was an indication of a linear gradient for educational level, the tendency test did not present statistical signifi cance (p > 0.05).
DISCUSSION
The results from the present study indicated high prevalence of insuffi cient physical activity practice among both sexes in the municipality of Ribeirão Preto. Regarding sex, different sets of variables remained in the fi nal models, notably, among men, the number of hours at work (> 10 hours/day), consumption of three or more medications/day and self-reported health clas-sifi ed as “poor/very poor”. Among the women, low income and educational level remained associated with the outcome.
According to Brown et al4 (2004), until the mid-1990s,
research considered physical activity only during leisure time, because its benefi ts were attributed to more vigorous activities, such as sports and physical conditioning. Because of the increased prevalence of obesity in the worldwide population, greater attention has been given to the total daily energy expenditure in different domains. In a national survey conducted in Australia, in 2001,4 the authors concluded that the IPAQ
was the instrument that best “captured” the activities carried out in different domains: during leisure time, at work, in housework and in commuting, in comparison with another three questionnaires, among which was the Behavioral Risk Factor Surveillance (BRFSS). The instrument presented the advantage of asking participants about the practice of physical activity in a typical week, since problems could have occurred if such practices took the preceding week as the reference Table 3. Prevalence of physical activity practice, according to behavioral factors. Ribeirão Preto, Southeastern Brazil, 2006.
Variable
Male Female
Suffi cient Insuffi cient Suffi cient Insuffi cient
Nwa %a (95%CI) Nwa %a (95%CI) Nwa %a (95%CI) Nwa %a (95%CI)
Smoking Habit
Non smokers 92.9 36.6 (27.8;46.3) 160.9 63.4 (53.6;72.1) 306.8 32.2 (27.0;37.9) 643.5 67.8 (62.0;72.9) Former smokers 99.4 41.8 (31.1;53.2) 138.6 58.2 (46.7;68.8) 104.3 34.9 (27.5;43.1) 194.4 65.1 (56.8;72.5) Smokers 51.9 32.7 (22.9;44.1) 107.2 67.3 (55.8;77.0) 81.9 28.5 (20.7;37.6) 205.9 71.5 (62.3;79.2) Duration of Smoking (terciles)*
< 13 years 67.3 51.8 (37.6;65.7) 62.6 48.2 (34.2;62.3) 66.1 35.2 (24.9;46.9) 121.8 64.8 (53.0;75.0) 13 to 24 years 35.1 28.7 (18.3;41.9) 87.0 71.3 (58.0;81.6) 51.2 27.0 (17.9;38.5) 138.4 73.0 (61.4;82.1) 25 years and
more 48.9 33.8 (22.7;46.9) 96.0 66.2 (53.1;77.2) 66.6 32.5 (23.0;43.6) 138.1 67.5 (56.3;76.9) Abusive Alcohol Consumption
No dependency
(0 to 7) 133.2 36.3 (28.2;45.2) 233.5 63.7 (54.7;71.7) 442.2 32.0 (27.4;37.0) 938.2 68.0 (63.0;72.5) With
dependency (8 to 40)
111.2 39.1 (30.4;48.4) 173.2 60.9 (51.5;69.5) 50.9 32.5 (21.2;46.3) 105.6 67.5 (53.7;78.7)
Use of Medications*
No 116 50.1 (39.2;60.9) 115.5 49.9 (39.0;60.7) 74.0 32.8 (23.0;44.4) 151.3 67.2 (55.5;76.9) Yes 128.5 30.6 (23.7;38.5) 291.1 69.4 (61.4;76.2) 419.1 31.9 (27.0;37.2) 892.5 68.1 (62.7;72.9) Number of Medications*
None 116 50.1 (39.2;60.9) 115.5 49.9 (39.0;60.7) 74.0 32.8 (23.0;44.4) 151.3 67.2 (55.5;76.9) 1 60.4 33.3 (23.2;45.1) 121.2 66.7 (54.8;76.7) 132.8 31.4 (23.2;41.0) 289.8 68.6 (59.0;76.7) 2 35.7 34.1 (21.1;49.8) 69.18 65.9 (50.1;78.8) 118.9 37.4 (28.8;46.8) 198.9 62.6 (53.1;71.1) 3 or more 32.3 24.3 (12.8;41.2) 100.8 75.7 (58.7;87.2) 167.3 29.3 (23.7;35.4) 403.9 70.7 (64.5;76.2) Hours of Work/day (terciles)
< 7 hours 87.7 43.9 (34.4;53.9) 111.9 56.1 (46.0;65.5) 189.5 34.3 (27.4;41.8) 363.1 65.7 (58.1;72.5) 7 to 10 hours 98.7 36.8 (27.1;47.5) 169.6 63.2 (52.4;72.8) 201.4 30.5 (24.5;37.2) 459.1 69.5 (62.7;75.4) > 10 hours 57.9 31.7 (21.6;43.7) 125.1 68.3 (56.2;78.3) 102.2 31.6 (23.6;40.6) 221.6 68.4 (59.3;76.3) Total 244.4 37.5 (30.9;44.6) 406.7 62.5 (55.4;69.0) 493.1 32.1 (27.4;37.0) 1044 67.9 (62.9;72.5)
point, given that possible occurrences of holiday or illnesses would make it atypical.
In a study developed by Gómez et al8 (2005) in the city
of Bogotá (Colombia) in 2003, the prevalence of suffi -cient physical activity practice were 43.8% for men, and 32.1% for women. Although similar to the results found in Ribeirão Preto for women, these values presented a greater magnitude than what was found for men.
Santos et al17 (2009) observed that the prevalence of
suffi cient physical activity in the population above 18 years of age was 68.8% for men and 48.3% for women in the Archipelago of the Azores (Portugal) in 2004. In a cross-sectional study with 5,167 participants between 15 and 79 years in Canada in 2002, Pan et al16 (2009)
noted prevalence of 82.8% for men and 75.2% for women. Differences in the lower age limit in relation to that of the OBEDIARP Project participants may explain the higher magnitudes of the prevalence of suffi cient physical activity practice in the Archipelago
of the Azores and in Canada. However, other factors, besides age, infl uence the practice of physical activity. In a cross-sectional study conducted in 20 countries, including Brazil, between 2002 and 2004, Bauman et al2 (2009) concluded that the greater levels found in
the more developed countries were due to the fact that they had greater availability of resources for practicing recreational activities and had a greater tradition of promoting physical exercise. These authors observed that the signifi cant contribution that walking had in the levels of physical activity was, in some countries, due to the infrastructure created for this practice and the established regional culture. In this study, the results regarding Brazil indicated that the prevalence of insuf-fi cient physical activity practice was 25.6% among men and 34.3% among women. In Ribeirão Preto, the respective prevalences were even greater (62.5% and 67.9% among men and women, respectively).
A set of independent variables similar to the variables in the OBEDIARP Project was considered in the study Table 4. Prevalence of physical activity practice, according to health-related factors. Ribeirão Preto, Southeastern Brazil, 2006.
Variable
Male Female
Suffi cient Insuffi cient Suffi cient Insuffi cient
Nwa %a (95%CI) Nwa %a (95%CI) Nwa %a (95%CI) Nwa %a (95%CI) Nutritional Status
Eutrophic 78 42.2 (31.6;53.5) 107 57.8 (46.4;68.3) 168.1 29.2 (22.9;36.3) 407.3 70.8 (63.6;77.0) Pre-obese 128.1 39.3 (30.7;48.5) 198 60.7 (51.4;69.2) 186 35.8 (28.3;44.1) 332.7 64.2 (55.8;71.6)
Obese 35.8 28.9 (17.3;43.9) 88.2 71.1 (56.0;82.6) 134.4 31.8 (24.9;39.6) 287.9 68.2 (60.3;75.0) Self-reported Health
Excellent 55.6 42.5 (27.2;59.2) 75.3 57.5 (40.7;72.7) 69.6 35.4 (24.6;47.8) 127.1 64.6 (52.1;75.3) Good 137.8 36.4 (28.6;44.9) 240.8 63.6 (55.0;71.3) 249.3 32.6 (27.1;38.6) 515.2 67.4 (61.3;72.8) Regular 49 40.6 (27.2;55.5) 71.8 59.4 (44.4;72.7) 136 30.3 (23.1;38.5) 313.3 69.7 (61.4;76.8)
Poor + very poor 1.9 09.3 (01.2;46.3) 18.6 90.7 (53.6;98.7) 38.1 30.2 (19.5;43.4) 88.2 69.8 (56.5;80.4) Health in Relation to Family
Worse than yours 89.7 43.4 (32.5;54.8) 117.3 56.6 (45.1;67.5) 144.7 31.6 (24.0;40.2) 313.4 68.4 (59.7;75.9) The same as
yours 135.2 34.7 (26.8;43.4) 254.8 65.3 (56.6;73.1) 271.6 33.1 (27.5;39.1) 549.3 66.9 (60.8;72.4) Better than yours 19.5 36.1 (19.7;56.4) 34.5 63.9 (43.5;80.3) 76.7 29.8 (22.2;38.5) 181.1 70.2 (61.4;77.7) Health in Relation to Friends
Worse than yours 38.7 30.2 (18.4;45.1) 89.7 69.8 (54.8;81.5) 111.6 37.4 (28.5;47.0) 187.2 62.6 (52.9;71.4)
The same as
yours 129.4 38.9 (30.1;48.4) 203.1 61.1 (51.5;69.8) 214.7 29.6 (23.9;35.9) 511.2 70.4 (64.0;76.0) Better than yours 76.2 40.1 (29.8;51.5) 113.8 59.9 (48.5;70.2) 166.8 32.6 (25.9;39.9) 345.5 67.4 (60.0;74.0)
Family History of Obesity
None 155 38.6 (30.6;47.2) 246.3 61.4 (52.7;69.3) 260.2 31.7 (25.8;38.1) 561.5 68.3 (61.8;74.1) 1 59.9 34.8 (23.4;48.3) 112.2 65.2 (51.6;76.5) 147.9 33.4 (26.7;40.8) 294.8 66.6 (59.1;73.2) 2 27 43.1 (25.4;62.7) 35.7 56.9 (37.2;74.6) 52.7 32.1 (21.0;45.4) 111.8 67.9 (54.5;78.9) 3 or more 2.4 19.5 (04.0;58.2) 9.9 80.5 (41.7;95.9) 27.7 29.4 (18.0;44.1) 66.4 70.6 (55.8;81.9)
Total 244.4 37.5 (30.9;44.6) 406.7 62.5 (55.4;69.0) 493.1 32.1 (27.4;37.0) 1044 67.9 (62.9;72.5)
by Pan et al16 (2009). Self-reported health,
educa-tional level and family income remained associated with the practice of physical activity. However, the association with educational level presented statistical signifi cance only for women in the fi nal model, as in the OBEDIARP Project. According to Pan et al,16 people
with higher educational levels tend to present better health conditions, better social support and assimilate more easily to the recommendations and the benefi ts of regular practice of physical activity. Similarly, people with better income have more access, facilities and opportunities to practice physical activity, as well as living in a social environment in which the practice is recognized by others as benefi cial to health, which makes adhesion easier. There was no association found between the number of hours of work/day and the outcome.16 In the present study, the association found
between the hours of work/day and insuffi cient practice of physical activity and the linear trend for the preva-lence ratios among men can be explained by the lower
time available for leisure activities. Also, it is possible that the work activities of the municipality of Ribeirão Preto are characterized as more sedentary activities, considering the high educational level. According to the Pesquisa Nacional por Amostra de Domicílios (PNAD – National Household Sampling Survey)20 in
2007, in the Southeastern Brazil, the weekly mean time load dedicated to formal work was higher among men (44.2 hours) than among women (36.7 hours), while the weekly mean values for time dedicated to domestic work among men and women were, respectively, 9.0 and 21.3 hours/week.
Bertoldi et al3 (2006) found an inverse association
between the levels of physical activity and use of medications by the population in the univariate analyses and in the fi nal models in Pelotas, Southern Brazil, in 2002. These fi ndings are confi rmed for the male sex in the present study, which reinforces the hypothesis of an association between physical activity and the Table 5. Crude and adjusted prevalence ratiosa, according to sex. Final model. Ribeirão Preto, Southeastern Brazil, 2006.
Variables Crude PR 95%CI Adjusted PR 95%CI
Male
Hours of Work/day (terciles)
< 7 hours 1 1*
7 to 10 hours 1.12 0.89;1.42 1.21 0.95;1.53
> 10 hours 1.21 0.99 ;1.49 1.30 1.07;1.57
Number of Medications
None 1 1*
1 1.33 1.04;1.71 1.32 1.03;1.70
2 1.32 0.97;1.78 1.32 0.99;1.77
3 or more 1.52 1.14;2.01 1.56 1.16;2.08
Self-reported Health
Excellent 1 1
Good 1.10 0.81;1.50 1.10 0.80;1.51
Regular 1.03 0.71;1.48 0.98 0.68;1.41
Poor + very poor 1.57 1.11;2.22 1.54 1.01;2.34
Female
Educational Level (years)
8 or more 1 1
4 to 7 1.01 0.90;1.14 1.10 0.95;1.27
1 to 3 1.10 0.96;1.26 1.20 1.02;1.41
Illiterate. < 1 1.14 0.91;1.44 1.26 0.99;1.60 Income in reais (terciles)
> 1100.00 1 1
520.00 to 1100.00 0.89 0.75;1.05 0.85 0.72;1.02
< 520.00 0.80 0.67;0.94 0.74 0.60;0.90
No income 0.84 0.73;0.98 0.78 0.66;0.93
a For the calculation of the prevalence ratios, a “positive” outcome was considered to be insuffi cient practice and a “negative”
medications. In Ribeirão Preto, it was possible to identify the dose-response effect for the prevalence ratios, when investigating the association between the numbers of medications used in the last 15 days and the physical activity pattern. In the study in Pelotas, the authors suggested that the use of medications was not determined only by pharmacological factors, but also by social, anthropological and behavioral patterns and cultural characteristics. These factors might explain, at least partly, why such an association was not found among the women in Ribeirão Preto.
In a study carried out in 2002, in the European Union, with 16,230 participants, using self-reported health as a dependent variable, Abu-Omar et al1 (2004) observed
that people who were more active reported better states of health than did those who were less active. The authors observed, in the multiple models, that the level of physical activity was a signifi cant “predictor” of self-reported health, after adjustment for sex, age, income, educational level, smoking and nationality. Gómez et al8 (2005) reinforced this hypothesis when
they identifi ed, in the population of Bogotá, a direct association between health state self-perception and the practice of physical activity. Similarly, Pan et al16
(2009) when considering both sexes together, observed that those that classifi ed their health as “poor” presented less chance of being suffi ciently active, compared with those who reported excellent health [OR = 0.42 (95%CI: 0.29;0.61)]. Similar results were observed in Ribeirão Preto for men regarding self-reported health and the practice of physical activity. However, the cross-sectional design of these studies has the limitation
of reverse causality bias, i.e., insuffi cient levels of physical activity may lead a person to a “poor/very poor” health state and the reciprocal may be true.
The bias of reverse causality, which is potentially present in studies with cross-sectional designs, rein-forces the need to develop cohort studies to better understand the “directionality” of the associations found. On the other hand, though the IPAQ is increas-ingly being used in population-based studies, the clas-sifi cation of the participants regarding their levels of physical activity is not always in agreement with the recommendations of its organizers. While some authors consider only the total in minutes/week in physical activity practice,3 regardless of frequency or intensity,
others consider the frequency of practice combined with the duration of activity.8 As well as presenting
different physiological models on health, this diversity of classifi cations makes it diffi cult to compare results.
1. Abu-Omar K, Rutten A, Robine JM. Self-rated health and physical activity in the European Union. Soz Praventivmed. 2004;49(4):235-42.
2. Bauman A, Bull F, Chey T, Craig CL, Ainsworth BE, Sallis JF, et al. The international prevalence study on physical activity: results from 20 countries. Int J Behav Nutr Phys Act. 2009;6(1):21. DOI:10.1186/1479-5868-6-21
3. Bertoldi AD, Hallal PC, Barros AJD. Physical activity and medicine use: evidence from a population-based study. BMC Public Health. 2006;6:224. DOI: 10.1186/1471-2458-6-224
4. Brown W, Bauman A, Chey T, Trost S, Mummery K. Comparison of surveys used to measure physical activity. Aust N Z J Publ Health. 2004;28(2):128-34. DOI:10.1111/j.1467-842X.2004.tb00925.x
5. Castro V, Moraes SA, Freitas ICM, Mondini L.
Variabilidade na aferição de medidas antropométricas: comparação de dois métodos estatísticos para avaliar a calibração de entrevistadores. Rev Bras Epidemiol. 2008;11(2):278-86. DOI:10.1590/S1415-790X2008000200009
6. Craig CL, Marshall AL, Sjostrom M, Bauman AE, Booth ML, Pratt M, et al. International physical activity questionnaire: 12-country reability and validity. Med Sci Sports Exerc. 2003;35(8):1381-95. DOI: 10.1249/01.MSS.0000078924.61453.FB
7. Donnelly JE, Hill JO, Jacobsen DJ, Potteiger J, Sullivan DK, Johnson SL, et al. Effects of a 16-month randomized controlled exercise trial on body weight and composition in young, overweight men and women: the Midwest Exercise Trial. Arch Intern Med. 2003;163(11):1343-50. DOI:10.1001/ archinte.163.11.1343
8. Gómez LF, Duperly J, Lucumi DI, Gámez R, Venegas AS. Nivel de actividad física global en la población adulta de Bogotá (Colombia): prevalencia y factores asociados. Gac Sanit. 2005;19(3):206-13. DOI: 10.1157/13075953
9. Habicht JP. Estandarización de métodos
epidemiológicos cuantitativos sobre el terreno. Bol Ofi cina Sanit Panam. 1974;76:375-84.
10. Hallal PC, Dumith SC, Bastos JP, Reichert FF, Siqueira FV, Azevedo MR. Evolução da pesquisa epidemiológica em atividade física no Brasil: revisão sistemática. Rev Saude Publica. 2007;41(3):453-60. DOI:10.1590/S0034-89102007000300018
11. Kleinbaum DG, Kupper LL, Müller KE, Nizam A. Applied regression analysis and other multivariable methods. 3. ed. Washington, DC: Duxbury Press; 1998.
12. Manton KG. The global impact of noncommunicable diseases: estimates and projections. World Health Stat Q. 1988;41(3-4):255-66.
13. Mendonza-Sassi RA, Béria JU. Prevalence of alcohol use disorders and associated factors: a population-based study using AUDIT in southern Brazil. Addiction. 2003;98(6):799-804. DOI:10.1046/j.1360-0443.2003.00411.x
14. Norman A, Bellocco R, Vaida F, Wolk A. Total physical activity in relation to age, body mass, health and other factors in a cohort of Swedish men. Int J Obes. 2002;26(5):670-5. DOI:10.1038/sj.ijo.0801955
15. Organización Mundial de la Salud. Cuestionario de identifi cación de los trastornos debidos al consumo de alcohol – AUDIT. Ginebra; 2001.
16. Pan SY, Cameron C, DesMeules M, Morrison H, Craig CL, Jiang XH. Individual, social, environmental, and physical environmental correlates with physical activity among Canadians: a cross-sectional study. BMC Public Health. 2009;9:21. DOI:10.1186/1471-2458-9-21
17. Santos R, Santos MP, Ribeiro JC, Mota J. Physical activity and other lifestyle behaviors in a Portuguese sample of adults: results from the Azorean Physical Activity Study. J Phys Act Health. 2009;6(6):750-9.
18. Shephard RJ. Physical activity, fi tness and health: the current consensus. Quest. 1995;47(3):288-303.
19. Silva NN. Amostragem probabilística: um curso introdutório. 2. ed. rev. São Paulo: EDUSP; 2001.
20. Soares C, Sabóia AL. Tempo, trabalho e afazeres domésticos: um estudo com base nos dados da Pesquisa Nacional por Amostra de Domicílios 2001 e 2005. Rio de Janeiro: IBGE, Coordenação de População e Indicadores Sociais; 2007. (Textos para Discussão. Diretoria de Pesquisas, 21).
21. Szklo M, Nieto FJ. Epidemiology: beyond the basics. Gaithersburg: Aspen Publisher; 2000.
22. Warburton DER, Nicol CW, Bredin SSD. Health benefi ts of physical activity: the evidence. CMAJ. 2006;174(6):801-9. DOI:10.1503/cmaj.051351
23. World Health Organization. The world health report 2002: reducing risks, promoting healthy life. Geneva; 2002.
25. World Health Organization. Obesity: preventing and managing the global epidemic: resort of a WHO Consultation. Geneva; 2000. (WHO Technical Report Series, 894).
24. World Health Organization. Preventing chronic diseases: a vital investment: WHO global report. Geneva; 2005.
REFERENCES