Epidemiology of leisure-time physical activity:
a population-based study in southern Brazil
Epidemiologia da atividade física no lazer:
um estudo de base populacional no sul do Brasil
1 Programa de Pós-graduação em Epidemiologia, Universidade Federal de Pelotas, Pelotas, Brasil. 2 MRC Childhood Nutrition Research Centre, Institute of Child Health, London, United Kingdom.
3 Departamento de Medicina Social, Universidade Federal do Rio Grande do Sul, Porto Alegre, Brasil. 4 Centro de Ciências da Saúde, Universidade do Vale do Rio dos Sinos, São Leopoldo, Brasil. Correspondence P. C. Hallal
Programa de Pós-graduação em Epidemiologia, Universidade Federal de Pelotas. Av. Duque de Caxias 250, 3oandar, Pelotas, RS 96030-002, Brasil. [email protected]
Juvenal Soares Dias-da-Costa 1 Pedro Curi Hallal 1
Jonathan Charles Kingdon Wells 2 Tiago Daltoé 1
Sandra Costa Fuchs 3
Ana Maria Baptista Menezes 1 Maria Teresa Anselmo Olinto 4
Abstract
We aimed to measure the prevalence of physical inactivity (PI) during leisure time and to identi-fy variables associated with it in a southern Brazilian adult population. A population-based cross-sectional study was carried out, covering a multiple-stage sample of 1,968 subjects aged 20-69 years. Weekly participation in leisure-time physical activity was addressed. For each activi-ty, energy expenditure was calculated using da-ta on duration, meda-tabolic equivalent, and body weight. Energy expenditures of individual activ-ities were summed to give a weekly total. PI was defined as fewer than 1,000 kilocalories per week. The prevalence of PI was 80.7% (95%CI: 78.9-82.4). After adjusted analyses, the follow-ing variables were positively associated with the outcome: female gender, age, living with a part-ner, and smoking. Schooling and economic sta-tus were inversely associated with PI. Chronical-ly undernourished individuals were significant-ly more likesignificant-ly to be inactive. We found no differences according to skin color or alcohol con -sumption. In conclusion, the prevalence of PI in this adult population was higher than in popu-lations from developed countries, but the asso-ciated variables were similar.
Exercise; Risk Factors; Adults; Life Style
Introduction
In recent decades, an economic transition has contributed to changes in the epidemiological profile of disease, with a reduction in infectious diseases and an increase in lifestyle-related ill-nesses 1. Sedentary lifestyle is a risk factor for several chronic diseases, such as coronary heart disease 2, breast cancer 3, prostate cancer 4and depression 5, and for all-cause mortality 6.
The intensity and frequency of activities can influence the magnitude of their effect on chron-ic diseases. However, even light and moderate activities are associated, for example, with a low-er risk of coronary heart disease in women 7, and moderate activities reduce all-cause mortality in men 6. Despite this evidence for the benefits of an active lifestyle for health, high percentages of many populations are not sufficiently active to obtain such health benefits 8,9,10.
Nahas 14evaluated leisure-time activity in a sample of industrial workers, and the preva-lence of inactivity was 68.1%.
This study aimed to measure the prevalence of leisure-time physical inactivity and associat-ed variables in a southern Brazilian adult pop-ulation.
Methods
Pelotas is a city of approximately 320,000 inhab-itants in the extreme South of Brazil. A cross-sectional study was conducted in the adult population (20-69 years), investigating several health-related variables, including leisure-time physical activity.
The sample size calculation used the follow-ing parameters: 95% confidence interval; 80.0% power; independent variable prevalence rang-ing from 5.0 to 50.0%; relative risk of 2.0; 70.0% estimated prevalence of leisure-time inactivity; 10.0% excess for non-response; and 15.0% ex-cess for adjusted analyses. Although these cal-culations predicted a sample of approximately 900 individuals, the final sample included 1,968 subjects, because this study (as mentioned above) was part of a larger health survey in the same population.
The sample was selected in multiple stages. At first, all 281 census tracts in the city were listed, and 40 were systematically selected for the study. Next, 30 households were systemati-cally selected in each chosen census tract. All residents in the selected households aged 20-69 years were eligible for the study.
Fieldwork was conducted from December 1999 to March 2000. A standardized pre-tested questionnaire was applied using face-to-face interviews. Interviewers were university stu-dents who underwent comprehensive training, including standardization of weight and height measurements. Interviewers were blind to the study objectives and hypotheses.
The physical activity questionnaire addressed several leisure-time activities practiced in each week of the previous month. For each activity, information concerning duration (minutes) and frequency was collected. For each activity, energy expenditure was calculated from the metabolic equivalent 15, duration of the activi-ty, and body weight. Total weekly leisure-time energy expenditure was obtained by summing the values for the individual activities. Physical inactivity in leisure time was defined as weekly energy expenditure below 1,000kcal, in accor-dance with moderate physical activity guide-lines 16.
The independent variables were: gender, age, skin color (divided into white, black, or mixed-race, as observed by the interviewer), partner status (living with or without a part -ner), schooling (in complete years), socioeconomic status (divided into five categories ac -cording to the classification of the Brazilian Na-tional Association of Research Institutes, ANEP, which considers both household assets and pa-ternal education, and where A is the highest group), body mass index (BMI, categorized as: chronic energy deficiency < 18.5kg/m2; under-weight 18.5-19.9kg/m2; normal 20.0-24.9kg/m2; overweight 25.0-29.9kg/m2; obesity ≥ 30kg/m2) 17,18, smoking (never smoked, former smoker, light/moderate smoker, or heavy smoker), and alcohol consumption (never, < 30g/day, or ≥ 30g/ day). Since subjective classification of skin col-or could lead to inconsistency, interviewers re-ceived standardized training on this issue.
The questionnaire and guidelines were test-ed in a pilot study in a census tract not includ-ed in the final sample. Weight was measurinclud-ed with a portable scale, calibrated weekly (Unis-cale, UNICEF, Copenhagen). Height was mea-sured with a locally made anthropometer with a precision of 0.1cm.
A quality control exercise was conducted in 10.0% of the sample, randomly selected. Dou-ble data entry was used in order to decrease er-rors. Poisson regression models following a hi-erarchical approach 19were used for the ad-justed analyses. The hierarchical model was divided into three levels, incorporating the fol -lowing variables: (1) gender, age, and skin col-or; (2) schooling, socioeconomic level, and part-ner status; and (3) BMI, smoking, and alcohol consumption. The association between each variable and the outcome was controlled for the variables in its same level or above in the hierarchical model 19. Poisson rather than lo-gistic regression was selected because in initial analyses the outcome was found to be com-mon, and the odds ratio provided by the logis-tic model would seriously overestimate the ac-tual prevalence ratios 20.
The Institutional Review Board/Ethics Com-mittee of the Federal University in Pelotas ap-proved the project. Informed consent was ob-tained from each participant.
Results
informa-tion on physical activity and were classified as missing values. Therefore, analyses were un -dertaken using 1,961 subjects.
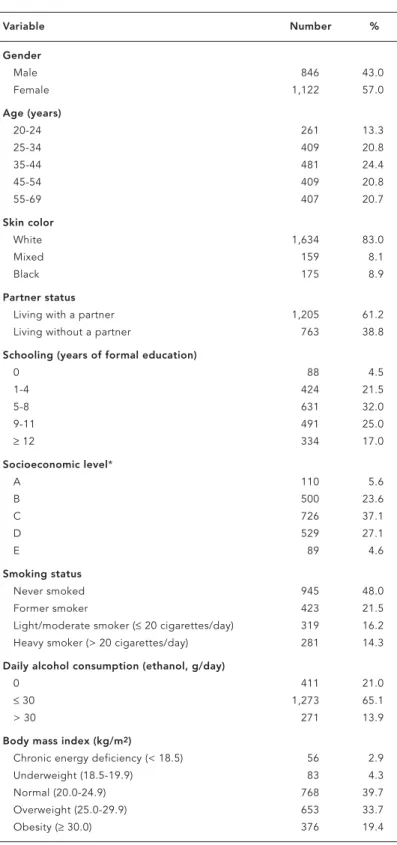
Table 1 shows a description of the sample. Mean age was 41.6 (SD 13.6) years. Thirty percent of the sample had a monthly family income be-low US$ 60. Mean schooling was 7.8 years (SD 4.4), and 17.0% had some university education. Approximately 5.0% each of the sample be -longed to socioeconomic classes A and E (high-est and low(high-est, respectively). Approximately 30.0% were current smokers, 14.0% reported high alcohol consumption, 20.0% were obese, and 3.0% presented chronic calorie deficiencies. Table 2 shows detailed data on leisure-time physical activity patterns. Prevalence of physi-cal inactivity was 80.6% (95%CI: 78.9-82.4). Distribution was positively skewed. The aver-age was 698 (SD 1792) kcal per week. More than half of the sample (58.6%) scored zero kcal per week in leisure-time physical activity.
Table 3 shows the crude prevalence of phys-ical inactivity in relation to the independent variables, and also the crude prevalence ratios and respective 95% confidence intervals. Women, those living with a partner, smokers, and those underweight or with chronic energy deficiency had a significant higher prevalence of inactivity. Also in the crude analysis, age was positively associated with low leisure-time physical activity, while schooling, economic level, and alcohol consumption were inversely related to the outcome. This analysis showed no differences in terms of skin color.
Table 4 presents the adjusted analysis using Poisson regression. The effects of gender, age, skin color, partner status, schooling, socioeco-nomic level, and smoking remained the same in the adjusted analysis. Alcohol consumption failed to remain significant after controlling for the variables in its level and in higher levels in the hierarchical model. There was a negative rela-tionship between BMI and inactivity. Individuals with low BMI were more likely to be inactive, and those overweight and obese were more active.
All analyses were repeated separately for men and women. Although the prevalence of inactivity was higher in men than women, the variables associated with inactivity were simi-lar for both sexes, and therefore these results are not shown.
Discussion
This study found a high prevalence of leisure-time inactivity and a number of demographic, socioeconomic, and behavioral factors
associ-Table 1
Description of the sample in terms of demographic, socioeconomic,
anthropometric, and behavioral variables. Pelotas, Rio Grande do Sul, Brazil, 2003.
Variable Number %
Gender
Male 846 43.0
Female 1,122 57.0
Age (years)
20-24 261 13.3
25-34 409 20.8
35-44 481 24.4
45-54 409 20.8
55-69 407 20.7
Skin color
White 1,634 83.0
Mixed 159 8.1
Black 175 8.9
Partner status
Living with a partner 1,205 61.2 Living without a partner 763 38.8
Schooling (years of formal education)
0 88 4.5
1-4 424 21.5
5-8 631 32.0
9-11 491 25.0
≥12 334 17.0
Socioeconomic level*
A 110 5.6
B 500 23.6
C 726 37.1
D 529 27.1
E 89 4.6
Smoking status
Never smoked 945 48.0
Former smoker 423 21.5
Light/moderate smoker (≤20 cigarettes/day) 319 16.2 Heavy smoker (> 20 cigarettes/day) 281 14.3
Daily alcohol consumption (ethanol, g/day)
0 411 21.0
≤30 1,273 65.1
> 30 271 13.9
Body mass index (kg/m2)
Chronic energy deficiency (< 18.5) 56 2.9
Underweight (18.5-19.9) 83 4.3
Normal (20.0-24.9) 768 39.7
Overweight (25.0-29.9) 653 33.7
Obesity (≥30.0) 376 19.4
ated with it. Such information is important for campaigns to promote physical activity.
The prevalence of individuals classified as insufficiently active to obtain health benefits (80.6%) was higher than observed in Australia (67.7%) 8, the United States (68.0%) 9, and in-dustrial workers in the Brazilian State of Santa Catarina (68.1%) 14. This difference probably stems in part from between-population differ-ences in the time available for leisure-time ac-tivity. Our study may differ from that in Santa Catarina 14because the latter only investigated workers, whereas our sample was representa-tive of the whole population and included el-derly people and those unable to work. These categories may be less able to undertake leisure-time activities and hence increase the preva-lence of inactivity in our sample.
We observed marked differences in socioe-conomic status. Our study showed a lack of leisure-time physical activity in the lowest so-cioeconomic groups, similar to several studies in developed countries 10,21,22. Our finding is consistent with the hypothesis that higher-in-come individuals are more likely (whether due to greater motivation or access to resources) to follow preventive programs and healthpro -moting behavior. Participation in leisure-time activities is reduced among lower-income indi-viduals. On the other hand, their participation in vigorous work-related activities may be
high-er than for highhigh-er-income individuals, as sug-gested recently 12.
In our study men were more active than women during their leisure time. Similar results have been widely reported 8,10,14,23,24,25. How-ever, when total physical activity was analyzed, no gender differences were found 12,13.
The positive association between activity level and age is consistent with the literature 8,21,26, showing a gradual decline in physical ac-tivity with increasing age. Retirement has been proposed as a possible explanation 27.
The relationship between physical activity and partner status has rarely been explored in the literature. An Australian study 8found that parents with dependent children had lower ac-tivity levels than non-parents, single adults, or parents with no dependent children. Both stud-ies indicate that household composition may influence physical activity, but this issue re -quires further investigation.
Various studies have linked low physical ac-tivity to obesity 28,29. Obesity develops when energy expenditure is lower than energy intake, and reduced physical activity is assumed to be an important etiological factor. However, cross-sectional studies have not always found such an association 10,12. In the present study, over-weight individuals had a significantly lower prevalence of low leisure-time activity than normal-weight individuals, and the same trend was observed in the obese, although the effect did not reach significance. Exercise is recom-mended for management of excess weight, and our findings may reflect the tendency of such individuals to follow this advice.
However, at the other end of the weight spectrum, underweight or chronically energy-deficient individuals had a higher prevalence of low activity (the effect was statistically sig-nificant in energy-deficient individuals). This could imply that poor nutritional status in this population is due to inadequate energy intake rather than high-energy expenditure. For ex-ample, low energy intake is often associated with low physical activity 30. Another possible explanation is that undernourished individuals have high physical activity levels at work (for example, as reported in malnourished Bangla-deshi mothers) 31. Thus their inactivity in leisure time may be counterbalanced by activities else-where. Alternatively, the lower activity levels of those with low BMI may be due to poorer health, as reported in Ethiopia 32. These explanations would have differing implications for public health campaigns. The prevalence of inactivity in marginally nourished populations therefore merits further research.
Table 2
Description of leisure-time physical activity (PA) patterns. Pelotas, Rio Grande do Sul, Brazil, 2003.
Parameter Value
Weekly energy expenditure in leisure time PA (kcal/week)
0-500 71.2%
501-1,000 9.4%
1,000-1,999 9.9%
≥2,000 9.4%
Average (SD) weekly energy expenditure in leisure time PA 698.2kcal/week (1,792.8)
Percentiles of weekly energy expenditure in leisure time PA
5th 0.0kcal/week
25th 0.0kcal/week
50th 0.0kcal/week
75th 665.5kcal/week
95th 3,395.8kcal/week
Skewness 5.8
Table 3
Prevalence of physical inactivity (PI) in leisure time and crude prevalence ratios (PR) for each independent variable in relation to the outcome. Pelotas, Rio Grande do Sul, Brazil, 2003.
Variable % PI PR (95%CI) p-value
Gender < 0.001*
Male 69.1 1.00
Female 89.4 1.29 (1.23-1.36)
Age (years) < 0.001**
20-24 64.1 1.00
25-34 76.1 1.19 (1.07-1.32)
35-44 85.2 1.33 (1.20-1.47)
45-54 82.9 1.29 (1.17-1.43)
55-69 88.2 1.38 (1.25-1.52)
Skin color 0.430*
White 80.3 1.00
Mixed 81.1 1.01 (0.93-1.09)
Black 84.0 1.05 (0.98-1.12)
Partner status 0.020*
Living with a partner 82.4 1.06 (1.01-1.11)
Living without a partner 78.0 1.00
Schooling (years of formal education) < 0.001**
0 93.2 1.38 (1.26-1.52)
1-4 87.9 1.30 (1.20-1.42)
5-8 82.6 1.22 (1.13-1.33)
9-11 78.6 1.16 (1.07-1.27)
≥12 67.5 1.00
Socioeconomic level***
A 64.6 1.00 < 0.001**
B 78.5 1.22 (1.05-1.41)
C 79.4 1.23 (1.07-1.42)
D 85.8 1.33 (1.15-1.53)
E 92.1 1.43 (1.23-1.66)
Smoking status 0.010*
Never smoked 78.9 1.00
Former smoker 80.2 1.02 (0.96-1.08)
Light/moderate smoker (≤20 cigarettes/day) 82.7 1.05 (0.99-1.11) Heavy smoker (> 20 cigarettes/day) 85.0 1.08 (1.02-1.14)
Daily alcohol consumption (ethanol, g/day) < 0.001**
0 86.6 1.00
≤30 79.8 0.92 (0.88-0.97)
> 30 75.1 0.87 (0.80-0.94)
Body mass index (kg/m2) 0.880**
Chronic energy deficiency (< 18.5) 92.9 1.17 (1.08-1.27) 0.001* Underweight (18.5-19.9) 84.3 1.07 (0.96-1.18)
Normal (20.0-24.9) 79.2 1.00
Overweight (25.0-29.9) 77.9 0.98 (0.93-1.04)
Obesity (≥30.0) 84.6 1.07 (1.01-1.13)
* Wald test for heterogeneity of proportions; ** Wald test for trend;
Table 4
Variables associated with physical inactivity (PI) in leisure time, with adjusted prevalence ratios (PR) and confidence in-tervals (CI). Pelotas, Rio Grande do Sul, Brazil, 2003.
Level* Variable PR (95%CI) p-value
1 Gender < 0.001**
Male 1.00
Female 1.27 (1.21-1.34)
1 Age (years) < 0.001***
20-24 1.00
25-34 1.14 (1.03-1.26)
35-44 1.27 (1.16-1.40)
45-54 1.25 (1.13-1.37)
55-69 1.32 (1.20-1.45)
1 Skin color 0.470**
White 1.00
Mixed 1.04 (0.96-1.12)
Black 1.03 (0.96-1.10)
2 Partner status
Living with a partner 1.06 (1.02-1.11) 0.007** Living without a partner 1.00
2 Schooling (years of formal education) 0.005***
0 1.14 (1.03-1.27)
1-4 1.16 (1.06-1.27)
5-8 1.15 (1.05-1.25)
9-11 1.13 (1.03-1.23)
≥12 1.00
2 Socioeconomic level**** 0.001***
A 1.00
B 1.16 (1.01-1.33)
C 1.15 (1.00-1.32)
D 1.20 (1.04-1.39)
E 1.32 (1.13-1.54)
3 Smoking status 0.010**
Never smoked 1.00
Former smoker 1.03 (0.98-1.09)
Light/moderate smoker (≤20 cigarettes/day) 1.04 (0.98-1.10) Heavy smoker (> 20 cigarettes/day) 1.11 (1.05-1.18)
3 Daily alcohol consumption (ethanol, g/day) 0.570***
0 1.00
≤30 1.01 (0.93-1.10)
> 30 0.98 (0.90-1.08)
3 Body mass index (kg/m2) 0.040***
Chronic energy deficiency (< 18.5) 1.15 (1.06-1.25) < 0.001** Underweight (18.5-19.9) 1.07 (0.97-1.17)
Normal (20.0-24.9) 1.00
Overweight (25.0-29.9) 0.94 (0.90-0.99) Obesity (≥30.0) 0.96 (0.91-1.02)
* Level of the variable in the hierarchical model; ** Wald test for heterogeneity of proportions; *** Wald test for trend;
The main limitation of this study is that it focused only on leisure-time activity and did not include activity during transportation, work, or housework. Individuals who are inactive during leisure time may be more active in oth-er contexts. For example, a Russian study 33 concluded that lack of information on trans-portation physical activities led to a 67.0% overestimate in the proportion of low physical activity. Furthermore, the proportion of time available for leisure may differ between sub-sections of the population, and it is possible that the lower activity of women compared to men may reflect differential contributions from housework. However, our results can be com-pared to those of other studies in Brazil 11,14 and elsewhere 8,9focusing on the same vari-able. A new standardized questionnaire has re-cently been developed to assess total daily ac-tivity level more comprehensively 34. One should note that our data were gathered between 1999 and 2000, and due to the fact that Brazil is un-dergoing a rapid epidemiological transition,
physical activity patterns found in our study may be changing rapidly. Therefore, similar studies are required to evaluate temporal trends. Nevertheless, as developing countries un-dergo nutritional transition and the associated industrialization, activities during leisure time will make an increasingly important contribu-tion to total activity. The high prevalence of in-activity we observed in leisure time among this largely urban population is therefore a concern. In conclusion, levels of leisure-time physi-cal activity in Pelotas, Brazil, were low, and the prevalence of inactivity was associated with various socio-demographic variables, largely consistent with the literature. Contrary to most other reports, inactivity was not more common in the obese than in the undernourished. Our study focused on individual determinants of inactivity, but we were unable to take differential access to recreational facilities into ac -count. These issues need to be addressed si-multaneously in health promotion programs.
Contributors
J. S. Dias-da-Costa coordinated the drafting of the re-search instrument and supervised the field work. P. C. Hallal headed the data analysis process and con -trolled the data quality. J. C. K. Wells led the drafting of the article. T. Daltoé supervised the field work. S. C. Fuchs oriented the overall research process and led the elaboration of the study hypotheses and ob-jectives. A. M. B. Menezes coordinated the field work organization. M. T. A. Olinto supervised the field work and elaborated the research instrument.
Resumo
O objetivo deste estudo foi avaliar a prevalência de inatividade física (IF) no lazer e fatores associados, em uma população adulta (20-69 anos), residente no sul do Brasil. Um estudo transversal de base populacional foi conduzido, com amostragem em múltiplos está-gios. A prática semanal de atividade física foi avalia-da. Para cada atividade, o gasto energético foi calcula-do usancalcula-do dacalcula-dos de duração, equivalentes metabóli-cos e peso corporal. Os gastos energétimetabóli-cos das ativi-dades foram somados para calcular-se um gasto sem-anal total. IF foi definida como gasto semsem-anal inferior a 1.000kcal/semana. A prevalência de IF foi de 80,7% (IC95%: 78,9-82,4). Após análise ajustada, as seguintes variáveis se associaram positivamente com IF: sexo feminino, idade, viver com companheiro e tabagismo. Escolaridade e nível econômico se associaram inversa-mente com IF. Indivíduos com índice de massa corpo-ral baixo (< 18,5kg/m2) apresentaram prevalência sig-nificativamente maior de IF. Não foram encontradas diferenças estatisticamente significativas de acordo com a cor da pele e consumo de álcool. A prevalência de IF nesta população adulta foi maior do que em populações de países desenvolvidos, mas as variáveis associadas foram similares.
Exercício; Fatores de Risco; Adultos; Estilo de Vida
References
1. Murray CJL, Lopez AD. Mortality by cause for eight regions of the world: global burden of dis-ease study. Lancet 1998; 349:1269-76.
2. Berlin JA, Colditz GA. A meta-analysis of physical activity in the prevention of coronary heart dis-ease. Am J Epidemiol 1990; 132:612-28.
3. Thune I, Brenn T, Lund E, Gaard M. Physical ac-tivity and the risk of breast cancer. N Engl J Med 1997; 336:1269-75.
5. Camacho TC, Roberts RE, Lazarus NB, Kaplan GA, Cohen RD. Physical activity and depression: evidence from the Alameda County Study. Am J Epidemiol 1991; 134:220-34.
6. Kujala UM, Kaprio J, Sarna S, Koskenvuo M. Rela-tionship of leisure-time physical activity and mortality: the Finnish twin cohort. JAMA 1996; 144:793-7.
7. Lee IM, Rexrode KM, Cook NR, Manson JE, Bur-ing JE. Physical activity and coronary heart dis-ease in women: is “no pain, no gain” passe? JAMA 2001; 285:1447-54.
8. Burton NW, Turrell G. Occupation, hours worked and leisure-time physical activity. Prev Med 2000; 31:673-81.
9. Martin SB, Morrow JR, Jackson AW, Dunn AL. Variables related to meeting the CDC/ACSM phys-ical activity guidelines. Med Sci Sports Exerc 2000; 32:2087-92.
10. Pomerleau J, McKee M, Robertson A, Vaasc S, Kadziauskiene K, Abaravicius A, et al. Physical in-activity in the Baltic Countries. Prev Med 2000; 31:665-72.
11. Monteiro CA, Conde WL, Matsudo SM, Matsudo VR, Bonseñor IM, Lotufo PA. A descriptive epi-demiology of leisure-time physical activity in Brazil, 1996-1997. Rev Panam Salud Publica 2003; 14:246-54.
12. Hallal PC, Victora CG, Wells JCK, Lima RC. Physi-cal inactivity: prevalence and associated vari-ables in Brazilian adults. Med Sci Sports Exerc 2003; 38:1894-900.
13. Matsudo SM, Matsudo VR, Araújo T, Andrade D, Oliveira L, Braggion G. Nível de atividade física da população do estado de São Paulo: análise de acordo com o gênero, idade, nível sócio-econô-mico, distribuição geográfica e de conhecimento. Rev Bras Ciên Mov 2002; 10:41-50.
14. Barros MV, Nahas MV. Comportamentos de risco, auto-avaliação do nível de saúde e percepção de estresse entre trabalhadores da indústria. Rev Saúde Pública 2001; 35:554-63.
15. Ainsworth BE, Haskell WL, Whitt MC, Irwin ML, Swartz AM, Strath SJ, et al. Compendium of phys-ical activities: an update of activity codes and MET intensities. Med Sci Sports Exerc 2000; 32: S498-S516.
16. U.S. Department of Health and Human Services. Physical activity and health: a report from the sur-geon general. Atlanta: National Center for Chron-ic Disease Prevention and Health Promotion; 1996.
17. Garrow GS, Webster G. Quetelet’s index (W/H2) as a measure of fatness. Int J Obes 1985; 9:147-53. 18. James WPT, Ferro-Luzzi A, Waterlow JC. Defini-tion of chronic energy deficiency in adults. Eur J Clin Nutr 1994; 42:969-81.
19. Victora CG, Huttly SR, Fuchs SC, Olinto MTA. The role of conceptual frameworks in epidemiologi-cal analysis: a hierarchiepidemiologi-cal approach. Int J Epi-demiol 1997; 26:224-7.
20. Barros AJ, Hirakata VN. Alternatives for logistic regression in cross-sectional studies: an empiri-cal comparison of models that directly estimate the prevalence ratio. BMC Med Res Methodol 2003; 3:21.
21. Ransdell LB, Wells CL. Physical activity in urban white, African-American, and Mexican-American women. Med Sci Sports Exerc 1998; 27:1608-15. 22. Ford ES, Merrit RK, Heath GW, Powell KE,
Wash-burn RA, Kriska A, et al. Physical activity behav-iors in lower and higher socioeconomic status populations. Am J Epidemiol 1991; 133:1246-56. 23. Cauley JA, Donfield SM, LaPorte RE, Warhaftig
NE. Physical activity by socioeconomic status in two population based cohorts. Med Sci Sports Ex-erc 1991; 23:343-52.
24. Van-Heuvelen MJ, Kempen GI, Ormel J, Rispens P. Physical fitness related to age and physical ac-tivity in older persons. Med Sci Sports Exerc 1998; 30:434-41.
25. Anderssen N, Jacobs DR, Sidney S, Bild DE, Stern-feld B, Slattery ML, et al. Change and secular trends in physical activity patterns in young adults: a sev-en-year longitudinal follow-up in the coronary artery risk development in young adults study (CARDIA). Am J Epidemiol 1996; 143:351-62. 26. McMurray RG, Ainsworth BE, Harrell JS, Griggs
TR, Williams OD. Is physical activity or aerobic power more influential on reducing cardiovascu-lar disease risk factors? Med Sci Sports Exerc 1998; 30:1521-9.
27. Evenson KR, Rosamond WD, Cai J, Diez-Roux AV, Brancati FL. Influence of retirement on leisure-time physical activity: the atherosclerosis risk in communities study. Am J Epidemiol 2002; 15:692-9. 28. Abdul-Rahim HF, Holmboe-Ottesen G, Stene LC, Husseini A, Giacaman R, Jervell J, et al. Obesity in a rural and an urban Palestinian West Bank popu-lation. Int J Obes 2003; 27:140-6.
29. Hu G, Pekkarinen H, Hanninen O, Tian H, Jin R. Comparison of dietary and non-dietary risk fac-tors in overweight and normal-weight Chinese adults. Br J Nutr 2002; 88:91-7.
30. Shetty PS. Adaptation to low energy intakes: the responses and limits to low intakes in infants, chil-dren and adults. Eur J Clin Nutr 1999; 53:S14-33. 31. Vinoy S, Rosetta L, Mascie-Taylor CG. Repeated
measurements of energy intake, energy expendi-ture and energy balance in lactating Bangladeshi-mothers. Eur J Clin Nutr 2000; 54:579-85. 32. Alemu T, Lindtjorn B. Physical activity, illness and
nutritional status among adults in a rural Ethiopi-an community. Int J Epidemiol 1995; 24:977-83. 33. Tudor-Locke C, Neff LJ, Ainsworth BE, Addy CL,
Popkin BM. Omission of active commuting to school and the prevalence of children’s health-re-lated physical activity levels: the Russian Longi-tudinal Monitoring Study. Child Care Health Dev 2002; 28:507-12.
34. Craig CL, Marshall Al, Sjostrom M, Bauman AE, Booth ML, Ainsworth BE, et al. International Phys-ical Activity Questionnaire: 12-Country Reliabili-ty and ValidiReliabili-ty. Med Sci Sports Exerc 2003; 35: 1381-95.
Submitted on 13/Jan/2004