Radiol Bras. 2014 Set/Out;47(5):292–300 292
Multiparametric magnetic resonance imaging of the prostate:
current concepts
*
Ressonância magnética multiparamétrica da próstata: conceitos atuais
Bittencourt LK, Hausmann D, Sabaneeff N, Gasparetto EL, Barentsz JO. Multiparametric magnetic resonance imaging of the prostate: current concepts. Radiol Bras. 2014 Set/Out;47(5):292–300.
Abstract
R e s u m o
Multiparametric MR (mpMR) imaging is rapidly evolving into the mainstay in prostate cancer (PCa) imaging. Generally, the examination consists of T2-weighted sequences, diffusion-weighted imaging (DWI), dynamic contrast-enhanced (DCE) evaluation, and less often proton MR spectroscopy imaging (MRSI). Those functional techniques are related to biological properties of the tumor, so that DWI correlates to cellularity and Gleason scores, DCE correlates to angiogenesis, and MRSI correlates to cell membrane turnover. The combined use of those techniques enhances the diagnostic confidence and allows for better characterization of PCa. The present article reviews and illustrates the technical aspects and clinical applications of each component of mpMR imaging, in a practical approach from the urological standpoint.
Keywords: Prostate cancer; Magnetic resonance imaging; Diffusion-weighted imaging; Dynamic contrast enhancement.
O estudo por ressonância magnética multiparamétrica, ou funcional, vem evoluindo para se tornar o pilar fundamental no manejo diag-nóstico de pacientes com câncer de próstata. Geralmente, o exame consiste em imagens pesadas em T2, difusão, realce dinâmico pelo contraste (permeabilidade), e cada vez menos frequentemente espectroscopia de prótons. Tais técnicas funcionais relacionam-se com propriedades biológicas do tumor, de modo que a difusão se relaciona com a celularidade e os escores de Gleason, a permeabilidade se relaciona com a angiogênese, e a espectroscopia de prótons se relaciona com o metabolismo da membrana celular. O uso destas técnicas em combinação aumenta a confiança diagnóstica e permite uma melhor caracterização do câncer de próstata. Este artigo tem o objetivo de revisar e ilustrar os aspectos técnicos e as aplicações clínicas de cada componente do estudo de ressonância magnética multiparamétrica da próstata, mediante uma abordagem prática.
Unitermos: Câncer de próstata; Ressonância magnética; Imagem por difusão; Realce dinâmico por contraste.
* Study developed at CDPI and Multi-Imagem Clinics, Rio de Janeiro, RJ, Brazil, Universidade Federal do Rio de Janeiro (UFRJ), Rio de Janeiro, RJ, Brazil, and Radboud University Medical Center, Nijmegen, Netherlands.
1. PhD, Associate Professor of Radiology, Universidade Federal Fluminense (UFF), Niterói, RJ, Brazil, Titular Member, Colégio Brasileiro de Radiologia e Diag-nóstico por Imagem (CBR), Radiologist at CDPI and Multi-Imagem Clinics, Rio de Janeiro, RJ, Brazil.
2. MD, Resident, Institute of Clinical Radiology and Nuclear Medicine, Medical Faculty Mannheim, Heidelberg University, Mannheim, Germany.
3. Titular Member, Colégio Brasileiro de Radiologia e Diagnóstico por Imagem (CBR), Radiologist at CDPI Clinic, Rio de Janeiro, RJ, Brazil.
4. PhD, Associate Professor, Department of Radiology, Universidade Federal do Rio de Janeiro (UFRJ), Radiologist at CDPI and Multi-Imagem Clinics, Rio de Janeiro, RJ, Brazil.
5. PhD, Chair of Research and Professor, Department of Radiology, Radboud University Medical Center, Nijmegen, Netherlands.
Mailing Address: Dr. Leonardo Kayat Bittencourt. Avenida das Américas, 4666, sala 325, Centro Médico Barrashopping, Barra da Tijuca. Rio de Janeiro, RJ, Brazil, 22640-102. E-mail: [email protected].
Received July 15, 2013. Accepted after revision November 18, 2013.
examination (DRE), being both considered of limited accu-racy in establishing a disease-specific diagnosis(1,2), and oc-casionally leading to overdiagnosis and overtreatment(3,4).
In such a context, the diagnostic imaging modalities are increasingly being used as a means to refine the detection and staging of PCa, and to ultimately provide a better treat-ment selection. Consequently, there has been a constant in-crease in the interest of the radiological community for pros-tate imaging modalities, with many studies also recently published in Brazil(5–8). Among those modalities, magnetic resonance (MR) imaging stands out as the most robust and the one that is better related to the clinical outcomes involved on the management of PCa. This review evaluates the role of prostate MR imaging and its functional techniques on the detection, staging and risk assessment of PCa.
MAGNETIC RESONANCE IMAGING
MR imaging is an imaging modality that does not in-volve ionizing radiation, and provides high resolution im-ages with excellent soft-tissue contrast. The contrast-media employed is based on gadolinium chelates that show a better immunoallergenic profile than iodinated media. However, due to the risk of nephrogenic systemic fibrosis, caution
Leonardo Kayat Bittencourt1, Daniel Hausmann2, Natalia Sabaneeff3, Emerson Leandro Gasparetto4,
Jelle O. Barentsz5
INTRODUCTION
should be taken on the use of gadolinium based agents in patients with impaired renal function (i.e., creatinine clear-ance < 30 ml/min/1.73 m2
).
The examination is carried out with high field strength scanners, with either 1.5 T or 3.0 T, using a pelvic surface coil to maximize the signal in the region of interest. The use of an endorectal coil is under debate, and most of the insti-tutions currently relegate its use only for staging purposes, according to a recent consensus statement(9). Taking into account that hemorrhage is a potentially confounding factor for misdiagnosis of PCa, an interval of 6–8 weeks between the biopsy session and MR imaging examination is usually advised in order to allow appropriate MR spectroscopy im-aging (MRSI) acquisition and to prevent potential degrada-tion of diffusion-weighted imaging (DWI) signal(10). The patients are asked to refrain from sexual activities 72 hours prior to the examination, in order to distend the seminal vesicles and improve its visualization. At least a 4-hour fast-ing interval is recommended, and the patients are instructed to empty the bladder one hour before the examination. Also, scopolamine (Buscopan®
) is administered immediately be-fore the examination, in order to attenuate peristalsis and minimize motion artifacts.
As an imaging modality, MR imaging enables the as-sessment of prostatic disease with a much higher spatial reso-lution than any other technique. Consequently, MR imag-ing has evolved as a powerful modality in the localization and staging of PCa with a much better performance than DRE or transrectal ultrasonography (TRUS)(11). Recent advances combine functional techniques with the already established anatomical imaging sequences based on T1- and T2-weigh-ing, resulting in a multiparametric sequence protocol.
T2-weighted (T2w) imaging constitutes the backbone of prostate imaging, providing anatomical details and show-ing suspicious lesions with high spatial resolution. Among the functional techniques, DWI(12), dynamic contrast en-hancement (DCE) evaluation(13), and proton spectroscopy(14) are part of routine clinical studies, and will be further ex-plained throughout this article.
T2-weighted imaging findings
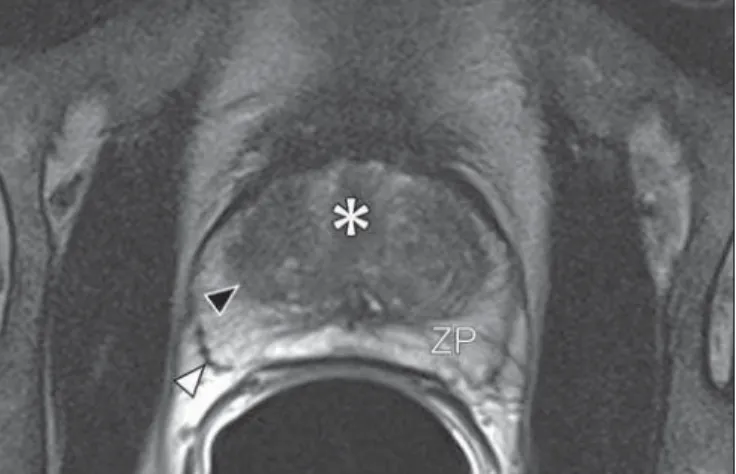
On T2w images in the axial plane(15) (Figure 1), the normal peripheral zone demonstrates a homogeneous high-signal intensity background with a “crescent” or “bullhorn shape”. The prostatic capsule is defined by a thin, hypointense line which is an important landmark for tumor staging. In the absence of benign prostatic hyperplasia (BPH), the cen-tral, transitional and periurethral zones are indistinguishable from each other, thus being usually referred to in combina-tion as “central” or “internal” gland. The healthy internal gland is characterized by intermediate signal intensity on T2w images. Encircling the central gland lays the “surgical cap-sule”, a thin T2-hypointense layer that separates the inner portion from the peripheral zone, and represents an impor-tant landmark for BPH surgery.
At morphologic T2w images, PCa is characterized by the presence of focal hypointense lesions, frequently with nodular or oval shape, that either replace the normal hyperintense signal of the peripheral zone, or the usual het-erogeneous pattern of the internal gland(16) (Figure 2). This finding is considered highly sensitive (> 90%) for the detec-tion of PCa with Gleason scores of 7 or higher, but it should
Figure 1. MR imaging of the normal prostate. T2-weighted sequence in the axial plane showing the prostate capsule (white arrowhead), the peripheral zone (ZP), the surgical capsule (black arrowhead) and internal gland (asterisk).
be known that this sensitivity drops significantly for Gleason scores of 6 or lower. Most importantly, specificity of T2w images alone is limited because hemorrhage, prostatitis, scars, atrophy, post-radiation changes, post-cryoablation sta-tus, and also hormone therapy may show up as focal low signal intensities in the peripheral zone.
The diagnosis of PCa in the central zone by means of conventional anatomical sequences poses an even greater challenge, given the heterogeneity of the region and the wide
spectrum of changes attributable to BPH. Thus, a number of criteria based on pattern-recognition algorithms have been described(17), as follows: ill-defined homogeneous T2-hypoin-tense focal lesion replacing the normal background (“erased charcoal sign”); spiculated or ill-defined margins; anteriorly located lesion; lenticular or spindle-like shape; loss of the T2-hypointense contour of BPH nodules; loss of definition of the surgical capsule; or signs of urethral invasion (Figure 3). However, focal T2-hypointense areas may still be nor-mally observed in the central gland as predominantly stro-mal BPH, or either as prominence of the anterior fibromus-cular stroma. Many different studies investigating the accu-racy of conventional MR imaging in the detection of central gland tumors have almost universally reported low sensitiv-ity, low specificity and high interobserver variability(18).
Regarding local staging of PCa, the most important is-sue is to differentiate between organ-confined disease (T1 and T2 stages) or locally advanced tumor, either as extra-capsular extension (T3a) or as seminal vesicle invasion (T3b), in order to choose the right treatment plan. The imaging criteria for extracapsular extension include: neurovascular bundle asymmetry; macroscopic tumor involvement of the neurovascular bundle; focal bulging of the prostatic contour, spiculation or irregularity of prostatic contour; obliteration of the recto-prostatic angle; capsular retraction; contact of the tumor focus with prostatic capsule wider than 1,0 cm; and signs of capsular rupture with direct tumor extension to the periprostatic fat(19,20) (Figure 4).
Findings that indicate seminal vesicle invasion include: focal low signal intensity in the interior or along a seminal
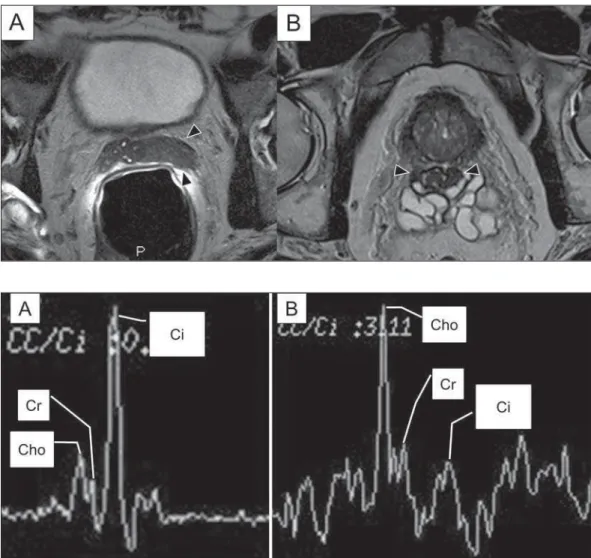
Figure 4. T2-weighted MR images of the prostate, showing typical findings of extra-capsular tumor extension marked by arrow-heads in the following examples: asymme-try of the neurovascular bundle (A), tumor involvement of the neurovascular bundle (B), spiculated contour of the prostatic capsule (C), and focal bulging on the contour of the prostatic capsule (D).
vesicle; T2 hypointense and enlarged seminal vesicle; T2 hypointense and enlarged ejaculatory duct; obliteration of the bladder/prostate angle; and direct tumor extension form the prostatic base to the seminal vesicle, this latter being one the most positive predictive finding(21) (Figure 5).
The conventional anatomical MR imaging techniques demonstrate a wide spectrum of reported sensitivities (13– 95%) and specificities (49–97%) among many different studies for the detection of extracapsular extension. Similarly, the sensitivities (23–80%) and specificities for the detection of seminal vesicle invasion also show wide variation(17). There-fore, those intrinsic limitations and variations in the results of conventional techniques underscore the need for a multi-parametric approach in prostate MR imaging, combining the anatomical findings with those of the functional techniques.
Functional techniques Proton spectroscopy
MR spectroscopic imaging (MRSI) has been widely used as a biomarker for the detection and characterization of tu-mors, including PCa(22). This technique aims to estimate the concentration of certain substances and metabolites in a given biological tissue, by means of MR imaging. The sampled metabolites are represented by “spikes” or “peaks” in a
spec-trum, and the relationship among their concentrations is used to establish the diagnosis (Figure 6).
Among the metabolites usually studied in prostate spec-troscopy, citrate is found in high concentrations (> 60 mM) in normal prostate epithelium and prostatic fluid, being also observed in low concentrations in other locations of the gland(23). Decreased levels of citrate are characteristically seen in PCa, but also in areas of prostatitis and bleeding.
Choline represents a compound of cell membrane lip-ids. Choline concentrations are generally elevated in PCa, due to a higher cell-membrane turnover and an increased cell-membrane surface/cell-volume ratio. A true increase in choline peak is considered the spectral signature of malig-nancy(24), but this may also be observed in prostatitis(25) to a lesser extent.
Other metabolites in prostate MRSI include creatine, which has no direct correlation with PCa and is primarily used as a reference point; and polyamine, which is detected only at 3 T and may be decreased in PCa.
However, considering that the spectrum does not provide measurable absolute concentrations of metabolites, ratios and comparisons are employed for the evaluation of metabolite peaks. Among those, the most notorious ratio is calculated by the formula (choline + creatine) / citrate. This ratio is used
Figure 6. Examples of MRSI pros-tate spectra. A: Typical spectral analysis of normal prostate tissue, showing a high citrate (Ci) peak, with a low choline (Cho) peak, and the peak of creatine (Cr) used as comparison parameter for the other metabolites. On B, we observe the spectral signature of typical ag-gressive PCa, with a high choline (Cho) peak and low citrate (Ci) lev-els.
as a marker for malignancy, especially for the peripheral zone.
Although MRSI is promising as a high-specific method, it significantly lacks sensitivity. A recent multicenter study evaluated the incremental value of MRSI at 1.5 T over con-ventional T2w images on the localization of PCa, and found no benefit from MRSI information in terms of performance and accuracy gain(14). The results of this important study, combined with the very low interobserver agreement, the considerably long acquisition time and the complexity of post-processing, have led to the downgrading of MRSI to the status of an ancillary and optional technique in most centers that investigate prostate imaging.
Dynamic contrast enhancement (DCE)
DCE evaluation is a functional MR imaging technique that enables the calculation of parameters that are intimately related to the microvascular properties of tissue angiogen-esis. In PCa, an increase in tumor vascularity expressed by an enhancement pattern with intense and early contrast-me-dia wash-in, followed by intense and early wash-out, unlike normal peripheral zone tissue that shows slow, mild and pro-gressive wash-in. Benign diseases, such as prostatitis and BPH, may also lead to regional changes in the enhancement pattern, although to lower extent(26) (Figure 7).
DCE evaluation is based on T1w sequences that are re-peatedly acquired before, during and after contrast-media
ad-ministration, encompassing the whole prostate gland, with a high temporal resolution. Multiple acquisitions are ob-tained, up to 4–8 minutes. Then, images are post-processed in specific applications, with either a semi-quantitative or a quantitative approach, that usually enable the generation of enhancement curves and color parametric maps for better understanding by non-radiologists and better communica-tion of the results. On those parametric maps, pixels have colors according to a hemodynamic parameter analyzed (i.e., positive enhancement integral, wash-in rate, maximum in-tensity pixel, ktrans, kep, etc.), and suspicious lesions mani-fest as focal and asymmetric areas with high signal intensity in the chosen color spectrum. Moreover, it is possible to superimpose or fuse those color maps to the original T2w images, thus increasing the degree of confidence by the ex-act topographic correlation of anatomical and functional find-ings (Figure 8).
Regardless of the choice between a semi-quantitative and a quantitative model, DCE evaluation has shown strong evi-dence for good performance in the diagnosis of PCa. It has been demonstrated that, among others, DCE is significantly better than conventional T2-weighted images in the local-ization of tumor foci(27–29), and that it increases the accu-racy in the detection of extracapsular extension and seminal vesicle involvement by less experienced radiologists(30). Thus, the use of DCE is definitely well indicated, and is a fundamental part of multiparametric prostate MR imaging.
Figure 7. Signal intensity versus time curve in a typical tumor lesion.The im-age A represents the early arterial phase of DCE evaluation, showing a focal area of early contrast enhancement in the pe-ripheral zone at right (outlined by the red line). Normal appearing areas were also outlined in the contralateral peripheral zone (yellow) and internal gland (green). The resulting curves (B) show that the suspicious lesion (red curve) is charac-terized by a high and steep rise (washin), flowed by a marked decrease (washout), with a significantly different behavior from the other curves.
Diffusion-weighted imaging (DWI)
DWI studies the random movement of water molecules in different physical media, also known as “Brownian move-ments”. In biological tissues, these movements are impeded at different amounts by interactions with other molecules and cell structures, or even by cellular density. Consequently, a method that assesses water diffusion properties has ultimately the potential to indirectly estimate information related to the composition of a certain tissue, its cellular density, tissue microperfusion, or even the viability of cell membranes(31). In the clinical practice, those properties have taken DWI into the category of a noninvasive imaging biomarker in oncol-ogy, with many already proven applications in tumor detec-tion, staging and response evaluation(32).
DWI is an imaging sequence that does not require con-trast-media administration, and is carried out in approxi-mately 5 minutes during prostate MRI examinations. The sequence generates many image sets according to the num-ber of diffusion factors or “b-factors” chosen. The scanner also generates an apparent diffusion coefficient (ADC) map, which is a set of images that enable the quantification of diffusion properties. Thus, a lesion with impeded (or “restricted”) diffusion appears as a hypointense area on the ADC map, reflecting a low diffusion coefficient, or low “ADC values”. The healthy prostate tissue is rich in tubular fluid-filled structures, allowing for unimpeded diffusion of water mol-ecules in their interior, manifesting by high ADC values. In the majority of cases, the peripheral zone can be easily dis-cerned from the central gland at DWI, owing to its homoge-neously higher ADC values(33–35) (Figure 9). BPH leads to the development of adenomatous nodules in the transitional
Figure 9. ADC map of the same patient from Figure 1, showing excellent distinc-tion of the zonal anatomy. The normal peripheral zone (ZP) shows high ADC values relative to the normal internal gland (GI). This fact probably explains the great utility of DWI in detecting tumors in the peripheral zone, which present themselves as foci of restricted diffusion (i.e., “dark lesions”) over a region with facilitated (i.e., “bright”) diffusion.
zone, which over time compress the central zone, making it a difficult task to accurately define the zonal anatomy of the central gland at MR imaging(15). This heterogeneity is also manifested in water diffusion properties in BPH, being clas-sically expressed at MR imaging as foci of low ADC values interspersed with areas of high ADC values(36).
PCa is histologically characterized by a higher cell-den-sity and a higher nucleus/cytoplasm ratio as compared with the surrounding healthy prostate tissue, with substitution of the glandular parenchyma by tumor cells. This causes im-peded diffusion, with a marked reduction in the ADC values relative to the healthy prostate tisue(12,37,38) (Figure 10).
Moreover, while well-differentiated tumors may in some way maintain their tubular architecture, poorly-differentiated or aggressive tumors exhibit prominent cell components, with derangement of tubular architecture, and consequently gen-erating potential differences in diffusion properties and ADC measurements between those two categories(39–44).
Most studies have evaluated the usefulness of DWI in the detection of PCa in the peripheral zone. Many of those studies reported better performance for lesion detection in comparison with T2w images, either by the use of DWI alone, or in combination with conventional sequences(45). Other studies have demonstrated that the combination of T2w and DWI findings achieve a sensitivity in the range of 45– 89% and specificity of 61–97%, as compared with 74–85% and 57–95% for DWI alone, or 25–87% and 57–92% for T2w alone(36,45–52).
As regards the detection of lesions in the central gland, DWI has the potential to complement T2w imaging find-ings(53), since it is already known that, in PCa, the ADC values are generally lower than those of the healthy central gland(53,54) and of BPH nodules(36), but with smaller sensi-tivity than for the peripheral zone.
In terms of local staging, the identification of minimal extra-capsular extension requires high-resolution anatomi-cal images(17), that usually overcome the spatial properties of currently available DWI sequences. Conversely, the use-fulness of DWI is already well demonstrated for the evalua-tion of seminal vesicle involvement (SVI)(55,56), with higher specificity (97%) and accuracy (96%) for the combination of DWI and T2w, as compared with the specificity (87%) and accuracy (87%) of T2w alone. Although so far unconfirmed by the literature, in this same indication, there may also be a role for the use of fused ADC maps and T2w images, which may potentially add confidence to the diagnosis.
im-aging modalities, DWI is probably the one with the highest potential to correlate with the degree of tumor aggressive-ness, since the same factors that lead to a higher Gleason score (e.g., high cellularity, loss of tubular architecture) also promote restriction to water diffusion, and consequently low ADC values(37).
Recently, a study developed by Bittencourt et al. dem-onstrated a significant negative correlation between ADC values in PCa and the respective Gleason scores(62) in pros-tatectomy specimens. Moreover, this same study found that DWI outperformed even the prostate biopsy specimens in the estimation of PCa aggressiveness. Nevertheless, until this moment, all of the studies have also observed a significant overlap of ADC values along the different Gleason scores. Therefore, it is postulated that the present role of DWI in the evaluation of tumor aggressiveness is mainly the guid-ance for collection of biopsy specimens 63) and the integra-tion to risk assessment nomograms(64).
CONCLUSION
In conclusion, multiparametric prostate MR imaging is now a reality in the clinical practice, with solid and well es-tablished data regarding tumor detection and staging. DCE and DWI are robust functional techniques that should be included in every examination, increasing the accuracy and reliability of the imaging findings provided by the anatomi-cal T2w images. Large prospective studies are also ongoing, aiming at correlating MR imaging findings with long-term clinical outcomes, cancer screening and follow-up of active surveillance patients.
REFERENCES
1. Meeks JJ, Loeb S, Helfand BT, et al. Characteristics of prostate cancers detected at prostate specific antigen levels less than 2.5 ng/ ml. J Urol. 2009;181:2515–9.
2. Okotie OT, Roehl KA, Han M, et al. Characteristics of prostate cancer detected by digital rectal examination only. Urology. 2007; 70:1117–20.
3. Andriole GL, Crawford ED, Grubb RL 3rd, et al. Mortality results from a randomized prostate-cancer screening trial. N Engl J Med. 2009;360:1310–9.
4. Schröder FH, Hugosson J, Roobol MJ, et al. Screening and pros-tate-cancer mortality in a randomized European study. N Engl J Med. 2009;360:1320–8.
5. Franca CAS, Vieira SL, Carvalho ACP, et al. Relationship between two year PSA nadir and biochemical recurrence in prostate cancer patients treated with iodine-125 brachytherapy. Radiol Bras. 2014; 47:89–93.
6. Solha RS, Ajzen S, De Nicola H, et al. Morbidade da biópsia da próstata transretal guiada por ultrassonografia. Radiol Bras. 2013; 46:71–4.
7. Tyng CJ, Maciel MJS, Moreira BL, et al. Preparo e manejo de com-plicações em biópsias de próstata. Radiol Bras. 2013;46:367–71. 8. Milito MA. Transrectal ultrasound guided prostate biopsy: are
com-plications and morbidity underestimated? Radiol Bras. 2013;46(2): vii.
9. Barentsz JO, Richenberg J, Clements R, et al. ESUR prostate MR guidelines 2012. Eur Radiol. 2012;22:746–57.
10. Qayyum A, Coakley FV, Lu Y, et al. Organ-confined prostate can-cer: effect of prior transrectal biopsy on endorectal MRI and MR spectroscopic imaging. AJR Am J Roentgenol. 2004;183:1079– 83.
11. Mullerad M, Hricak H, Kuroiwa K, et al. Comparison of endorectal magnetic resonance imaging, guided prostate biopsy and digital rectal examination in the preoperative anatomical localization of prostate cancer. J Urol. 2005;174:2158–63.
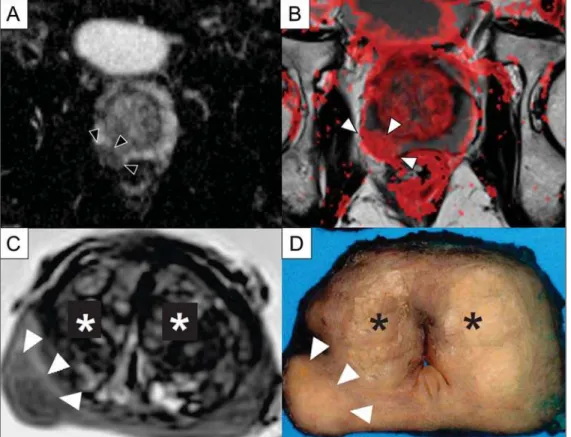
Figure 10. Detection of PCa with DWI. ADC map of the same patient in Figure 7 (A) showing a suspicious hypointense focal lesion in the right peripheral zone (arrowheads), determining restricted water diffusion, with ADC values around 750 × 10–6 mm/s2, while the
contralat-eral periphcontralat-eral zone exhibits ADC values in the range of 1,600 × 10–6 mm/s2.
The fusion of information from DWI with T2-weighted images (B) shows that the lesion detected on ADC map, coded in red (arrowheads) has topographic cor-respondence with suspicious areas on T2-weighted image. The patient under-went radical prostatectomy, and the surgical specimen was sent for ex vivo
MR examination (C), which showed a suspicious lesion (arrowhead) in the same region as of preoperative MR ex-amination. The whole mount specimen at the same level and orientation of the MR images (D) also shows the tumor area (arrowhead) on the same location indicated by MR images. Asterisks on C
12. Tan CH, Wang J, Kundra V. Diffusion weighted imaging in pros-tate cancer. Eur Radiol. 2011;21:593–603.
13. Franiel T, Hamm B, Hricak H. Dynamic contrast-enhanced mag-netic resonance imaging and pharmacokimag-netic models in prostate cancer. Eur Radiol. 2011;21:616–26.
14. Weinreb JC, Blume JD, Coakley FV, et al. Prostate cancer: sextant localization at MR imaging and MR spectroscopic imaging before prostatectomy – results of ACRIN prospective multi-institutional clinicopathologic study. Radiology. 2009;251:122–33.
15. Hricak H, Dooms GC, McNeal JE, et al. MR imaging of the prostate gland: normal anatomy. AJR Am J Roentgenol. 1987;148:51–8. 16. Bezzi M, Kressel HY, Allen KS, et al. Prostatic carcinoma: staging
with MR imaging at 1.5 T. Radiology. 1988;169:339–46. 17. Hricak H, Choyke PL, Eberhardt SC, et al. Imaging prostate
can-cer: a multidisciplinary perspective. Radiology. 2007;243:28–53. 18. Akin O, Sala E, Moskowitz CS, et al. Transition zone prostate
can-cers: features, detection, localization, and staging at endorectal MR imaging. Radiology. 2006;239:784–92.
19. Outwater EK, Petersen RO, Siegelman ES, et al. Prostate carci-noma: assessment of diagnostic criteria for capsular penetration on endorectal coil MR images. Radiology. 1994;193:333–9. 20. Yu KK, Scheidler J, Hricak H, et al. Prostate cancer: prediction of
extracapsular extension with endorectal MR imaging and three-di-mensional proton MR spectroscopic imaging. Radiology. 1999;213: 481–8.
21. Sala E, Akin O, Moskowitz CS, et al. Endorectal MR imaging in the evaluation of seminal vesicle invasion: diagnostic accuracy and multivariate feature analysis. Radiology. 2006;238:929–37. 22. Heerschap A, Jager GJ, van der Graaf M, et al. Proton MR
spectros-copy of the normal human prostate with an endorectal coil and a double spin-echo pulse sequence. Magn Reson Med. 1997;37:204– 13.
23. Yacoe ME, Sommer G, Peehl D. In vitro proton spectroscopy of normal and abnormal prostate. Magn Reson Med. 1991;19:429– 38.
24. Podo F. Tumour phospholipid metabolism. NMR Biomed. 1999; 12:413–39.
25. Shukla-Dave A, Hricak H, Eberhardt SC, et al. Chronic prostati-tis: MR imaging and 1H MR spectroscopic imaging findings – ini-tial observations. Radiology. 2004;231:717–24.
26. Padhani AR, Harvey CJ, Cosgrove DO. Angiogenesis imaging in the management of prostate cancer. Nat Clin Pract Urol. 2005;2: 596–607.
27. Fütterer JJ, Heijmink SW, Scheenen TW, et al. Prostate cancer localization with dynamic contrast-enhanced MR imaging and pro-ton MR spectroscopic imaging. Radiology. 2006;241:449–58. 28. Ocak I, Bernardo M, Metzger G, et al. Dynamic contrast-enhanced
MRI of prostate cancer at 3 T: a study of pharmacokinetic param-eters. AJR Am J Roentgenol. 2007;189:849.
29. Tanaka N, Samma S, Joko M, et al. Diagnostic usefulness of endorectal magnetic resonance imaging with dynamic contrast-en-hancement in patients with localized prostate cancer: mapping stud-ies with biopsy specimens. Int J Urol. 1999;6:593–9.
30. Fütterer JJ, Engelbrecht MR, Huisman HJ, et al. Staging prostate cancer with dynamic contrast-enhanced endorectal MR imaging prior to radical prostatectomy: experienced versus less experienced read-ers. Radiology. 2005;237:541–9.
31. Bittencourt LK, Matos C, Coutinho AC Jr. Diffusion-weighted magnetic resonance imaging in the upper abdomen: technical is-sues and clinical applications. Magn Reson Imaging Clin N Am. 2011;19:111–31.
32. Padhani AR, Liu G, Koh DM, et al. Diffusion-weighted magnetic resonance imaging as a cancer biomarker: consensus and recom-mendations. Neoplasia. 2009;11:102–25.
33. Kim CK, Park BK, Han JJ, et al. Diffusion-weighted imaging of the prostate at 3 T for differentiation of malignant and benign tis-sue in transition and peripheral zones: preliminary results. J Comput Assist Tomogr. 2007;31:449–54.
34. Kumar V, Jagannathan NR, Kumar R, et al. Apparent diffusion co-efficient of the prostate in men prior to biopsy: determination of a cut-off value to predict malignancy of the peripheral zone. NMR Biomed. 2007;20:505–11.
35. Tamada T, Sone T, Toshimitsu S, et al. Age related and zonal ana-tomical changes of apparent diffusion coefficient values in normal human prostatic tissues. J Magn Reson Imaging. 2008;27:552–6. 36. Ren J, Huan Y, Wang H, et al. Diffusion-weighted imaging in
nor-mal prostate and differential diagnosis of prostate diseases. Abdom Imaging. 2008;33:724–8.
37. Anderson AW, Xie J, Pizzonia J, et al. Effects of cell volume frac-tion changes on apparent diffusion in human cells. Magn Reson Im-aging. 2000;18:689–95.
38. Bonekamp D, Jacobs MA, El-Khouli R, et al. Advancements in MR imaging of the prostate: from diagnosis to interventions. Radio-graphics. 2011;31:677–703.
39. de Souza NM, Reinsberg SA, Scurr ED, et al. Magnetic resonance imaging in prostate cancer: the value of apparent diffusion coeffi-cients for identifying malignant nodules. Br J Radiol. 2007;80:90–5. 40. Itou Y, Nakanishi K, Narumi Y, et al. Clinical utility of apparent diffusion coefficient (ADC) values in patients with prostate cancer: can ADC values contribute to assess the aggressiveness of prostate cancer? J Magn Reson Imaging. 2011;33:167–72.
41. Tamada T, Sone T, Jo Y, et al. Apparent diffusion coefficient val-ues in peripheral and transition zones of the prostate: comparison between normal and malignant prostatic tissues and correlation with histologic grade. J Magn Reson Imaging. 2008;28:720–6. 42. Turkbey B, Shah VP, Pang Y, et al. Is apparent diffusion coefficient
associated with clinical risk scores for prostate cancers that are vis-ible on 3-T MR images? Radiology. 2011;258:488–95.
43. Verma S, Rajesh A, Morales H, et al. Assessment of aggressiveness of prostate cancer: correlation of apparent diffusion coefficient with histologic grade after radical prostatectomy. AJR Am J Roentgenol. 2011;196:374–81.
44. Woodfield CA, Tung GA, Grand DJ, et al. Diffusion-weighted MRI of peripheral zone prostate cancer: comparison of tumor apparent diffusion coefficient with Gleason score and percentage of tumor on core biopsy. AJR Am J Roentgenol. 2010;194:W316–22. 45. Mazaheri Y, Hricak H, Fine SW, et al. Prostate tumor volume
mea-surement with combined T2-weighted imaging and diffusion-weighted MR: correlation with pathologic tumor volume. Radiol-ogy. 2009;252:449–57.
46. Haider MA, van der Kwast TH, Tanguay J, et al. Combined T2-weighted and diffusion-T2-weighted MRI for localization of prostate cancer. AJR Am J Roentgenol. 2007;189:323–8.
47. Kajihara H, Hayashida Y, Murakami R, et al. Usefulness of diffu-sion-weighted imaging in the localization of prostate cancer. Int J Radiat Oncol Biol Phys. 2009;74:399–403.
48. Kim CK, Park BK, Lee HM, et al. Value of diffusion-weighted im-aging for the prediction of prostate cancer location at 3T using a phased-array coil: preliminary results. Invest Radiol. 2007;42:842– 7.
49. Lim HK, Kim JK, Kim KA, et al. Prostate cancer: apparent diffu-sion coefficient map with T2-weighted images for detection – a multireader study. Radiology. 2009;250:145–51.
50. Morgan VA, Kyriazi S, Ashley SE, et al. Evaluation of the potential of diffusion-weighted imaging in prostate cancer detection. Acta Radiol. 2007;48:695–703.
52. Yoshimitsu K, Kiyoshima K, Irie H, et al. Usefulness of apparent diffusion coefficient map in diagnosing prostate carcinoma: corre-lation with stepwise histopathology. J Magn Reson Imaging. 2008; 27:132–9.
53. Sato C, Naganawa S, Nakamura T, et al. Differentiation of non-cancerous tissue and cancer lesions by apparent diffusion coeffi-cient values in transition and peripheral zones of the prostate. J Magn Reson Imaging. 2005;21:258–62.
54. Van As N, Charles-Edwards E, Jackson A, et al. Correlation of dif-fusion-weighted MRI with whole mount radical prostatectomy speci-mens. Br J Radiol. 2008;81:456–62.
55. Ren J, Huan Y, Wang H, et al. Seminal vesicle invasion in prostate cancer: prediction with combined T2-weighted and diffusion-weighted MR imaging. Eur Radiol. 2009;19:2481–6.
56. Kim CK, Choi D, Park BK, et al. Diffusion-weighted MR imaging for the evaluation of seminal vesicle invasion in prostate cancer: initial results. J Magn Reson Imaging. 2008;28:963–9.
57. Albertsen PC, Hanley JA, Gleason DF, et al. Competing risk analy-sis of men aged 55 to 74 years at diagnoanaly-sis managed conserva-tively for clinically localized prostate cancer. JAMA. 1998;280:975– 80.
58. Desireddi NV, Roehl KA, Loeb S, et al. Improved stage and
grade-specific progression-free survival rates after radical prostatectomy in the PSA era. Urology. 2007;70:950–5.
59. Roach M 3rd, Weinberg V, Sandler H, et al. Staging for prostate cancer: time to incorporate pretreatment prostate-specific antigen and Gleason score? Cancer. 2007;109:213–20.
60. Noguchi M, Stamey TA, McNeal J, et al. Relationship between sys-tematic biopsies and histological features of 222 radical prostatec-tomy specimens: lack of prediction of tumor significance for men with nonpalpable prostate cancer. J Urol. 2001;166:104–10. 61. Ruijter ET, van de Kaa CA, Schalken JA, et al. Histological grade
heterogeneity in multifocal prostate cancer. Biological and clinical implications. J Pathol. 1996;180:295–9.
62. Bittencourt LK, Barentsz JO, de Miranda LC, et al. Prostate MRI: diffusion-weighted imaging at 1.5T correlates better with prostate-ctomy Gleason grades than TRUS-guided biopsies in peripheral zone tumours. Eur Radiol. 2012;22:468–75.
63. Hambrock T, Somford DM, Hoeks C, et al. Magnetic resonance imaging guided prostate biopsy in men with repeat negative biopsies and increased prostate specific antigen. J Urol. 2010;183:520–7. 64. Wang L, Hricak H, Kattan MW, et al. Prediction of seminal vesicle