Objective value on Apparent diffusion coefficient (ADC)
map to categorize the intensity of diffusion-weighted
imaging (DWI) restriction for prostate cancer detection on
multiparametric prostate MRI
_______________________________________________
Thais Caldara Mussi
1, Tatiana Martins
1, 2, Adriano Tachibana
1, Pedro Nogueira Mousessian
1, Ronaldo Hueb
Baroni
11 Hospital Israelita Albert Einstein, São Paulo, SP, Brasil and 2 Ecoar Medicina Diagnostica, Belo
Horizonte, MG, Brasil
INTRODUCTION
Magnetic resonance imaging (MRI) of the prostate is an important tool to detect cancer (1-3), stage the disease (4), estimate cancer aggres-siveness (5, 6) and follow-up men with previous negative biopsies or on active surveillance (7, 8).
However, prostate MRI is a challenging exam, with limitations, so its description is usu-ally performed in probability grades of having a clinically significant (CS) cancer. A Likert scale is a subjective scale firstly described by a neurosci-entist and is used to grade something in levels of certainty (9). In prostate MRI the Likert scale is
ABSTRACT
Purpose: To identify objective and subjective criteria on multiparametric prostate MRI that can be helpful for prostate cancer detection.
Materials and Methods: Retrospective study, IRB approved, including 122 patients who had suspicious lesion on MRI and who underwent prostate biopsy with ultraso-nography (US)/MRI imaging fusion. There were 60 patients with positive biopsies and 62 with negative biopsies. MRI of these patients were randomized and evaluated inde-pendently by two blinded radiologists. The following variables were analyzed in each lesion: morphology, contours, T2 signal, diffusion restriction (subjective impression and objective values), hyper-enhancement, contact with transition zone or prostatic contour, prostatic contour retraction, Likert and PIRADS classification.
Results: Apparent diffusion coefficient (ADC) value was the best predictor of positivity for prostate cancer, with mean value of 1.08 (SD 0.20) and 1.09 mm2/sec (SD 0.24) on negative biopsies and 0.81 (SD 0.22) and 0.84 mm2/sec (SD 0.22) on positive biopsies for readers 1 and 2, respectively (p < 0.001 in both analysis). For the others categori-cal variables evaluated the best AUC for reader 1 was subjective intensity of diffusion restriction (AUC of 0.74) and for reader 2 was hyper-enhancement (AUC of 0.65), all inferior comparing to the value of ADC map. Interobserver agreement ranged from 0.13 to 0.75, poor in most measurements, and good or excellent (kappa > 0.6) only in lesion size and ADC values.
Conclusions: Diffusion restriction with lower ADC-values is the best parameter to pre-dict cancer on MRI prior to biopsy. Efforts to establish an ADC cutoff value would improve cancer detection, especially for less experience reader.
ARTICLE INFO
Keywords:
Magnetic Resonance Imaging; Prostatic Neoplasms; Prostate
Int Braz J Urol. 2018; 44: 882-91
_____________________
Submitted for publication: January 23, 2018
_____________________
Accepted after revision: May 13, 2018
_____________________
used to describe the probability of having prostate cancer, usually in a 5-point scale (10, 11). More recently, in an attempt to standardize the meth-odology and make it more objective, a multidis-ciplinary group published the PI-RADS (Prostate Imaging Reporting and Data System) in 2012 (12), and an updated version in 2015 (13). PI-RADS ver-sion 2 also classifies prostate lever-sions in a 5-point scale of probability of having a significant cancer. PI-RADS is based on subjective features of pros-tatic lesions, and the version 2 uses the diffusion-weighted image sequence as the dominant to cat-egorize a lesion in the peripheral zone, and the T2-weighted imaging morphology (including het-erogeneity) as the dominant sequence for lesion in transition zone. If a lesion is indeterminate, posi-tive enhancement is used to differentiate from high probability of CS cancer in the peripheral zone and the grade of diffusion restriction is used similarly on the transition zone (12).
Nowadays, PI-RADS version 2 is widely used to standardize the communication between radiologists and urologists and also to make MRI evaluation and reports more uniform and repro-ducible among radiologists. It is able to improve detection, localization, characterization, and risk stratification (13). Nevertheless, some stud-ies show low to moderate rates of interobserver agreement, even for experienced reader (14, 15).
The purpose of this study is to identify objective and subjective criteria on multipara-metric prostate MRI that can help in the detec-tion of prostate cancer and, therefore, improve MRI results.
MATERIALS AND METHODS
Study design
Retrospective study, institutional review board approved. We searched in our database for patients who had suspicious lesions on MRI, with prostate MRI report of high or very high prob-ability for CS prostate cancer (PI-RADS 4 and 5) and who also underwent prostate biopsy with ul-trasonography (US) / MRI imaging fusion in our institution.
Between March, 2015 and January, 2016 we found 60 patients who had PI-RADS 4 or 5
findings on MRI, including peripheral zone and transition zone lesions, with positive biopsy re-sults for prostate cancer. Then, to eliminate a se-lection bias, we also included 62 patients with suspicious lesions on MRI (PI-RADS 4 and 5), but with negative biopsy results. The maximal inter-val between MRI and biopsies was 6 months for all patients.
MRI protocol
All patients underwent MRI on a 3-Tesla scanner: Magnetom Prisma (Siemens Medical Solutions, Erlangen, Germany) or Discovery MR 750W (GE Healthcare, Little Chalfont, United Kingdom with a phased array coil and without an endorectal coil. A routine protocol includ-ing triplanar T2W imaginclud-ing usinclud-ing the parame-ters: repetition time (msec) / echo time (msec), 4700-5200 / 140-160; section thickness, 3 mm; field of view, 180 x 180; matrix 256 x 256; ac-celeration factor of two; and six averages. DWI were acquired with b-values of 50, 400, 800 and 1500 sec / mm2; and the ADC map was constructed based in a mono-exponential ap-proach. DCE imaging were performed using the parameters: repetition time (msec) / echo time (msec), 3.4-3.5 / 1.4; section thickness, 3 mm; field of view, 250; matrix 224 x 224; acquiring 14 sequences with 10 seconds of temporal reso-lution. Extracellular gadolinium-based contrast media (Magnevist, Bayer, Leverkusen, Germany) was injected at a dose of 0.2 cc / Kg and a rate of 2 cc / sec.
Biopsy protocol
As reference standard, the transrectal prostate biopsy with MRI / US fusion and addi-tional samples of suspicious areas was adopted. US-guided biopsies were performed using either an Aplio 500 with Smart Fusion (Toshiba Medi-cal System Corporation, Minato, Tokyo, Japan) or a LOGIC E9 with imaging fusion software (GE Healthcare, Little Chalfont, United Kingdom). One out of ten radiologists with at least 4 years of experience in prostate biopsy with imaging fusion MRI / US performed the biopsy. A cancer was defined as CS if Gleason score ≥ 3+4.
Imaging evaluation
Radiologists evaluated the images us-ing a workstation (Carestream, Rochester, New York). All sequences of the exam were interpret-ed in a single session and the selectinterpret-ed param-eters of that study were evaluated. ADC values were measured on the ADC map with a round ROI in the lesion in the transverse plane.
Statistical analysis
We performed a histogram analysis and Shapiro-Wilk test to verify the distribution. Nu-meric variables with normal distribution were described as mean and standard deviation (SD), and numeric variables with no normal distribution were described as median and interquartile inter-vals (IQR). Categorical variables were described by absolute and relative frequencies.
The interobserver agreement was cal-culated using Cohen’s Kappa statistics (linear weights for categorical variables and quadratic weights for ordinal variable). It was defined as: excellent (k ≥ 0.81), good (k = 0.61 - 0.80), mod-erate (k = 0.41 - 0.60), fair (k = 0.21 - 0.40) and poor (k ≤ 20).
To study the association between the ex-plicative measurements and the biopsy results we used binominal logistic models and the dis-crimination was verified with area under the curve (AUC) receiver operating characteristic (ROC). Multiple model was acquired using stepwise pro-cess in both direction starting with a null model to a saturated model.
Analyses were performed using the soft-ware R 3.1.3 (R Core Team, 2015). The level for statistical significance was set at 5%.
RESULTS
A total of 122 patients were enrolled in our study. Of the 60 positive biopsy results, 9 (15%) had Gleason score 3 + 3 and 51 (85%) had Gleason score ≥ 3 + 4. Median time between MRI and biop-sy was 21 days. A median of 3 additional samples was obtained in each suspicious lesion on MRI.
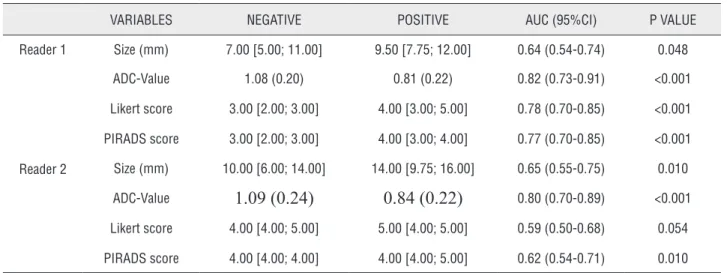
Among all variables independently ana-lyzed, ADC value was the best predictor of posi-tivity for CS-prostate cancer on biopsy, with mean value of 1.08 mm2 / sec (SD 0.20) on negative
bi-opsies and 0.81 mm2 / sec (SD 0.22) on positive biopsies for reader 1, and 1.09 mm2 / sec (SD 0.24)
on negative biopsies and 0.84 mm2 / sec (SD 0.22)
on positive biopsies for reader 2 (p < 0.001 in both analysis). AUC was 0.82 and 0.80 for reader 1 and 2, respectively (Table-1).
diffusion restriction, hyper-enhancement, con-tact with surgical and prostatic capsule, and retraction of prostatic contour), the best AUC for reader 1 (Table-2) was subjective intensity of diffusion restriction (AUC of 0.74) and for read-er 2 (Table-3) was hypread-er-enhancement (AUC of 0.65), all inferior comparing to the value of ADC map. Table-4 shows sensitivities, specifici-ties, accuracies, positive and negative predictive
values of both readers in the features that had clinically significant differences on independent analysis.
Interobserver agreement ranged from 0.13 to 0.75, poor in most measurements, and good or excellent (kappa > 0.6) only in lesion size and ADC values (both numeric variables).
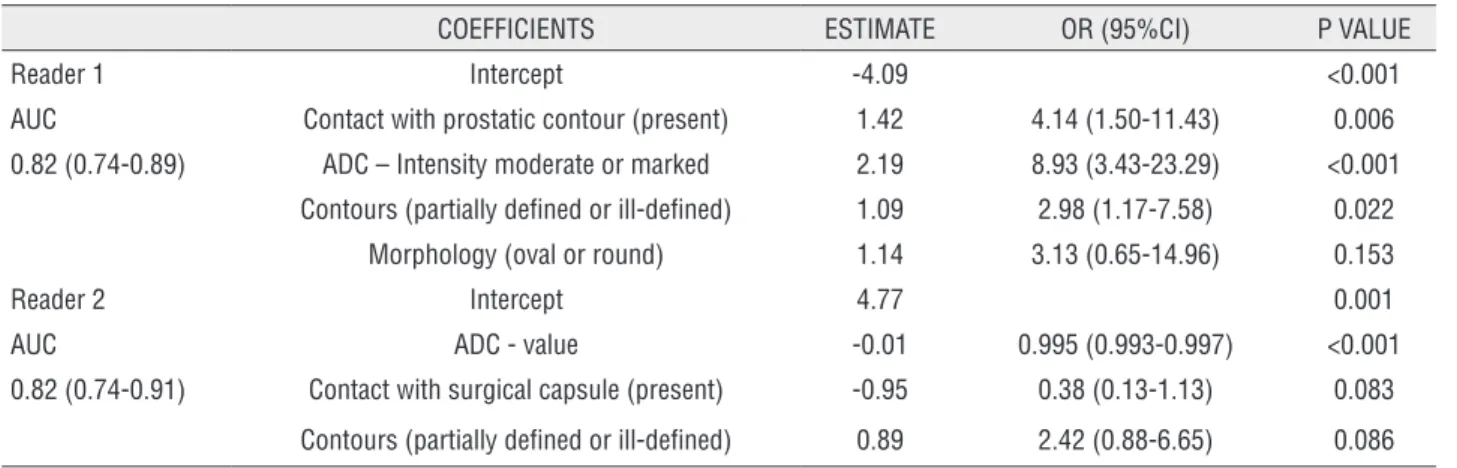
Multiple models
Multiple models analyses were obtained independently for readers 1 and 2. For reader 1, variables that remained significantly associated with tumor on biopsy, in presence of ADC value, were: contact with prostatic contour, subjective restriction diffusion on ADC map (moderate and marked), and lesion contours partially defined or ill defined. For reader 2, none of the variables were significant associated with positive biopsy
for tumor, in presence of objective measurement of ADC value, being the most important variable that correlates with biopsy (Table-5) (Figure-1).
Boxplots graphics shows that subjective impression to categorize the intensity of restric-tion (mild, moderate and marked) had direct strong negative correlation with ADC values, with coefficients of -0.83 (confidence interval of 95%: -0.90 to -0.74) for reader 1, and -0.64
(confidence interval of 95%: -0.75 to -0.51 for reader 2). However, this association was stronger for reader 1 than for reader 2, who had high overlap on ADC values measurements for subjective catego-rization of moderate and marked diffusion restric-tion (Figure-2).
DISCUSSION
Our study showed that objective value of le-sion’s diffusion restriction, measured on ADC map, is the best predictive variable for prostate cancer. For the more experienced reader, the subjective val-ue of ADC (moderate and marked) also had signifi-cant correlation with positive biopsies. However, for less experienced reader, the subjective variable had high overlap and showed no correlation with positive biopsies on multivariate analysis.
VARIABLES NEGATIVE POSITIVE AUC (95%CI) P VALUE
Reader 1 Size (mm) 7.00 [5.00; 11.00] 9.50 [7.75; 12.00] 0.64 (0.54-0.74) 0.048
ADC-Value 1.08 (0.20) 0.81 (0.22) 0.82 (0.73-0.91) <0.001
Likert score 3.00 [2.00; 3.00] 4.00 [3.00; 5.00] 0.78 (0.70-0.85) <0.001
PIRADS score 3.00 [2.00; 3.00] 4.00 [3.00; 4.00] 0.77 (0.70-0.85) <0.001
Reader 2 Size (mm) 10.00 [6.00; 14.00] 14.00 [9.75; 16.00] 0.65 (0.55-0.75) 0.010
ADC-Value
1.09 (0.24)
0.84 (0.22)
0.80 (0.70-0.89) <0.001Likert score 4.00 [4.00; 5.00] 5.00 [4.00; 5.00] 0.59 (0.50-0.68) 0.054
PIRADS score 4.00 [4.00; 4.00] 4.00 [4.00; 5.00] 0.62 (0.54-0.71) 0.010
Prostate MRI is a method routinely per-formed to detect prostate cancer prior to fi rst biop-sy or after a negative biopbiop-sy (1, 2, 7). A structured prostate report is a major contribution for prostate MRI examination, and represents the initial steps to do a widely available method to detect prostate cancer. However, it is a challenging method with low to moderate rates of interobserver agreement even with standardized methodology (14, 15).
It is already known that there is a corre-lation between the grade of diffusion restriction in the prostate and the presence of cancer (16-20). Our study shows that the subjective gradua-tion of restricted diffusion can be misclassifi ed for less experience readers, what could imply the fi nal categorization of a prostatic lesion on MRI.
The variability in the subjective analysis probably explains the low rates of interobserver agreement. Median ADC values in category mod-erate and marked was 0.89 mm2 / sec (IQR 0.88 - 0.96) and 0.62 mm2 / sec (IQR 0.54 - 0.72), re-spectively, for reader 1, and 1.02 mm2 / sec (IQR 0.86 - 1.15) and 0.76 mm2 / sec (IQR 0.63 - 0.96),
Figure 1 - A nodule in the posterior right midgland of the peripheral zone (A). Reader 1 described as mild restriction diffusion on ADC map and diffusion (B and C) and no hyper-enhancement (D), and fi nal Likert and PIRADS score 3. Reader 2 described as moderate diffusion and hyper-enhancement, and fi nal Likert and PIRADS scores 5. Biopsy was negative for neoplasia.
Figure 2 - Graphics presented in boxplot showing the correlation of subjective ADC map grade and the objective ADC map value.
A
C
B
respectively, for reader 2. Note that for reader 2 there is an interpolation for moderate and marked restriction diffusion ranging from value from 0.86 mm2 / sec to 0.96 mm2 / sec (Figure-2). We believe
that an objective cutoff for ADC map value, includ-ed in routine practice, would increase interobserver agreement to categorize lesions with mild, moder-ate and marked restriction diffusion, contributing to the standardize methodology become more re-producible. To the best of our knowledge, there is no data suggesting using objective ADC map val-ues to categorize the grade of restriction diffusion.
There are some factors described that can affect the ADC measurements, such as b values,
respiration conditions, field strength, vendor and other technical parameters (21). On the oth-er hand, Sadinski et al. demonstrated, compar-ing ADC maps between two consecutive scans of same patient, that the reproducibility of ADC measurements in prostate is reasonable, suggest-ing that quantitative values obtained in DWI-MRI of prostate cancer are reproducible (22). Our study found similar values on ADC map for positive and negative prostate cancer biopsies (0.81 mm2 / sec and 1.08 mm2 / sec for reader 1, and 0.84 mm2 / sec and 1.09 mm2 / sec for reader 2, respectively), compared to literature, that ranges from 0.74 mm2 / sec (SD 0.15) to 0.80 mm2 / sec (SD 0.25) for VARIABLES CLASS NEGATIVE (n=62) POSITIVE (n=60) AUC (95%CI) P VALUE
Morphology 1-linear / v-shaped 11 (17.7) 3 (5.0) 0.62 (0.54-0.71)
2-oval 13 (21.0) 23 (38.3) 0.011
3-nodular 38 (61.3) 34 (56.7) 0.086
Contours 1-well defined 28 (45.2) 17 (28.3) 0.59 (0.50-0.68)
2-partially defined 26 (41.9) 32 (53.3) 0.081
3-undefined 8 (12.9) 11 (18.3) 0.142
Signal in T2 1-hypo 43 (69.4) 26 (43.3) 0.63 (0.54-0.72)
2-marked hypo 19 (30.6) 34 (56.7) 0.004
Signal in T2 1-homogeneous 18 (29.0) 36 (60.0) 0.65 (0.57-0.74)
2-heterogeneous 44 (71.0) 24 (40.0) 0.001
ADC– intensity of diffusion restriction
1-mild 39 (62.9) 12 (20.0) 0.74 (0.66-0.83)
2-moderate 17 (27.4) 26 (43.3) <0.001
3-marked 6 (9.7) 22 (36.7) <0.001
Hyper-enhancement 0-absent 8 (15.1) 7 (12.7) 0.55 (0.44-0.65)
1-mild 19 (35.8) 17 (30.9) 0.971
2-moderate 15 (28.3) 15 (27.3) 0.833
3-marked 11 (20.8) 16 (29.1) 0.434
Contact with surgical capsule
0-no 21 (33.9) 18 (30.0) 0.52 (0.44-0.60)
1-yes 41 (66.1) 42 (70.0) 0.647
Contact with prostatic contours
0-no 23 (37.1) 10 (16.7) 0.60 (0.53-0.68)
1-yes 39 (62.9) 50 (83.3) 0.013
Retraction of prostatic contours
0-no 58 (96.7) 52 (94.5) 0.51 (0.47-0.55)
1-yes 2 (3.3) 3 (5.5) 0.581
positive prostate cancer biopsies and 1.35 mm2 /
sec (SD 0.31) to 1.48 mm2 / sec (SD 0.29) for nega-tive biopsies (18, 19), corroborating that ADC map value can be reproducible. Also, it has been al-ready shown that using a parameter to normalize the ADC measurement (as the normal parenchyma or muscle), the ADC value can be reproducible among different scanners (21).
All others variables included in this study (size, Likert and PI-RADS classifications, morphol-ogy, contours, signal in T2W, contact with surgical capsule and prostatic contours, prostatic contours retraction and hyper-enhancement) were less or no important comparing to the intensity of diffu-sion restriction on ADC map.
VARIABLES CLASS NEGATIVE (n=62) POSITIVE (n=60) AUC (95%CI) P VALUE
Morphology 1-linear / v-shaped 10 (16.1) 9 (15.0) 0.54 (0.45-0.63)
2-oval 19 (30.6) 23 (38.3) 0.593
3-nodular 33 (53.2) 28 (46.7) 0.911
Contours 1-well defined 30 (48.4) 16 (26.7) 0.62 (0.52-0.71)
2-partially defined 25 (40.3) 36 (60.0) 0.014
3-undefined 7 (11.3) 8 (13.3) 0.206
Signal in T2 1-hypo 43 (69.4) 35 (58.3) 0.56 (0.47-0.64)
2-marked hypo 19 (30.6) 25 (41.7) 0.206
Signal in T2 1-homogeneous 42 (67.7) 39 (65.0) 0.51 (0.43-0.60)
2-heterogeneous 20 (32.3) 21 (35.0) 0.749
ADC– intensity of diffusion restriction
1-mild 18 (29.0) 6 (10.0) 0.64 (0.55-0.73)
2-moderate 23 (37.1) 20 (33.3) 0.088
3-marked 21 (33.9) 34 (56.7) 0.004
Hyper-enhancement 0-absent 9 (17.0) 3 (5.4) 0.65 (0.55-0.75)
1-mild 7 (13.2) 10 (17.9) 0.079
2-moderate 12 (22.6) 24 (42.9) 0.018
3-marked 25 (47.2) 19 (33.9) 0.261
Contact with surgical capsule
0-no 20 (32.3)
20 (33.3)
0.51 (0.42-0.59)1-yes 42 (67.7) 40 (66.7) 0.899
Contact with prostatic contours
0-no 21 (33.9) 7 (11.7) 0.61 (0.54-0.68)
1-yes 41 (66.1) 53 (88.3) 0.005
Retraction of prostatic contours
0-no 51 (92.7) 52 (94.5) 0.51 (0.46-0.56)
1-yes 4 (7.3) 3 (5.5) 0.697
AUC = Area under the ROC Curve; 95%CI = 95% confidence intervals; OR = estimated odds ratio Table 3 - Categoric variable for reader 2 in absolute number (%).
Table 4 - Diagnostic measurements.
VARIABLE POSITIVE SENSITIVITY SPECIFICITY ACCURACY PPV NPV
Reader 1
Size (mm) ≥ 7.5 0.75 0.53 0.64 0.61 0.69
Morphology oval or nodular 0.95 0.18 0.56 0.53 0.79
Contour Partially defined or
ill-defined 0.72 0.45 0.58 0.56 0.62
Signal in T2 marked hypo 0.57 0.69 0.63 0.64 0.62
Signal in T2 heterogeneous 0.40 0.29 0.34 0.35 0.33
ADC - subjective moderate or marked 0.80 0.63 0.71 0.68 0.76
ADC - value ≥ 1010.5 0.16 0.29 0.23 0.17 0.27
Early enhancement marked 0.29 0.79 0.54 0.59 0.52
Contact with prostatic contour yes 0.83 0.37 0.60 0.56 0.70
Likert 4 or 5 0.55 0.85 0.70 0.79 0.66
PI-RADS 4 or 5 0.55 0.85 0.70 0.79 0.66
Reader 2
Size (mm) ≥ 7.5 0.90 0.35 0.62 0.57 0.79
Morphology Nodular 0.47 0.47 0.47 0.46 0.48
Contour Partially defined or
ill-defined 0.73 0.48 0.61 0.58 0.65
Signal in T2 marked hypo 0.42 0.69 0.56 0.57 0.55
Signal in T2 heterogeneous 0.35 0.68 0.52 0.51 0.52
ADC - subjective marked 0.57 0.66 0.61 0.62 0.61
ADC - value ≥ 910 0.30 0.12 0.20 0.22 0.17
Early enhancement mild, moderate or marked 0.95 0.17 0.57 0.55 0.75
Contact with prostatic contour yes 0.88 0.34 0.61 0.56 0.75
Likert 5 0.60 0.58 0.59 0.58 0.60
PI-RADS 5 0.35 0.89 0.62 0.75 0.59
PPV = positive predictive value; NPV = negative predictive value
Table 5 - Multiple models to identify positive biopsy.
COEFFICIENTS ESTIMATE OR (95%CI) P VALUE
Reader 1 Intercept -4.09 <0.001
AUC Contact with prostatic contour (present) 1.42 4.14 (1.50-11.43) 0.006
0.82 (0.74-0.89) ADC – Intensity moderate or marked 2.19 8.93 (3.43-23.29) <0.001
Contours (partially defined or ill-defined) 1.09 2.98 (1.17-7.58) 0.022
Morphology (oval or round) 1.14 3.13 (0.65-14.96) 0.153
Reader 2 Intercept 4.77 0.001
AUC ADC - value -0.01 0.995 (0.993-0.997) <0.001
0.82 (0.74-0.91) Contact with surgical capsule (present) -0.95 0.38 (0.13-1.13) 0.083
14 mm in positive biopsies for readers 1 and 2, respectively, and did not correlated with positive biopsy in multiple models analyses. So, we agree that a 10 mm threshold would be a better cutoff to differentiate scores 4 and 5.
Our study has some limitations: first, we had only two readers with different levels of expe-rience. Second, the readers evaluated only the pre-viously specified lesions and not the whole gland; we chose this methodology because the reference standard used was the fusion biopsy (using US and RM images) and we wanted to be sure that the analyzed lesion was the biopsied one. Also, we aimed to compare the interobserver agreement and assess the variables for the same abnormality. Third, we did not analyze lesions in the peripheral and transition zones in subgroups. Finally, we did not measure the relative ADC map value.
CONCLUSIONS
Diffusion restriction with lower ADC-values is the best parameter to predict cancer on multiparametric MRI prior to biopsy. Efforts to es-tablish an ADC cutoff value would improve cancer detection, especially for less experience readers. Also, developing ADC as a quantitative imaging marker would allow better detection of prostate cancer by reducing inter-radiologist subjectiv-ity, improving MRI results and therefore avoiding unnecessary biopsy, reducing overdiagnosis and overtreatment of prostate cancer.
Clinical Relevance
Prostate MRI is evolving for the diagnosis of cancer. There is still debate in literature to prove the best method for diagnosis, but none of them include ADC objective values to make the differen-tiation between benign and malignant lesions.
ACKNOWLEDGEMENT
We thank Ana Carolina Cintra Nunes Ma-fra for helping with the statistical analyses.
ETHICAL APPROVAL
IRB approved.
CONFLICT OF INTEREST
None declared.
REFERENCES
1. Ahmed HU, El-Shater Bosaily A, Brown LC, Gabe R, Kaplan R, et al. Diagnostic accuracy of multi-parametric MRI and TRUS biopsy in prostate cancer (PROMIS): a paired validating confirmatory study. Lancet. 2017;389(10071):815-22. 2. Nam RK, Wallis CJ, Stojcic-Bendavid J, Milot L, Sherman C,
Sugar L, et al. A Pilot Study to Evaluate the Role of Magnetic Resonance Imaging for Prostate Cancer Screening in the General Population. J Urol. 2016;196:361-6.
3. Mussi TC, Garcia RG, Queiroz MR, Lemos GC, Baroni RH. Prostate cancer detection using multiparametric 3 - tesla MRI and fusion biopsy: preliminary results. Int Braz J Urol. 2016;42:897-905.
4. Pasoglou V, Larbi A, Collette L, Annet L, Jamar F, Machiels JP, et al. One-step TNM staging of high-risk prostate cancer using magnetic resonance imaging (MRI): toward an upfront simplified “all-in-one” imaging approach? Prostate. 2014;74:469-77. 5. Moore CM, Ridout A, Emberton M. The role of MRI in active
surveillance of prostate cancer. Curr Opin Urol. 2013;23:261-7. 6. Moore CM, Petrides N, Emberton M. Can MRI replace serial
biopsies in men on active surveillance for prostate cancer? Curr Opin Urol. 2014;24:280-7.
7. Rosenkrantz AB, Verma S, Choyke P, Eberhardt SC, Eggener SE, Gaitonde K, et al. Prostate Magnetic Resonance Imaging and Magnetic Resonance Imaging Targeted Biopsy in Patients with a Prior Negative Biopsy: A Consensus Statement by AUA and SAR. J Urol. 2016;196:1613-8.
8. Schoots IG, Petrides N, Giganti F, Bokhorst LP, Rannikko A, Klotz L, et al. Magnetic resonance imaging in active surveillance of prostate cancer: a systematic review. Eur Urol. 2015;67:627-36.
9. Likert R. A technique for the measurement of attitudes. Archives of Psychology 1932;140:44-53.
10. Renard-Penna R, Mozer P, Cornud F, Barry-Delongchamps N, Bruguière E, Portalez D, et al. Prostate Imaging Reporting and Data System and Likert Scoring System: Multiparametric MR Imaging Validation Study to Screen Patients for Initial Biopsy. Radiology. 2015;275:458-68.
12. Dickinson L, Ahmed HU, Allen C, Barentsz JO, Carey B, Futterer JJ, et al. Scoring systems used for the interpretation and reporting of multiparametric MRI for prostate cancer detection, localization, and characterization: could standardization lead to improved utilization of imaging within the diagnostic pathway? J Magn Reson Imaging. 2013;37:48-58.
13. American College of Radiology. MR Prostate Imaging Reporting an Data System version 2.0. <https://www.acr. org/Quality-Safety/Resources/PIRADS/> accessed January 05, 2017.
14. Rosenkrantz AB, Ginocchio LA, Cornfeld D, Froemming AT, Gupta RT, Turkbey B, et al. Interobserver Reproducibility of the PI-RADS Version 2 Lexicon: A Multicenter Study of Six Experienced Prostate Radiologists. Radiology. 2016;280:793-804.
15. Muller BG, Shih JH, Sankineni S, Marko J, Rais-Bahrami S, George AK, et al. Prostate Cancer: Interobserver Agreement and Accuracy with the Revised Prostate Imaging Reporting and Data System at Multiparametric MR Imaging. Radiology. 2015;277:741-50.
16. Bains LJ, Studer UE, Froehlich JM, Giannarini G, Triantafyllou M, Fleischmann A, et al. Diffusion-weighted magnetic resonance imaging detects significant prostate cancer with a high probability: results of a prospective study with final pathology of prostates with and without cancer as the reference standard. J Urol 2014;192:1–21. Available at. <https://www.urotoday.com/recent-abstracts/urologic- oncology/prostate-cancer/70901-diffusion-weighted- magnetic-resonance-imaging-detects-significant-prostate- cancer-with-a-high-probability-results-of-a-prospective- study-with-final-pathology-of-prostates-with-and-without-cancer-as-the-reference-standard-abstract.amp.html> 17. Nagel KN, Schouten MG, Hambrock T, Litjens GJ, Hoeks CM,
ten Haken B, et al. Differentiation of prostatitis and prostate cancer by using diffusion-weighted MR imaging and MR-guided biopsy at 3T. Radiology. 2013;267:164-72.
18. Woodfield CA, Tung GA, Grand DJ, Pezzullo JA, Machan JT, Renzulli JF 2nd. Diffusion-weighted MRI of peripheral zone prostate cancer: comparison of tumor apparent diffusion coefficient with Gleason score and percentage of tumor on core biopsy. AJR Am J Roentgenol. 2010;194:W316-22. 19. Anwar SS, Anwar Khan Z, Shoaib Hamid R, Haroon F, Sayani
R, Beg M, et al. Assessment of apparent diffusion coefficient values as predictor of aggressiveness in peripheral zone prostate cancer: comparison with Gleason score. ISRN Radiol. 2014;2014:263417.
20. Lebovici A, Sfrangeu SA, Feier D, Caraiani C, Lucan C, Suciu M, et al. Evaluation of the normal-to-diseased apparent diffusion coefficient ratio as an indicator of prostate cancer aggressiveness. BMC Med Imaging. 2014;14:15.
21. Zhu J, Zhang J, Gao JY, Li JN, Yang DW, Chen M, et al. Apparent diffusion coefficient normalization of normal liver: Will it improve the reproducibility of diffusion-weighted imaging at different MR scanners as a new biomarker? Medicine (Baltimore). 2017;96:e5910.
22. Sadinski M, Medved M, Karademir I, Wang S, Peng Y, Jiang Y, et al. Short-term reproducibility of apparent diffusion coefficient estimated from diffusion-weighted MRI of the prostate. Abdom Imaging. 2015;40:2523-8.
23. Rosenkrantz AB, Babb JS, Taneja SS, Ream JM. Proposed Adjustments to PI-RADS Version 2 Decision Rules: Impact on Prostate Cancer Detection. Radiology. 2017;283:119-29.
_______________________ Correspondence address: