A Work Project, presented as part of the requirements for the Award of a Masters Degree
in Management from the NOVA
–
School of Business and Economics.
Business Model Design of There App
–
Strategic considerations for the development
of a single-sided or multi-sided platform
Alexandre Prata #1418
A Project carried out on the Field Lab Entrepreneurial Innovative Ventures, under the
supervision of:
Professor Filipe Castro Soeiro
Exhibit 1
–
Description of There App
The version of the app currently available on the App Store broadcasts location
information among networks of friends and non-friends, automatically creating a social
landscape of its members. Personal information of users is not revealed, so as to prevent
privacy and tracking issues, as well as to motivate people to be engaged in the system and
remain willing to connect. In the case users opt-in with Facebook, they can indirectly get a
visual representation of their fri
ends’ social outings (by distinguishing them on the map
with a different color), even though they’re not able to assess specifically who each person
is. Furthermore, users can interact with those members of the network by connecting to
them and requesting a live video-stream of their surroundings. The app further allows
users to randomly join a live connection happening somewhere between other anonymous
members and watch the video content being shared. A flick-to-alternate feature eases the
process of changing between different connections. This feature tries to leverage on other
popular passive media consumption habits such as television zapping
1. There App delivers
these capabilities by leveraging the smartphone's built-in GPS
2to locate users and their
phone’s cameras to provide the media capturing. A
n HD video
3quality standard (H.264)
is deployed that optimizes data transmission speed and reliability, while maintaining a
suitable overall quality in the process. The platform interconnects all these functions with
third-party APIs
4(e.g. Apple Maps
5) and coordinates all network connections established
between users, into one intuitive and seamless experience.
1
Television zapping is the act of changing channels rapidly by remote control.
2
The Global Positioning System (GPS) is a space-based satellite navigation system that provides location and time information anywhere on the planet, guaranteed there is unobstructed line of sight.
3 High definition video (HD video) is video with a 720p or higher resolution. When distributed online it requires a
minimum standard bit rate of 1.5 Mbps. video standards (IDC 2009).
4 Application Programing Interface (API) is a set of functions and procedures that allow the creation of applications
which access the features or data of an operating system, application, or other service.
5
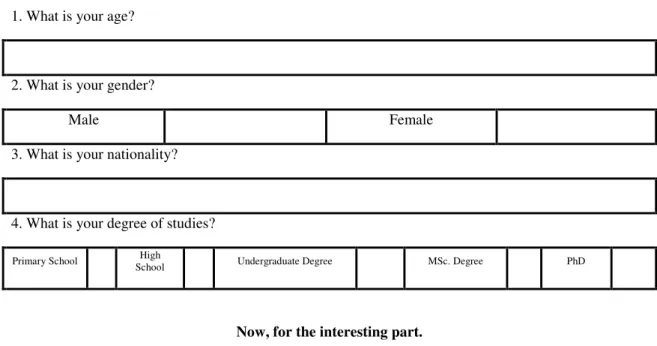
Figure 1: User Questionnaire Template
A brief warm-up.
1. What is your age?
2. What is your gender?
Male Female
3. What is your nationality?
4. What is your degree of studies?
Primary School High
School Undergraduate Degree MSc. Degree PhD
Now, for the interesting part.
5. How many times a day do you access a social network, on average? (Select only one option).
More than 10 times a day
5-10 times a
day
1-5 times a day I don’t
6. Do you have a smartphone?
Yes. No.
Please ignore questions 7 to 12 if you answered “No” to the previous question.
7. Please select the main uses you give to your smartphone:
Social
networks Games
Messaging apps
Entertainment (e.g. watching
videos)
Watching live events
Searching
the internet News
8. How often do you share media content (e.g. videos, photos) to another person from your smartphone, on average? (Select only one option).
Several times a day
Once or twice a day
Once a week
Onces every few weeks
I never share any
content
9. Of the following locations, select those where you normally use your smartphone:
10. What are the main reasons for you to download an app?
Curiosity Service Provided My friends use it Online reviews Other
11. How do you usually hear about an app?
Websites/blogs Social
Networks
App Store, Google Play or
equivalent
Friends TV Magazines
12. What is the largest amount you have ever paid for a mobile app ($ or €)? (Select only one option).
> 20 5 - 20 1 - 5 < 1 Never
paid.
13. For which of the following situations would you use a specific mobile app?
Knowing how a venue is before going there (e.g.
a bar)
Showing someone else how a certain place looks like
Checking the weather at a remote place
Sharing what
you’re doing with
friends Seeing new places from around the world Watching remote live events (e.g. concerts)
14. How often do you think you would use an app for the situations you chose your previous answer? (Select only one option).
Several times a day. Once a day. 2-3 times a week. 2-3 times a month. 2-3 times a year.
15. Would you be willing to pay for such a mobile app?
Yes No
16. Would you be willing to watch a video advertisement (10-20 seconds) instead?
Yes No
17. In which situation are you most frequently faced with advertisement when using your smartphone?
While using a search engine
While on a website
While watching a
video on a website While in an app
While watching a video in an app
18. What is your opinion on in-app ads that rely on your profile information to suggest you items you might want?
I welcome it I’m against it I’m indifferent
Figure 2: Percent of responses to question 13 -
“
For which of the following situations
would you use a specific mobile app?
”
Figure 3: Percent of responses to question 14 -
“
How often do you think you would
use an app for the situations you chose in Q10??
”
82%
35% 33%
87%
46% 48%
Knowing how a venue is before going there (ex:
bar)
Showing someone else how a certain place looks like
Checking the weather at a remote place
Sharing moments with
friends
Seeing new places from around the
world
Watching remote live events (ex: concerts)
9%
12%
23%
30%
26% Several times a day.
Figure 4: Percent of responses to question 9 - Of the following locations, select those
where you normally use your smartphone.
Figure 5: Percent of responses to question 12 - What is the largest amount you have
ever paid for a mobile app ($ or €)?
77%
52%
81% 86%
59%
On-the-go In a store Restaurant or Cafe Bar or nightclub Event (ex: concert)
0% 2%
4%
11%
83%
> 20
5 - 20
1 - 5
< 1
Figure 6: Percent of responses to question 15 - Would you be willing to pay for such
a mobile app?
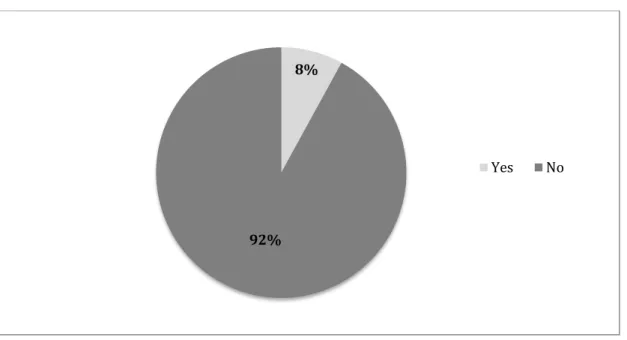
Figure 7: Percent of responses to question 16
–
Would you be willing to watch a video
advertisement (10-20 seconds) instead? (When asked about question 15)
8%
92%
Yes No
63% 37%
Figure 8: Percent of responses to question 18
–
What is your opinion on in-app ads
that rely on your profile information to suggest you items you might want?
Figure 9: Percent of responses to question 17
–
In which situation are you most
frequently faced with advertisement when using your smartphone?
45%
38%
17%
I welcome it
I’m against it
I’m indifferent
27%
25%
9%
34%
22%
While using a search engine
While on a website
While watching a video on a website
Figure 10: Percent of responses to question 11
–
How do you usually hear about an
app?
Figure 11: Industry Mapping
57%64% 61%
88%
4%
17%
Websites/blogs Social Networks
App Store, Google Play or
equivalent
Figure 12: Value Chain at Platform Implementation Phase (December 2015)
(All values shown as percent of Revenue)
Figure 13: Value Chain at Platform Expansion Phase (December 2016)
Figure 14: Projected Business Model Canvas
Key Partners Key Activities Value Propositions Customer Relationships Customer Segments
Mobile software distribution platforms
Software design and development.
Easily and quickly share and get
access to live video footage. Automated Services End users: Cloud computing service
providers Hardware maintenance.
Make better decisions
individually or as a group. Customer Support - College students
Third-party software providers Marketing efforts. Share moments with remote friends while experiencing them.
Event Managers Control and optimization of user engagement levels.
Be entertained by “travelling”
digitally. Monthly or annual contracts
Government and public entities View live events and their
location on the world map. Dedicated Personal Support
Advertisers and advertising agencies
Colleges and Universities
Advertisers and advertising agencies acquisition and
retention.
Exchange student associations Terms and contract negotiation.
Reach a segmented audience of active users with a high ROI, with
rich media formats.
Monthly or annual contracts Event managers:
Controlling ad quality levels.
Content Distribution Networks Dedicated Personal Support - Student unions
Advertising agencies Event managers’ acquisition and retention.
Reach a broader audience for managed events.
Terms and contract negotiation. Increase attendees to managed events. Control and optimization of event
quality levels.
Provide regular audience with a different perspective of the event.
Key Resources Channels
Mobile App Own mobile app
Hardware Own website, social media pages
and blog
Human Resources Mobile software distribution
platforms
Intellectual Property Word-of-mouth
User data Student Union's marketing
channels
Online advertising platforms Business development team
Business development team Word-of-mouth
Cost Structure Revenue Streams
Server Costs Derivative currency: user attention
Firm Overhead (Office, legal, other costs)
Human Resources Advertising revenue: CPM rates
Marketing
Event fees
Table 1: Key Assumptions for Model- User Virality and Retention
6Initial User Set
100
Number of Referrals by Each New User
12
Conversion Rate of Referrals (percent)
10
Time to Complete Full Viral Cycle (days)
14
Timeframe (days)
30
Viral Coefficient
1.2
Monthly User Retention Rate (percent)
30
Table 2:
Key Assumptions for Model
–
Events
7Average Monthly Contacts per Business
Developer
30
Average Monthly Contacts
180
Conversion Rate (percent)
15
Average Number of Monthly Events per
Student Union
2
Student Union Churn Rate (percent)
20
Average Event Duration (minutes)
120
Average Spectators per Event (Via There
App)
5,000
Average User Viewing Time (minutes)
15
Table 3: Key Assumptions for Model
–
Revenue Model
8Average Display
Banner CPM (€)
3
Average Video
CPM (€)
18.08
Daily active users (percent)
20
Assumption: Each daily active user is presented with one display and one video banner ad.
Average Revenue per Event (€)
50
6
Due to lack of historical data, all assumptions are based on the surveys and interviews performed. Most
interviewees stated confirmed that they hear about an app through various channels, but are more likely to covert to users if they hear about it from a friend. Three out of four interviewees further suggested that if they like a mobile app, they will suggest it to 10 or more friends in a short time-frame.
There App is expected to achieve viral growth since its coefficient is superior to 1 and its viral cycle time is moderately low.
7
All assumptions are based on interviews performed with student unions representatives and company’s experience.
8 CPM rates are based on industry averages (Johnston 2014, (Kaplan 2013). ‘Daily active users’ is based on
Table 4: Key Assumptions for Model
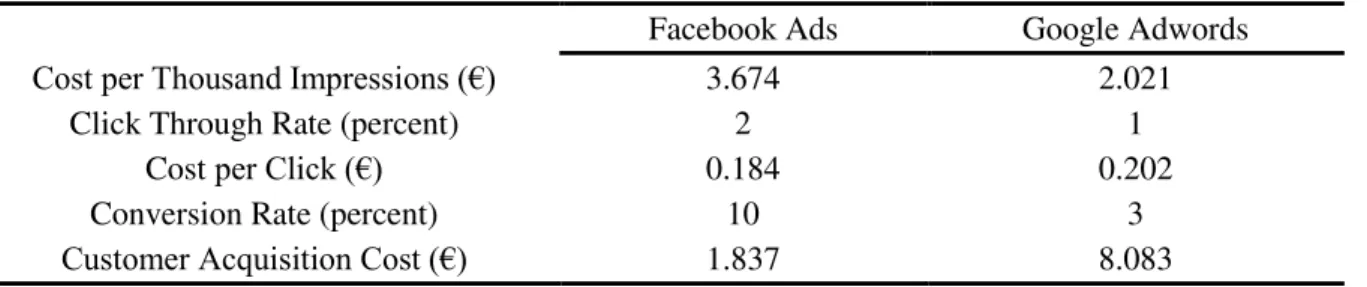
–
Marketing
9Facebook Ads
Google Adwords
Cost per Thousand Impressions (€)
3.674
2.021
Click Through Rate (percent)
2
1
Cost
per Click (€)
0.184
0.202
Conversion Rate (percent)
10
3
Customer Acquisition Cost (€)
1.837
8.083
Table 5: Key Assumptions for Model
–
Server Pricing and Utilization
10Daily Active Users (percent)
20
Average Daily Server Utilization per User
(minutes)
1
Tokbox Opentok
First 10
thousand
minutes
Next 90
thousand
minutes
Next 400
thousand
minutes
Next 1
million
minutes
Next 3.5
million
minutes
5+ million
minutes
Base Price
(€
)
37
-
-
-
-
-
Price per
Minute (€
)
-
0.0035
0.0033
0.0031
0.0029
0.0026
Average Streaming Bit Rate (MBs per second)
0.1
Amazon Web Services S3
Price per Gigabyte (€)
0.022
9
CPM, click-through and conversion rates are based on industry standards (Johnston 2014, (Kaplan 2013). In the model, only Facebook ads were considered given that their average CPM rate and ability to target segmented clients allowed for a higher ROI. Moreover, from the interviews conducted, the great majority of users stated they usually heard about new apps through social networks, as opposed to search engines and regular websites.
10
Server pricing for users is based on service provider Tokbox (Tokbox. 2014), while pricing for events is based on Amazon Web Services S3 (Amazon Web Services, Inc. 2014). ‘Daily Active Users’ and ‘Average Daily Server
Utilization per User’ are based on company’s historical data. ‘Average Streaming Bit Rate’ is based on industry
standards (IDC 2009).
Table 6: Projected Monthly Active User (Viral and retention rates factored into model)
Dec -14 Jan -15 Feb -15 Ma r-15 Apr -15 Ma y-15 Jun-15 Jul-15 Aug-15 Sep-15 Oct-15 Nov-15 Dec-15 Jan-16 Feb-16Mar-16 Apr-16 May-16 Jun-16 Jul-16 Aug-16 Sep-16 Oct-16 Nov-16 Dec-16
Retained and New Users per Time-period cohort
387 116 35 10 3 1 0 0 0 0 0 0 0 0 0 0 0 0 0 0 0 0 0 0 0
811 243 73 22 7 2 1 0 0 0 0 0 0 0 0 0 0 0 0 0 0 0 0 0
1 437 431 129 39 12 3 1 0 0 0 0 0 0 0 0 0 0 0 0 0 0 0 0
2 363 709 213 64 19 6 2 1 0 0 0 0 0 0 0 0 0 0 0 0 0 0
3 732 1 120 336 101 30 9 3 1 0 0 0 0 0 0 0 0 0 0 0 0 0
5 755 1 726 518 155 47 14 4 1 0 0 0 0 0 0 0 0 0 0 0 0
8 744 2 623 787 236 71 21 6 2 1 0 0 0 0 0 0 0 0 0 0
13 163 3 949 1 185 355 107 32 10 3 1 0 0 0 0 0 0 0 0 0
19 694 5 908 1 772 532 160 48 14 4 1 0 0 0 0 0 0 0 0
29 346 8 804 2 641 792 238 71 21 6 2 1 0 0 0 0 0 0
43 613 13 084 3 925 1 178 353 106 32 10 3 1 0 0 0 0 0
64 699 19 410 5 823 1 747 524 157 47 14 4 1 0 0 0 0
95 864 28 759 8 628 2 588 776 233 70 21 6 2 1 0 0
141 926 42 578 12 773 3 832 1 150 345 103 31 9 3 1 0
210 005 63 002 18 900 5 670 1 701 510 153 46 14 4 1
310 626 93 188 27 956 8 387 2 516 755 226 68 20 6
459 344 137 803 41 341 12 402 3 721 1 116 335 100 30
679 150 203 745 61 123 18 337 5 501 1 650 495 149
1 004 021 301 206 90 362 27 109 8 133 2 440 732
1 484 181 445 254 133 576 40 073 12 022 3 607
2 193 857 658 157 197 447 59 234 17 770
3 242 757 972 827 291 848 87 554
4 793 031 1 437 909 431 373
7 084 333 2 125 300
22 874 016
Active
Figure 15: Active users
–
Concept Development (Dec. 2014) and Platform
Implementation Phase (Jan. 2015 - Dec. 2015)
Figure 16: Active users - Platform Expansion Phase (Jan. 2016 - Dec. 2016)
387 927 1.715 2.8784.595 7.133
10.884 16.428
24.622 36.733
54.633 81.089
120.191
0 20.000 40.000 60.000 80.000 100.000 120.000 140.000
dez-14 jan-15 fev-15 mar-15 abr-15 mai-15 jun-15 jul-15 ago-15 set-15 out-15 nov-15 dez-15
A
ct
iv
e
u
ser
s
Date
177.983 263.400 389.646 576.238 852.021 1.259.628
1.862.070 2.752.478 4.068.501
6.013.581 8.888.407
25.540.538
0 5.000.000 10.000.000 15.000.000 20.000.000 25.000.000 30.000.000
jan-16 fev-16 mar-16 abr-16 mai-16 jun-16 jul-16 ago-16 set-16 out-16 nov-16 dez-16
A
ct
iv
e
u
ser
s
Table 7: Projected Monthly Event Managers and Events
Jan-16 Feb-16 Mar-16 Apr-16 May-16 Jun-16 Jul-16 Aug-16 Sep-16 Oct-16 Nov-16 Dec-16
Total Student Unions 45 81 110 133 151 166 178 187 195 201 206 210
New Student Unions 45 45 45 45 45 45 45 45 45 45 45 45
Total Events 90 162 220 266 302 332 356 374 390 402 412 420
Table 8:
Distribution of Variable and Fixed Costs Over Project's Lifetime
Concept Development
(Dec. '14)
Platform Implementation (Dec.
'15)
Platform Expansion (Dec. '16)
Variable Costs 1.2 8.4 17.9
Server Costs 1.2 8.4 17.9
Fixed Costs 98.8 91.6 82.1
Firm Overhead (Office,
legal, other costs) 11.3 4.3 0.2
H.R. 84.2 56.2 3.4
Marketing 3.2 31.1 78.5
Total 100 100 100
(All values in percent)
Figure 17: Distribution of Variable and Fixed Costs Over Project's Lifetime
1% 8%
18%
11% 4%
0.2% 84%
56%
3% 3%
31%
79%
Concept Development (Dec '14) Platform Implementation (Dec. '15)
Platform Expansion (Dec. '16)
Table 9:
There App’s Financial Results –
Concept Development Phase
Oct-14 Nov-14 Dec-14
Number of Users 100 100 387
Number of Events 0 0 0
Advertis. Revenue (€) 0 0 0
Event Revenue (€) 0 0 0
Total Revenue (€) 0 0 0
User Server Costs (€) 37 37 37
Event Server Costs (€) 0 0 0
COGS (€) 37 37 37
Operating Profit (€) -37 -37 -37
Gross Margin (percent) - - -
Legal (€) 300 300 300
HR (€) 2600 2600 2600
Other (€) 50 50 50
Marketing (€) 100 100 100
Total Overhead Costs (€) 3050 3050 3050
EBITDA (€) -3087 -3087 -3087
Cumulative EBITDA (€) -3087 -6173 -9260
Table 10
: There App’s Financial Projections –
Platform Implementation Phase
Jan-15 Feb-15 Mar-15 Apr-15 May-15 Jun-15 Jul-15 Aug-15 Sep-15 Oct-15 Nov-15 Dec-15
Number of Users 927 1715 2878 4595 7133 10884 16428 24622 36733 54633 81089 120191
Number of Events 0 0 0 0 0 0 0 0 0 0 0 0
Advertis. Revenue (€) 0 0 364 581 902 1376 2078 3114 4645 6909 10255 15200
Event Revenue (€) 0 0 0 0 0 0 0 0 0 0 0 0
Total Revenue (€) 0 0 364 581 902 1376 2078 3114 4645 6909 10255 15200
User Server Costs (€) 37 38 62 98 151 230 346 509 749 1104 1629 2364
Event Server Costs (€) 0 0 0 0 0 0 0 0 0 0 0 0
COGS (€) 37 38 62 98 151 230 346 509 749 1104 1629 2364
Operating Profit (€) -37 -38 302 483 751 1147 1732 2605 3896 5805 8626 12836
Gross Margin (percent) #DIV/0! #DIV/0! 82.9 83.1 83.2 83.3 83.4 83.7 83.9 84 84.1 84.4
Legal (€) 500 500 500 500 500 500 1000 1000 1000 1000 1000 1000
HR (€) 2600 15800 15800 15800 15800 15800 15800 15800 15800 15800 15800 15800
Other (€) 50 100 100 100 100 100 200 200 200 200 200 200
Marketing (€) 162 810 881 986 1140 1369 2408 2908 3646 4738 6353 8738
Total Overhead Costs (€) 3312 17210 17281 17386 17540 17769 19408 19908 20646 21738 23353 25738
EBITDA (€) -3349 -17248 -16979 -16903 -16790 -16623 -17676 -17302 -16750 -15934 -14727 -12903
Cumulative EBITDA (€) -12609 -29857 -46836 -63738 -80528 -97151 -114827 -132129 -148879 -164813 -179539 -192442
Table 11
: There App’s Financial Projections –
Platform Expansion Phase
Jan-16 Feb-16 Mar-16 Apr-16 May-16 Jun-16 Jul-16 Aug-16 Sep-16 Oct-16 Nov-16 Dec-16
Number of Users 177983 263400 389646 576238 852021 1259628 1862070 2752478 4068501 6013581 8888407 25540538
Number of Events 90 162 220 266 302 332 356 374 390 402 412 420
Advertis. Revenue (€) 22509 33311 49277 72874 107751 159300 235488 348094 514525 760511 1124078 3230000
Event Revenue (€) 4500 8100 11000 13300 15100 16600 17800 18700 19500 20100 20600 21000
Total Revenue (€) 27009 41411 60277 86174 122851 175900 253288 366794 534025 780611 1144678 3251000
User Server Costs (€) 3447 5033 7260 10551 15373 21663 30960 44701 65010 95027 139392 396369 Event Server Costs
(€) 893 1607 2183 2639 2996 3294 3532 3710 3869 3988 4087 4167
COGS (€) 4340 6640 9442 13189 18369 24957 34492 48412 68879 99015 143479 400536
Operating Profit (€) 22669 34771 50835 72985 104482 150942 218796 318382 465146 681596 1001199 2850464 Gross Margin
(percent) 83.9 84 84.3 84.7 85 85.8 86.3 86.8 87.1 87.3 87.5 87.7
Legal (€) 5000 5000 5000 5000 5000 5000 5000 5000 5000 5000 5000 5000
HR (€) 75100 75100 75100 75100 75100 75100 75100 75100 75100 75100 75100 75100
Other (€) 500 500 500 500 500 500 500 500 500 500 500 500
Marketing (€) 16464 21675 29378 40762 57588 86456 123211 177536 257827 376497 551892 1760563 Total Overhead Costs
(€) 97064 102275 109978 121362 138188 167056 203811 258136 338427 457097 632492 1841163
EBITDA (€) -74396 -67505 -59143 -48377 -33706 -16114 14984 60247 126719 224499 368707 1009301 Cumulative EBITDA
Table 12: Strategic Objectives and respective KPIs
Strategic Objectives
KPIs
1. Acquire 18,000+ monthly active users by mid
2015.
Number of weekly new users acquired through online marketing efforts (e.g. Facebook Ads). Number of weekly new users acquired through student union events.
Number of referrals by each new user. Conversion rate of referrals.
Time to Complete Full Viral Cycle. Viral coefficient.
User monthly retention rate. Average user connection rating.
2. Maintain 10% weekly user growth. Same as in Objective 1.
3. Maintain daily active users above 20%. Total daily user sign-ins.
Ratio between daily active users and total users.
4. Integrate advertisement on There App by mid-2015 and optimize user engagement levels for current average CPM market values - €3 (banners) and €18 (video).
User click-through rate. User session length. Screens per session. Time per screen.
Display banner ads CPM (Cost per thousand impressions).
Video ads CPM.
5. Bring 200+ medium-sized event managers
(E.M.) onboard by end of 2016.
E.M. trials per month.
Average monthly contacts per business developer E.M. conversion rate (percent).
Average number of monthly events per E.M. Total events promoted per E.M.
E.M. monthly churn rate.
6. Optimize engagement levels between users
and event managers, all through rollout period.
Total events viewed per month.
Average events viewed per user per month. Average number of monthly events per E.M. Average event duration.
Average spectators per event. Average user viewing time. Average rating of events.