Raman and infrared spectroscopic studies of phurcalite from Red
Canyon, Utah, USA – Implications for the molecular structure
Jirˇí Cˇejka
a,b, Jirˇí Sejkora
a, Ricardo Scholz
b, Andrés López
c, Yunfei Xi
c, Ray L. Frost
c,⇑ aDepartment of Mineralogy and Petrology, National Museum, Cirkusová 1740, CZ-193 00, Praha 9, Czech Republic
b
Geology Department, School of Mines, Federal University of Ouro Preto, Campus Morro do Cruzeiro, Ouro Preto, MG 35, 400-00, Brazil
c
School of Chemistry, Physics and Mechanical Engineering, Science and Engineering Faculty, Queensland University of Technology, GPO Box 2434, Brisbane, Queensland 4001, Australia
h i g h l i g h t s
Raman and infrared spectra of the
uranyl mineral phurcalite Ca2(UO2)3O2(PO4)27H2O.
From Red Canyon, Utah, USA. Observed bands were assigned to the
stretching and bending vibrations of (UO2)2+and (PO4)3units.
Hydrogen bond lengths were inferred
from observed stretching vibrations.
Structurally nonequivalent U6+and
P5+was inferred from the number of corresponding stretching bands.
g r a p h i c a l
a b s t r a c t
a r t i c l e
i n f o
Article history:
Received 23 January 2014
Received in revised form 18 March 2014 Accepted 19 March 2014
Available online 26 March 2014
Keywords:
Phurcalite Mineral
Raman and infrared spectroscopy U–O bond length
Hydrogen bond lengths
a b s t r a c t
Raman and infrared spectra of the uranyl mineral phurcalite, Ca2(UO2)3O2(PO4)27H2O, from Red Canyon, Utah, USA, were studied and tentatively interpreted. Observed bands were assigned to the stretching and bending vibrations of (UO2)2+and (PO4)3units and to the stretching and bending vibrations and libration modes of water molecules. Approximate lengths of U–O in (UO2)2+and O–H O hydrogen bond lengths were inferred from observed stretching vibrations. The presence of structurally nonequivalent U6+and P5+ was inferred from the number of corresponding stretching bands of (UO
2)2+ and (PO4)3 units observed in the Raman and infrared spectra.
Ó2014 Elsevier B.V. All rights reserved.
Introduction
Uranium as a litophil element is characterised by strong affinity to oxygen, that neither an element, nor mineral sulphides, arsenides or halogenides have been found and all natural uranium compounds contain oxygen. The most important valences (oxidation numbers) under natural conditions are U4+ and U6+.
U6+forms the stable uranyl, (UO
2)2+, ion. Uranyl ions participate
in formation of uranyl minerals, such as uranyl oxide hydrates and uranates, silicates, phosphates, arsenates, vanadates, molyb-dates, sulphates, carbonates, selenites, tellurites and wolframates. Uranyl minerals are classified on the basis of their anions e.g.[1]
or uranyl anion topology e.g.[2]. Some uranyl phosphates, uranyl arsenates, uranyl selenites, uranyl sulphates and uranyl carbonates contain sheets based upon anion topologies with triangles, squares, pentagons and hexagons[2,3]. The phosphuranylite sheet anion topology contains pentagons that share edges, resulting in dimers,
http://dx.doi.org/10.1016/j.molstruc.2014.03.040
0022-2860/Ó2014 Elsevier B.V. All rights reserved.
⇑Corresponding author. Tel.: +61 7 3864 2407; fax: +61 7 3864 1804.
E-mail address:[email protected](R.L. Frost).
Contents lists available atScienceDirect
Journal of Molecular Structure
which are in turn linked into chains by sharing edges with hexa-gons. These chains are linked through chains of edge sharing trian-gles and squares, arranged such that the triantrian-gles and squares alternate along the chain (for details see especially [2,3], and may be also e.g.[4,5]). According to Locock[6], the minerals of the phosphuranylite group are hydrated phosphates and arsenates,
with the general formula Aj+
k[(UO2)3(XO4)2U2]nH2O, where
A = monovalent, divalent, trivalent, or tetravalent cations (or com-plex cations), X = P5+, or As5+, and
U= O2or (OH). These minerals
are defined by the presence of the phosphuranylite type sheet, which contains uranyl pentagonal and hexagonal bipyramids as coordina-tion polyhedra, which share edges to form chains, and in turn are cross-linked by sharing vertices and edges with phosphates or arse-nates tetrahedra. The interlayer region generally contains cations and water molecules, and the sheets are usually linked by hydrogen bonding and through bonds from the interlayer cations to oxygen atoms of the sheets. In some cases, sheets in minerals of the phos-phuranylite group are linked by bonds to polyhedra of U6+in the
interlayer, resulting in framework structures[6].
Phurcalite was first described at Bergen an der Trieb, Saxony, Germany by Deliens and Piret[7]as Ca2(UO2)3(PO4)2(OH)44H2O.
Piret and Declerq determined crystal structure of phurcalite[8]. Phurcalite was also described at some other localities[9–19]. Rede-termination of the crystal structure of phurcalite was carried out by Silva[20], Atencio[21]and Atencio et al.[15]. On this basis, chemical formula of phurcalite Ca2(UO2)3O2(PO4)27H2O was
in-ferred. Infrared spectrum of phurcalite was published and partly interpreted by Camargo[9], Braithwaite et al. [18], and Atencio et al.[15]. Raman spectra of two phurcalite samples are available in the RRUFF data base, however, as usually, without any interpre-tation. Infrared and Raman spectra of phurcalite were presented also by Frost et al.[22].
Phurcalite, Ca2(UO2)3O2(PO4)27H2O, is orthorhombic, space
group Pbca=D2h15. The crystal structure of phurcalite consists of [(UO2)3O2(PO4)2]4nn, which are connected by Ca2+cations and se-ven water molecules. In the crystal structure, there are three sym-metrically (structurally) distinct (nonequivalent) U6+coordination
polyhedra, one hexaxonal bipyramid and two pentagonal bipyra-mids, two symmetrically different Ca2+cations, one capped trigonal
prism and one triangulated dodecahedron, and two structurally nonequivalent P5+ tetrahedra. Intersheet linkage is increased
through hydrogen bonding from the water molecules to oxygen an-ions of the sheets[15].
Experimental
Mineral
The phurcalite sample studied in this work forms part of the collection of the Geology Department of the Federal University of Ouro Preto, Minas Gerais, Brazil, with sample code SAC-136. The phurcalite sample originated from the Posey Mine, Red Canyon, White Canyon District, San Juan Co., Utah, USA. Carefull hand-picked sample was used for X-ray powder diffraction experiment. To minimize the complicated shape of background, the samples studied were placed on a flat low-background silicon wafer.
Pow-der XRD measurements were carried out with CuK
a
radiation ata Bruker D8 Advance diffractometer (40 kV, 40 mA) in the range 4-60°2hin the step-scan mode 0.01 /20 s. First, the mineral was
semi-quantitatively analysed by EDS methods for chemical compo-sition. Later, phurcalite was quantitatively analysed by Cameca SX 100 electron microprobe system in wavelength dispersion mode. Studied sample was mounted into the epoxide resin and polished. The polished surface was coated with carbon layer 250 Å. An accel-eration voltage of 15 kV, a specimen current of 10 nA, and a beam
diameter of 5
l
m were used. Well-defined natural and synthetic compounds were used as standards. The raw intensities were con-verted to the concentrations using automaticPAPmatrix correction software package.Raman spectroscopy
The crystals of phurcalite were placed on the stage of an
Olym-pus BHSM microscope, equipped with 10and 50objectives and
part of a Renishaw 1000 Raman microscope system, which also in-cludes a monochromator, a filter system and a Charge Coupled De-vice (CCD). Raman spectra were excited by a HeNe laser (633 nm) at a resolution of 2 cm1in the range between 100 and 4000 cm1.
Repeated acquisition using the highest magnification was accumu-lated to improve the signal to noise ratio. Spectra were calibrated using the 520.5 cm1line of a silicon wafer. In order to ensure that
the correct spectra are obtained, the incident excitation radiation was scrambled. Previous studies by the authors provide more de-tails of the experimental technique. Spectra at liquid nitrogen tem-perature were obtained using a Linkam thermal stage (Scientific Instruments Ltd., Waterfield, Surrey, England).
Infrared spectroscopy
Infrared spectra were obtained using a Nicolet Nexus 870 FTIR spectrometer with a smart endurance single bounce diamond
ATR cell. Spectra over the 4000–525 cm1 range were obtained
by the co-addition of 64 scans with a resolution of 4 cm1and a
mirror velocity of 0.6329 cm/s. Spectral manipulation such as base-line adjustment, smoothing and normalisation was performed using the GRAMSÒsoftware package (Galactic Industries
Corpora-tion, Salem, NH, USA).
Spectroscopic manipulation such as baseline adjustment, smoothing and normalisation were performed using the Spectra-calc software package GRAMS (Galactic Industries Corporation, NH, USA). Band component analysis was undertaken using the Jan-del ‘Peakfit’ software package, which enabled the type of fitting, function to be selected and allows specific parameters to be fixed or varied accordingly. Band fitting was done using a Gauss–Lorentz cross-product function with the minimum number of component bands used for the fitting process. The Gauss–Lorentz ratio was maintained at values greater than 0.7 and fitting was undertaken until reproducible results were obtained with squared correlations ofr2greater than 0.995.
Results and discussion
Characterization of studied sample
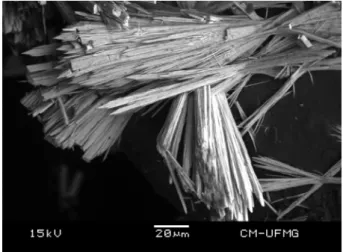
The BSI image of phurcalite sample studied in this work is shown inFig. 1. The image shows a 200
l
m aggregate of needle-like crystals. The unit-cell parameters of phurcalite refined from measured powder XRD:a17.391(1),b15.984(1),c13.561(2) Å,V3769.8(6) Å3, Z 8, agree very well with published data [15]. A
semi-quantitative EDS analysis shows calcium uranyl phosphate with minor amounts of Si and Al (Fig. 2). The results of EPMA study
(mean of 13 point analyses) - CaO 8.51, SiO20.36 P2O510.81, UO3
69.93, H2O (calc.) 9.99, total 99.60 wt. % yield on the basis of 7apfu
to empirical formulae Ca1.92(UO2)3.09[(PO4)1.92(SiO4)0.08]
R2.00-O1.97.7H2O. Minor content of Al (ED spectrum) was not confirmed
by EPMA data, it probably represents only a heterogeneous con-tamination of sample surface.
Raman and infrared spectroscopy
From the Raman and infrared spectra of phurcalite may be in-ferred the presence of uranyl ions, (UO2)2+, phosphate ions,
(PO4)3, and hydrogen bonded water molecules in its crystal
struc-ture. A free uranyl, (UO2)2+, point symmetryD/h, should exhibit three fundamental modes: (a) symmetric stretching vibration
m1
ðPþ
gÞ, Raman active, approximately 900–750 cm1, (b) doubly
degenerate bending vibration
m2
(d) (Pu), infrared active,approxi-mately 300–200 cm1, and (c) antisymmetric stretching vibration
m3
(Ru), infrared active, approximately 100–850 cm1[23].Tetra-hedralTd symmetry is characteristic for phosphate, (PO4)3,
an-ions. In the case of a free ion, there are nine normal vibrations characterised by four fundamental distinguishable modes of vibra-tions: (a) symmetric stretching vibration
m1
(A1), Raman active,approximately 990–930 cm1, (b) doubly degenerate in-plane
bending vibration
m2
(d) (E), Raman active, approximately 490– 410 cm1, (c) triply degenerate antisymmetric stretching vibrationm3
(F2), infrared and Raman active, approximately 1140–975 cm1,and (d) triply degenerate out-of-plane bending vibration
m4
(d) (F2),infrared and Raman active, approximately 670–510 cm1[23–28].
Molecular water, H2O, (point symmetry C2v is characterised by
three fundamentals, symmetric and antisymmetric OH stretching Fig. 2.EDS analysis of phurcalite.
Fig. 3.(a) Raman spectrum of phurcalite (upper spectrum) over the 100–4000 cm1
spectral range and (b) infrared spectrum of phurcalite (lower spectrum) over the 500–4000 cm1spectral range.
Fig. 4.(a) Raman spectrum of phurcalite (upper spectrum) in the 900–1200 cm1
vibrations
m1
(A1) (H2O (g) 3656.65 cm1) andm3
(B1) (H2O (g)3755.79 cm1), both approximately 3600–2900 cm1, and bending
vibration
m2
(d H2O) (A1), approximately 1700–1590 cm1. Allvibrations are infrared and Raman active. In the range of approxi-mately 900–300 cm1, three types of libration modes can occur:
s
-twisting,
x
-wagging, andq
-rocking[23,25]. Raman spectra of thephurcalite sample studied are presented in Figs. 3a (4000–
100 cm1), 4a (1300–800 cm1), 5a (800–300 cm1), 5b (500–
300 cm1), 6a (3800–3000 cm1) and 7a (1800–1300 cm1), its
infrared spectra in Figs. 3b (4000–500 cm1), 4b (1300–
500 cm1),6b (3800–2600 cm1) and7b (1800–1300 cm1).
Raman and infrared bands of uranyl, (UO2)2+, units
A Raman band at 810 cm1 with two shoulders at 800 and
819 cm1is assigned to the
m1
(UO2)2+symmetric stretching
vibra-tions. Their number supports the X-ray single crystal structure analysis, from which was inferred that phurcalite contains three nonequivalent, structurally (symmetrically) different U6+ in its
crystal structure. RRUFF samples R050534 and R060698 exhibit a
Raman band approximately at 806 cm1 with shoulders at 800
and 815 cm1, and 810 cm1, respectively. According to Bartlett
and Cooney[26], U–O bond lengths in uranyl, (UO2)2+, may be
in-ferred from the wavenumbers assigned to the
m1
(UO2)2+. For810 cm1 (this paper), this calculated value is 1.80 Å, for RRUFF
samples 809 cm1 and 1.802 Å. These values are in excellent
agreement with£1.805 (1.81; 1.179; 1.815) Å inferred from the
X-ray single crystal structure analysis[15]. Wavenumbers of Ra-man bands of the samples studied by Frost et al.[22]which may be attributed to the
m1
(UO2)2+ vary approximately from 796 to811 cm1, and therefore approximately from 1.81 to 1.80 Å.
Wave-numbers of the infrared bands attributed to the
m3
(UO2)2+anti-symmetric stretching vibrations are 874 cm1(this paper), 893 or
884 cm1 (two samples) [9], 890 cm1 [18], 885 cm1 [15] and
approximately from 861 to 888 cm1[22]. Calculated values are
1.804, 1.79, 1.804, 1.79, 1.796, 1.814 to 1.793 Å, respectively, the
average of them is 1.80 Å. Also all these calculated U–O bond
lengths in uranyl of the sample studied in this paper and those published are close to the lengths for three structurally nonequiv-alent uranyls given from the X-ray single crystal structure analysis of phurcalite by Atencio et al.[15]. Raman spectra below 300 cm1
were not recorded. However, from the RRUFF data base and also
[22]may be inferred that Raman bands related to the
m2
(d)bend-ing vibrations are located close to 250 cm1. Corresponding
infra-red band was observed at 255 cm1 [15]. U–O bond lengths in
uranyls, inferred from the wavenumbers of Raman and infrared bands assigned to uranyl stretching vibrations, are in agreement with the data presented by Burns[2,27].
Raman and infrared bands of phosphate, (PO4)3, units
Raman bands at 1155, 1118, 1108, 1059, 1009, 1004 cm1and
infrared bands at 1153, 1126, 1086, 1049 and 1024 cm1are
as-signed to the split triply degenerate
m3
(PO4)3 antisymmetricstretching vibrations. Camargo [9] observed infrared bands at
1151, 1106, 1052 and 1000; 1136, 1098, 1042 cm1(two samples
were studied), Brathwaite et al.[18]at 1148, 1110, 1063 and 1000; 1150, 1105, 1070 cm1(two samples were studied), Atencio et al. [15]two bands at 1140 and 1055 cm1, and Frost et al.[22]
infra-red bands at 1148, 1110, 1080, 1052 and 1024, 1150, 1127, 1110, Fig. 5.(a) Raman spectrum of phurcalite (upper spectrum) in the 700–900 cm1
spectral range and (b) Raman spectrum of phurcalite (lower spectrum) in the 300– 600 cm1spectral range.
Fig. 6.(a) Raman spectrum of phurcalite (upper spectrum) in the 1400–1900 cm1
1062 and 1027; 1146, 1127, 1106, 1085, 1059 and 1029 cm1and
Raman bands at 1105 and 1051; 1156, 1104, 1055 and 1007; 1151, and 1104 cm1(three samples were studied).
Raman bands at 995, 969, 960 and 950 cm1and infrared bands
at 979 and 941 cm1are attributed to the
m1
(PO4)3symmetric
stretching vibrations. Braithwaite et al. [18] observed infrared bands at 970 and 970 cm1(two samples studied), Atencio et al. [15] an infrared band at 960 cm1, and Frost et al. [22] Raman
bands at 997 and 956, 992, 967 and 958; 998 and 967 cm1(three
samples studied).
The number of the observed bands proves the presence of struc-turally (symmetrically) nonequivalent phosphate units in the crys-tal structure of phurcalite. This is in agreement with the single crystal structure analysis of phurcalite.
A Raman band at 546 cm1and Raman bands at 434, 431, 408
and 391 cm1are assigned to the triply degenerate
m4
(d) (PO 4)3out-of-plane bending vibration and to the doubly degenerate
m2
(d) (PO4)3in plane bending vibrations, respectively. Braithwaite
et al.[18]observed an infrared broad band at (590) cm1and
an-other infrared band at 545 cm1, in the second sample, only once
band at 540 cm1was observed. Atencio et al.[15]described
cor-responding infrared bands at 575 and 540 cm1 and 385 and
255 cm1, respectively.
Raman and infrared bands of molecular water vibrations
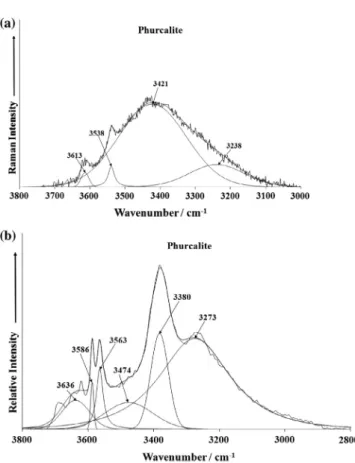
Raman bands at 3613, 3538, 3421 and 3238 cm1and infrared
bands at 3636, 3586, 3563, 3474, 3380 and 3238 cm1are assigned
to the
m
OH stretching vibrations of structurally distinct anddiffer-ently hydrogen bonded water molecules. According to Libowitzky
[28], O–H O hydrogen bond lengths approximately vary in the range from free or very weakly hydrogen bond hydrogen bonded water molecules (>3.2 Å) to relatively strong hydrogen bonded
water molecules (2.72 Å). Camargo studied to samples of his
mineral X (in fact phurcalite)[9]and observed infrared bands at 3423 and 3335 cm1, respectively, Braihwaite et al.[18]a broad
band at 3400 cm1and a band at 3180 cm1, Atentio et al.[15]a
broad band at 3400 cm1, Frost et al.[22]on studying three
phur-calite samples up to twelve infrared bands between 3700 and 2700 cm1.
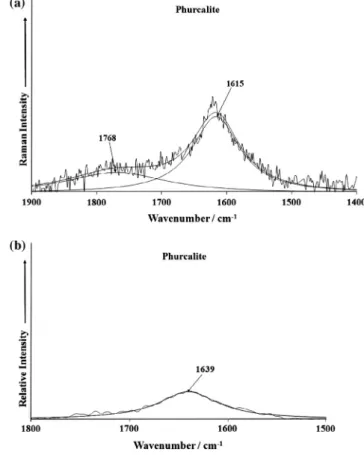
A Raman at 1615 cm1and a broad infrared band at 1639 cm1
are assigned to the
m2
(d) H2O bending vibrations. These valuescor-respond with infrared bands at 1612 or 1585 cm1 [9], a broad
infrared band at 1625 cm1[18], an infrared band at 1615 cm1 [15], and three infrared bands approximately in the range from
1678 to 1594 cm1 observed in three samples studied by Frost
et al. [22]. Infrared bands at 941, 913, 769, 726 and 703 cm1
may probably be related to the libration modes of hydrogen bonded water molecules. Only Frost et al.[22]observed infrared bands in these regions.
Conclusions
(a) Raman and infrared spectra of phurcalite from Red Canyon, Utah, USA, were recorded and tentatively interpreted. (b) Observed Raman and infrared bands were tentatively
assigned to the stretching and bending vibrations of (UO2)2+and (PO2)3units and water molecules.
(c) Approximate U–O bond lengths in uranyl were calculated from the wavenumbers of the (UO2)2+symmetric and
anti-symmetric stretching vibrations [26]. These values are in agreement with the data of the crystal structure analysis of phurcalite[15]and general data presented by Burns[2,27]. (d) Approximate O–H O hydrogen bond lengths of water
mol-ecules were inferred from the wavenumbers of the
m
OHstretching vibrations of water molecules[28].
(e) The presence of symmetrically nonequivalent (UO2)2+ and
(PO4)3and water molecules in the crystal structure of
phur-calite was inferred from the observed number of these struc-tural units. This agrees with the data from X-ray single crystal structure analysis[15].
Acknowledgements
The financial and infra-structure support of the Queensland University of Technology, School of Chemistry, Physics and Mechanical Engineering is gratefully acknowledged. The Australian Research Council (ARC) is thanked for funding the instrumentation. The authors would like to acknowledge the Center of Microscopy at the Universidade Federal de Minas Gerais ( http://www.microsco-pia.ufmg.br) for providing the equipment and technical support for experiments involving electron microscopy.
Further support was provided by long-term project DKRVO 2014/02 of the Ministry of Culture of the Czech Republic (National Museum 00023272) to J.Cˇ. and J.S. The downloading of the Raman spectra of phurcalite from the RRUFF web site is acknowledged.
References
[1]J. Cˇejka, Z. Urbanec, Secondary Uranium Minerals, Academia Praha, 1990. pp. 94.
[2]P.C. Burns, Can. Min. 43 (2005) 1839–1894.
[3]S. Krivovichev, J. Plášil, Mineralogy and crystallography of uranium, in: P.C. Burns, G.E. Sigmon (Eds.), Uranium – Cradle to Grave, Short Course Series, vol.
Fig. 7.(a) Raman spectrum of phurcalite (upper spectrum) in the 3000–3800 cm1
43, Mineralogical Association of Canada, Winnipeg, Manitoba, pp. 15–119. [4]M. Schindler, F.C. Hawthorne, Can. Min. 46 (2008) 467–501.
[5]F.C. Hawthorne, M. Schindler, Zeit. Krist. 223 (2008) 41–68. [6] A. Locock, Unpublished Private Communication 2007. [7]M. Deliens, P. Piret, Bull. Min. 101 (1978) 356–358;
M. Deliens, G. Comblain, Bull. Soc. Belge Géol. 87 (1978) 225–226. [8]P. Piret, J.-P. Declerq, Acta Cryst. B34 (1978) 1677–1679. [9]W.G.R. de Camargo, Boletim IGA (2) (1971) 85–201.
[10]J. Lencastre, M.M. Vairinho, Presidência do Conselho, Junta de Energia Nuclear, Lisboa, Portugal, 1970.
[11]R.T. Chew III, California Geol. 35 (1982) 246–247.
[12] H.E. Pemberton, Minerals of California, Mineralogical Abstracts 83M/2483 and 85/1182.
[13]D. Atencio, R. Hypolito, Rev. Bras. Geo. 24 (1994) 43–51.
[14]D. Atencio, R. Neumann, J. Aldo Carmo Jr., E.H. Mishima, Rev. Bras.Geo. 20 (1990) 330.
[15]D. Atencio, R. Neumann, A.J.G.C. Silva, Y.P. Mascarenhas, Can. Min. 29 (1991) 95–105.
[16]K. Walenta, Der Erzgräber 7 (1993) 1–3. [17]K. Walenta, Lapis 21 (1996) 75.
[18]R.S.W. Braithwaite, W.H. Paar, J.E. Chisholm, Min. Mag. 53 (1989) 583–589. [19]Y. Singh, K.D.P. Singh, A.K. Bhatt, J. Geol. Soc. Ind. 53 (1999) 355–357. [20] A.J.G.C. Silva, Thesis, Universidade de São Paulo 1990.
[21] D. Atencio, Thesis, Universidade de São Paulo 1991.
[22]R.L. Frost, M.L. Weier, W.N. Martens, J. Cˇejka, Vib. Spectrosc. 41 (2006) 205– 212.
[23]J. Cˇejka, Rev. Min. 38 (1999) 521–622.
[24] V.V. Pechkovskii, P.Ya Mel’nikova, E.D. Dzyuba, T.I. Barannikova, M.V. Nikanovich, Atlas of infrared spectra of phosphates. Orthophosphates. Nauka Moscow, 1981, pp. 248 (in Russian).
[25]K. Nakamoto, Infrared and Raman Spectra of Inorganic and Coordination Compounds, J. Wiley and Sons, New York, 1986. pp. 484.
[26]J.R. Bartlett, R.P. Cooney, J. Mol. Struct. 193 (1989) 295–300. [27]P.C. Burns, Rev. Min. 38 (1999) 23–90.