Vibrational spectroscopic study of the uranyl selenite mineral derriksite
Cu
4
UO
2
(SeO
3
)
2
(OH)
6
H
2
O
Ray L. Frost
a,⇑, Jirˇí Cˇejka
b, Ricardo Scholz
c, Andrés López
a, Frederick L. Theiss
a, Yunfei Xi
aa
School of Chemistry, Physics and Mechanical Engineering, Science and Engineering Faculty, Queensland University of Technology, GPO Box 2434, Brisbane Queensland 4001, Australia
b
National Museum, Václavské námeˇstí 68, CZ-115 79 Praha 1, Czech Republic
c
Geology Department, School of Mines, Federal University of Ouro Preto, Campus Morro do Cruzeiro, Ouro Preto, MG 35400-00, Brazil
h i g h l i g h t s
We have studied the mineral
derriksite Cu4UO2(SeO3)2(OH)6H2O. A comparison was made with the
other uranyl selenites.
Namely demesmaekerite, marthozite,
larisaite, haynesite and piretite.
Approximate U–O bond lengths in
uranyl and O–H O hydrogen bond lengths were calculated.
g r a p h i c a l
a b s t r a c t
a r t i c l e
i n f o
Article history:
Received 20 May 2013
Received in revised form 29 July 2013 Accepted 2 August 2013
Available online 22 August 2013
Keywords:
Derriksite Selenite
Raman spectroscopy Infrared spectroscopy Uranyl
U–O bond lengths
a b s t r a c t
Raman spectrum of the mineral derriksite Cu4UO2(SeO3)2(OH)6H2O was studied and complemented by the infrared spectrum of this mineral. Both spectra were interpreted and partly compared with the spec-tra of demesmaekerite, marthozite, larisaite, haynesite and piretite. Observed Raman and infrared bands were attributed to the (UO2)2+, (SeO3)2, (OH)and H2O vibrations. The presence of symmetrically dis-tinct hydrogen bonded molecule of water of crystallization and hydrogen bonded symmetrically disdis-tinct hydroxyl ions was inferred from the spectra in the derriksite unit cell. Approximate U–O bond lengths in uranyl and O–H O hydrogen bond lengths were calculated from the Raman and infrared spectra of derriksite.
Ó2013 Elsevier B.V. All rights reserved.
Introduction
The crystal chemistry of selenium(IV) oxo-compounds shows great structural versatility expressed by the great number of differ-ent compounds[1]. Crystallochemical systematics of selenites was presented by Serezhkina et al.[2].
Uranyl anion topology of uranyl natural and synthetic com-pounds inclusive of uranyl selenites has been elaborated by Burns [3–6]. According to Finch and Murakami[7], uranyl selenites occur where Se-bearing sulfide minerals are undergoing oxidation and dissolution. Derriksite, demesmaekerite, guilleminite and mar-thozite are from the Musonoi Cu–Co mine, near Kalwezi, Katanga Province, Democratic Republic of Congo, piretite and also guillem-inite from Shinkolobwe, Katanga Province, Democratic Republic of Congo, haynesite and larisaite from the Repete mine, San Juan Co., Utah, U.S.A[8,9].
1386-1425/$ - see front matterÓ2013 Elsevier B.V. All rights reserved. http://dx.doi.org/10.1016/j.saa.2013.08.026
⇑ Corresponding author. Tel.: +61 7 3138 2407; fax: +61 7 3138 1804.
E-mail address:[email protected](R.L. Frost).
Contents lists available atScienceDirect
Spectrochimica Acta Part A: Molecular and
Biomolecular Spectroscopy
Structures of derriksite, Cu4UO2(SeO3)2(OH)6H2O[10,11], and demesmaekerite, Pb2Cu5[(UO2)(SeO3)3]2(OH)6(H2O)2, are
charac-terized by infinite chains formed from uranyl and selenite ions [6,12], while those of the remaining uranyl selenite minerals, guil-leminite, Ba[(UO2)3O2(SeO3)2](H2O)3[13], marthozite, Cu[(UO2) 3-O2(SeO3)2](H2O)8 [14], larisaite, Na(H3O)[(UO2)3(SeO3)2O2](H2O)4
[9] and probably also haynesite, [(UO2)3(SeO3)2(OH)2](H2O)5
[15,16]and piretite, Ca[(UO2)3(SeO3)2(OH)4](H2O)4[16]by uranyl oxo-hydroxo selenite sheets and phosphuranylite anion sheet topology. According to Chukanov et al.[9], the general formula of the minerals guilleminite, marthozite, haynesite, piretite and lar-isaite is M0–1[(UO2)3(SeO3)2(O,OH)2–4]nH2O, where a= 3–8, M = M2+, 2M+. In derriksite, the uranyl coordination polyhedra are formed from tetragonal (square) dipyramids UO2O4, in dem-esmaekerite pentagonal dipyramids UO2O5, and probably in all remaining natural uranyl selenites from pentagonal and hexagonal dipyramids UO2O5 and UO2O6, respectively similarly as in phos-phuranylite. According to Ginderow and Cesbron[11], derriksite contains the brucite-type layers of CuO6. Derriksite is structurally related to deloryite, Cu4(UO2)(MoO4)2(OH)6and the difference in space group between the two minerals is the direct consequence of the replacement of the SeO3trigonal pyramids in derriksite by the MoO4tetrahedra in deloryite. Deloryite does not contain any molecular water. This differs from derriksite containing one water molecule. Ginderow and Cesbron[11]inferred from thermogravi-metric curve (TGA) presented by Cesbron et al.[10], that the first dehydration step (up to approximately 300°C) may be connected with adsorbed water. However, the original Cesbron’s interpreta-tion that this first TGA step corresponds with one molecule of water of crystallization[10]seems to be more correct.
Raman spectroscopy was proven most useful for the character-ization of secondary uranyl containing minerals[17–23]. The aim of this research is the study of Raman spectra of the natural uranyl selenite derriksite, complemented by its infrared spectra. The pa-per is a part of systematic vibrational spectroscopic research of sec-ondary minerals formed in the oxidation zone, inclusive uranyl minerals originating during hydration–oxidation weathering of primary uranium minerals, such as uraninite. Raman spectroscopy was proven most useful for the characterization of secondary ura-nyl containing minerals. In order to identify and characterize the Raman and infrared spectra of derriksite, this research reports the Raman and infrared spectrum of derriksite and relates the spectra of derriksite to the structure of the mineral.
Experimental
Mineral
For the development of this work, one single crystal of derrik-site was chosen for our investigation. Sample was obtained from the collection of the Geology Department of the Federal University of Ouro Preto, Minas Gerais with sample code SAB-098. The crystal is deep green and transparent, with up to 2.0 mm in length and oc-curs in association with malachite. The studied sample is from Musonoi Mine, Katanga, Democratic Republic of Congo and can be considered a type material.
The chemical analyses of the mineral have been made. These are included inSupplementary information.
Raman microprobe spectroscopy
Crystals of derriksite were placed on a polished metal surface on the stage of an Olympus BHSM microscope, which is equipped with 10, 20, and 50 objectives. The microscope is part of a
Renishaw 1000 Raman microscope system, which also includes a
monochromator, a filter system and a CCD detector (1024 pixels). The Raman spectra were excited by a Spectra-Physics model 127 He–Ne laser producing highly polarized light at 633 nm and col-lected at a nominal resolution of 2 cm1 and a precision of ±1 cm1in the range between 200 and 4000 cm1. Repeated acqui-sitions on the crystals using the highest magnification (50) were
accumulated to improve the signal to noise ratio of the spectra. Ra-man Spectra were calibrated using the 520.5 cm1line of a silicon wafer. The Raman spectrum of at least 10 crystals was collected to ensure the consistency of the spectra.
Infrared spectroscopy
Infrared spectra were obtained using a Nicolet Nexus 870 FTIR spectrometer with a smart endurance single bounce diamond ATR cell. Spectra over the 4000–525 cm1 range were obtained by the co-addition of 128 scans with a resolution of 4 cm1
and a mirror velocity of 0.6329 cm/s. Spectra were co-added to improve the signal to noise ratio. The infrared spectra are given in the sup-plementary information.
Spectral manipulation such as baseline correction/adjustment and smoothing were performed using the Spectracalc software package GRAMS (Galactic Industries Corporation, NH, USA). Band component analysis was undertaken using the Jandel ‘Peakfit’ soft-ware package that enabled the type of fitting function to be se-lected and allows specific parameters to be fixed or varied accordingly. Band fitting was done using a Lorentzian–Gaussian cross-product function with the minimum number of component bands used for the fitting process. The Gaussian–Lorentzian ratio was maintained at values greater than 0.7 and fitting was under-taken until reproducible results were obtained with squared corre-lations ofr2greater than 0.995.
Results and discussion
The Raman spectrum of derriksite over the full wavenumber range is illustrated in Fig. 1a. This figure displays the position and relative intensities of the Raman bands of derriksite. It may be observed that there are large parts of the spectrum where no intensity is found; therefore the spectrum is subdivided into sec-tions based upon the type of vibration being studied. The infrared spectrum of derriksite over the full wavenumber range is illus-trated inFig. 1b. This spectrum shows the position and relative intensities of the infrared bands of derriksite. The Raman spectrum of derriksite over the 700 to 1400 cm1
spectral range is reported in Fig. 2a. The infrared spectrum of derriksite over the 600 to 1400 cm1
spectral range is reported inFig. 2b. The Raman spectra of derriksite over the 300 to 700 cm1
and 100 to 300 cm1 spec-tral ranges are reported inFig. 3. The Raman and infrared spectra of the OH stretching region (2600–4000 cm1
) are shown in Fig. 4. The Raman and infrared spectra in the water bending region (1300–1800 cm1) are given inFig. 5.
The free linear uranyl group (UO2)2+, symmetryD1h, has four normal vibrations, but only three fundamentals: the
m
1symmetric stretching vibration, Raman active (approximately 900–700 cm1), them
2 (d) doubly degenerate bending vibration, infrared active(approximately 300–200 cm1
), and the
m
3antisymmetric stretch-ing vibration, infrared active (approximately 1000–850 cm1Fig. 1.(a) Raman spectrum of derriksite over the 100 to 4000 cm1spectral range.
(b) Infrared spectrum of derriksite over the 500 to 4000 cm1spectral range.
Fig. 2.(a) Raman spectrum of derriksite over the 800 to 1400 cm1spectral range.
(b) Infrared spectrum of derriksite over the 500 to 1300 cm1spectral range.
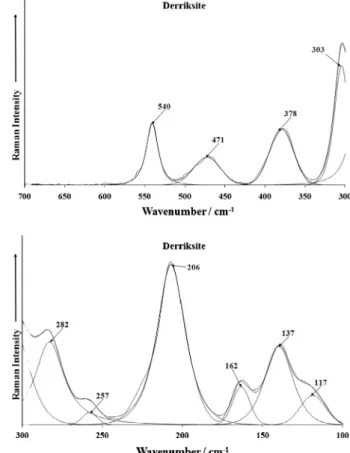
Fig. 3.(a) Raman spectrum of derriksite over the 300 to 800 cm1spectral range.
(b) Raman spectrum of derriksite over the 100 to 300 cm1spectral range.
Fig. 4.(a) Raman spectrum of derriksite over the 2600 to 4000 cm1spectral range.
thus makingC3vsymmetry[25]. The selenite ion (SeO3)2has four fundamentals: the
m
1 symmetric stretching vibrations (approxi-mately 790–806 or 760–855 cm1, them
2 symmetric bending vibration (approximately 430–461 cm1), the
m
3doubly degener-ate antisymmetric stretching vibration (714–769 or 680– 775 cm1
), and the
m
4doubly degenerate antisymmetric bending vibration (approximately 387–418 cm1). All vibrations are Raman and infrared active[26–29]. The degeneracy of the antisymmetricm
3andm
4modes of the (SeO3)2may be removed due to the low-ering of its site symmetry in the unit cell.
In the crystal structure of orthorhombic derriksite (S.G. Pn21m¼C72m ,a 5.570(2), b19.088(8),c 5.965 Å), there are one
symmetrically distinct U6+, two symmetrically distinct Se4+, three symmetrically distinct Cu2+, six symmetrically distinct O2
and four symmetrically distinct OH
,Z= 2[11].
Raman band at 788 cm1and an infrared band at 818 cm1are assigned to the
m
1(UO2)2+symmetric stretching vibrations, how-ever, both bands coincide with them
1(SeO3)2symmetric stretch-ing mode. No Raman band was attributed to the
m
3(UO2)2+ antisymmetric stretching vibration. An infrared band at 859 cm1 is assigned to them
3(UO2)2+ antisymmetric stretching vibration. Approximate U–O bond lengths in uranyl were calculated with two empirical relations using wavenumbers of the stretching uranyl vibrations, i.e. RU—O¼0:575þ106:5m
2=31 A, and RU—O¼
0:804þ91:41
m
2=33 A, published by Bartlett and Cooney [30]. Obtained calculated U–O bond lengths (Å/cm1) 1.823/788, 1.793/818 and 1.816/859 are close to the average U–O bond length 1.795 Å, inferred from the X-ray single crystal structure of derrik-site [10,11]. Raman band at 812 cm1 was assigned to the
m
1 (UO2)2-in marthozite[29]and haynesite[17]. In demesmaekerite, Raman band at 822 cm1
and an infrared band at 819 cm1 were attributed to the
m
1 (UO2)2+ symmetric stretching vibration and an infrared band at 878 cm1 to the (UO2)2+ antisymmetric
stretching vibration. Infrared bands at 879 and 820 cm1 in the spectrum of marthozite[29]and at 898 and 815 cm1in the spec-trum of piretite were attributed to the
m
3(UO2)2+andm
1(UO2)2+, respectively. Chukanov et al. [9] assigned the infrared band at 901 cm1 in the spectrum of larisaite to the uranyl stretching vibration.Raman band at 788 and infrared bands at 777 and 818 cm1 may be attributed to the
m
1(SeO3)2-symmetric stretching vibra-tions coinciding with them
1(UO2)2-symmetric stretching vibra-tions, and infrared bands at 727 and 749 to the doubly degeneratem
3 (SeO3)2 antisymmetric stretching vibrations. Ra-man band at 540 cm1is probably connected with the libration modes of water molecules or hydroxyl ions and/or to the
m
(U– Oligand) vibrations. Raman bands at 303 cm1 and 378 and 471 cm1are attributed to them
2and
m
4(SeO3)2-vibrations, respec-tively. Them
2(d) (UO2)2+bending vibrations were observed in theRaman spectrum at 282 and 257 cm1, while the bands at 206, 162, 135 and 117 cm1may be assigned to the lattice vibrations. Infrared spectrum of Sr[(UO2)3O2(SeO3)2](H2O)4, observed in this region is as follows: 909 cm1
(
m
3(UO2)2+), 865 cm1(
m
1(UO2)2+, 839, 814, 725 and 615 cm1[31]. The structure of this synthetic compound, however, contains two-dimensional [(UO2)3(O2 )(-SeO3)2]2-sheets with the same phosphuranylite anion sheet topol-ogy as found in the structures of guilleminite, marthozite and larisaite, and expected also in piretire and haynesite. This topology differs from that of derriksite and also demesmaekerite.Infrared bands in the 982 to 1121 cm1 and Raman band at 971 cm1are assigned to thedCu–OH bending vibrations. In this region, infrared bands were observed in demesmaekerite (infrared 1033, 1049, 1090, 1122, 1167 and 1194 cm1
), marthozite (1120, 1096, 1049 and 1027 cm1 [29], larisaite (1044 and 1095 cm1)
[9]and haynesite (1168, 1116, 1081 and 1036)[17,27,32], which may be also attributed to thedM–OH bending vibrations and/or
combination bands. Chukanov et al.[9]assume that some of these bands together with some other at different wavenumbers may be connected with the (H3O)+bending vibrations and that especially haynesite contains hydroxonium cations and may be formulated as (H3O)2[(UO2)3(OH)4(SeO3)2]H2O. However, marthozite does
not contain any hydroxonium ions and some bands in the men-tioned region may be also observed. Chukanov et al.[9]assigned a band at 1732 cm1in the infrared spectrum of haynesite to the doubly degenerate bending vibration of hydroxonium ions. It is more probable that this infrared band may be attributed to the combination (
m
1+m
3(UO2)2+) band, and some bands in the region 1000–1200 cm1may be connected with the combination (
m
1+m
2 (UO2)2+ and/or (m
3+m
2 (UO2)2+) bands. Frost et al. did not infer the presence of hydroxonium ions in the structure of haynesite in their Raman spectroscopic study of the uranyl selenite mineral haynesite[17]. In the case of derriksite, Raman bands at 881 and 943 cm1and infrared bands at 842 and 932 cm1may be related to the libration modes of water molecules and/or to thedCu–OHbending vibrations.
Infrared bands observed at 1319, 1385, 1505 cm1and Raman band at 1433 cm1may be connected with overtones and/or com-bination bands. Raman band at 1623 cm1
and the infrared band at 1647 cm1 are assigned to the d bending vibration of hydrogen bonded water molecules.
Raman bands at 3530 and 3407 cm1
and infrared bands at 3585, 3562, 3514 and 3381 cm1
are attributed to the
m
OH stretching vibrations of only weakly hydrogen bonded hydroxyls and those at 3247 and 2917 cm1and 3313 and 2978 cm1 , respectively, to the
m
OH stretching vibrations of hydrogen bonded water molecules. An infrared band at 2586 cm1may be connected with a combination band or an overtone. Approximate O–H Ohydrogen bond lengths inferred from observed wavenumbers vary in the range 3.2–2.64 Å[33]. These values are close those inferred Fig. 5.(a) Raman spectrum of derriksite over the 1300 to 1800 cm1spectral range.
from the X-ray single crystal structure analysis of derriksite [10,30]. Observed number of the infrared bands in the region of
m
OH stretching vibrations proves the presence of structurally non-equivalent hydroxyls and structurally nonnon-equivalent water mole-cules (water of crystallization) in the derriksite unit cell (Z= 2).Conclusions
(1) Raman and infrared spectra of uranyl selenite mineral der-riksite were measured, tentatively interpreted and partly compared with the spectra of demesmaekerite, marthozite, larisaite, haynesite, piretite and synthetic Sr[(UO2)3O2(SeO3)2](H2O)4.
(2) The presence of symmetrically distinct hydrogen bonded molecule of water of crystallization and hydrogen bonded hydroxyls was inferred from the spectra.
(3) Approximate U–O bond lengths in uranyls and O–H O
hydrogen bond lengths were inferred from the Raman and infrared spectra with empirical relations by Bartlett and Cooney[30]and Libowitzky[33], respectively[34–36]. They are close to the U–O and O–H O lengthes calculated on the
basis of X-ray single crystal structure of derriksite[11].
Acknowledgements
The financial and infra-structure support of the Discipline of Nanotechnology and Molecular Science, Science and Engineering Faculty of the Queensland University of Technology, is gratefully acknowledged. The Australian Research Council (ARC) is thanked for funding the instrumentation. The authors would like to acknowledge the Center of Microscopy at the Universidade Federal de Minas Gerais (http://www.microscopia.ufmg.br) for providing the equipment and technical support for experiments involving electron microscopy. R. Scholz thanks to CNPq – Conselho Nacional de Desenvolvimento Científico e Tecnológico (Grant No. 306287/ 2012-9).
Appendix A. Supplementary material
Supplementary data associated with this article can be found, in the online version, athttp://dx.doi.org/10.1016/j.saa.2013.08.026.
References
[1] M. Koskenlinna, Structural Features of Selenium(IV) Oxoanion Compounds, Thesis, Helsinky University of Technology, Espoo, 1996.
[2]L.B. Serezhkina, R.K. Rastsvetaeva, V.N. Serezhkin, Koord. Khim. 16 (1990) 1327–1339 (in Russian).
[3]P.C. Burns, Am. Mineral. 82 (1997) 1176–1186. [4]P.C. Burns, Can. Mineral. 43 (2005) 1839–1894.
[5]P.C. Burns, Mater. Res. Soc. Symp. Proc. 802 (2004) 89–100. [6]P.C. Burns, Rev. Mineral. 38 (1999) 23–90.
[7]R. Finch, T. Murakami, Rev. Mineral. 38 (1999) 91–179.
[8]J.F.W. Bowles, Handbook of mineralogy, in: J.W. Anthony, R.A. Bideaux, K.W. Bladh, M.C. Nichols (Eds.), Borates, Carbonates, Sulfates, vol. 5, Mineral Data Publishing, Tuscon, Arizona, USA, 2003.
[9]N.V. Chukanov, D.Y. Pushcharovsky, M. Pasero, S. Merlino, A.V. Barinova, S. Moeckel, I.V. Pekov, A.E. Zadov, V.T. Dubinchuk, Eur. J. Mineral. 16 (2004) 367– 374.
[10] R.P.F. Cesbron, T. Verbeek, Bull. Soc. Fr. 94 (1972) 534–537.
[11]D. Ginderow, F. Cesbron, Cryst. Struc. Commun. C39 (1983) 1605–1607. [12]D. Ginderow, F. Cesbron, Cryst. Struc. Commun. C39 (1983) 824–827. [13]M.A. Cooper, F.C. Hawthorne, Can. Mineral. 33 (1995) 1103–1109. [14]M.A. Cooper, F.C. Hawthorne, Can. Mineral. 39 (2001) 797–807. [15]M. Deliens, P. Piret, Haynesite, Can. Mineral. 29 (1991) 561–564.
[16]R. Vochten, N. Blaton, O. Peeters, M. Deliens, Can. Mineral. 34 (1996) 1317– 1322.
[17]R.L. Frost, M.L. Weier, B.J. Reddy, J. Cˇejka, J. Raman Spectrosc. 37 (2006) 816– 821.
[18]R.L. Frost, K.L. Erickson, M.L. Weier, O. Carmody, J. Cˇejka, J. Mol. Struc. 737 (2005) 173–181.
[19]R.L. Frost, M.L. Weier, T. Bostrom, J. Cˇejka, W. Martens, Neues Jahrb. Mineral. 181 (2005) 271–279.
[20] R.L. Frost, O. Carmody, K.L. Erickson, M.L. Weier, J. Cˇejka, J. Mol. Struc. 703 (2004) 47–54.
[21]R.L. Frost, D.A. Henry, K. Erickson, J. Raman Spectrosc. 35 (2004) 255–260. [22]R.L. Frost, M.L. Weier, M.O. Adebajo, Thermochim. Acta 419 (2004) 119–129. [23]R.L. Frost, K.L. Erickson, J. Cˇejka, B.J. Reddy, Spectrochim. Acta A61 (2005)
2702–2707.
[24]J. Cˇejka, Rev. Mineral. 38 (1999) 521–622.
[25]N.N. Greenwood, A. Earnshaw, Chemistry of Elements, Pergamon Press, Oxford, 1984.
[26]J. Cˇejka, J. Sejkora, R.L. Frost, E.C. Keeffe, J. Raman Spectrosc. 40 (2009) 1521– 1526.
[27]R.L. Frost, J. Cˇejka, Spectrochim. Acta A71 (2009) 1959–1963. [28]R.L. Frost, J. Cˇejka, M.J. Dickfos, J. Raman Spectrosc. 40 (2009) 476–480. [29]R.L. Frost, J. Cˇejka, E.C. Keeffe, M.J. Dickfos, J. Raman Spectrosc. 39 (2008) 1413–
1418.
[30] J.R. Bartlett, R.P. Cooney, J. Mol. Struc. 193 (1989) 295–300. [31]P.M. Almond, T.E. Albrecht-Schmitt, Am. Mineral. 89 (2004) 976–980. [32]R. Frost, B. Jagannadha Reddy, M. Dickfos, J. Near Infrared Spectrosc. 16 (2008)
455–469.
[33]E. Libowitzky, Monatshefte für Chem. 130 (1999) 1047–1059.
[34]R. Tali, V.V. Tabachenko, L.M. Kovba, Zh. Neorg. Khim. 38 (1993) 1450–1452 (in Russian).
[35]D.Y. Pushcharovsky, R.K. Rastsvetaeva, H. Sarp, J. Alloys Compd. 239 (1996) 23–26.