Teleostean Genomes in the Light of the Metabolic Rate
Hypothesis
Ankita Chaurasia1,2, Andrea Tarallo1, Luisa Berna`1,3, Mitsuharu Yagi4, Claudio Agnisola5, Giuseppe D’Onofrio1*
1Genome Evolution and Organization – Dept. Animal Physiology and Evolution, Stazione Zoologica Anton Dohrn, Villa Comunale, Napoli, Italy,2Campus UAB - CRAG Bellaterra - Cerdanyola del Valle`s, Barcelona, Spain,3Molecular Biology Unit, Institut Pasteur de Montevideo, Montevideo, Uruguay,4Faculty of Fisheries, Nagasaki University, Bunkyo, Nagasaki, Japan,5Department of Biological Sciences, University of Naples Federico II, Napoli, Italy
Abstract
A comparative analysis of five teleostean genomes, namely zebrafish, medaka, three-spine stickleback, fugu and pufferfish was performed with the aim to highlight the nature of the forces driving both length and base composition of introns (i.e., bpi and GCi). An inter-genome approach using orthologous intronic sequences was carried out, analyzing independently both variables in pairwise comparisons. An average length shortening of introns was observed at increasing average GCi values. The result was not affected by masking transposable and repetitive elements harbored in the intronic sequences. The routine metabolic rate (mass specific temperature-corrected using the Boltzmann’s factor) was measured for each species. A significant correlation held between average differences of metabolic rate, length and GC content, while environmental temperature of fish habitat was not correlated with bpi and GCi. Analyzing the concomitant effect of both variables, i.e., bpi and GCi, at increasing genomic GC content, a decrease of bpi and an increase of GCi was observed for the significant majority of the intronic sequences (from,40% to ,90%, in each pairwise comparison). The opposite event, concomitant increase of bpi and decrease of GCi, was counter selected (from,1% to,10%, in each pairwise comparison). The results further support the hypothesis that the metabolic rate plays a key role in shaping genome architecture and evolution of vertebrate genomes.
Citation:Chaurasia A, Tarallo A, Berna` L, Yagi M, Agnisola C, et al. (2014) Length and GC Content Variability of Introns among Teleostean Genomes in the Light of the Metabolic Rate Hypothesis. PLoS ONE 9(8): e103889. doi:10.1371/journal.pone.0103889
Editor:Igor B. Rogozin, National Center for Biotechnology Information, United States of America
ReceivedDecember 21, 2013;AcceptedJuly 7, 2014;PublishedAugust 5, 2014
Copyright:ß2014 Chaurasia et al. This is an open-access article distributed under the terms of the Creative Commons Attribution License, which permits unrestricted use, distribution, and reproduction in any medium, provided the original author and source are credited.
Funding:Funding for this research was provided by the Public funding of the National Ministry of Research and Education for the Stazione Zoologica A. Dohrn of Naples. SZN supported the PhD fellowship of AC, AT and LB. The funders had no role in the study design, data collection and analysis, decision to publish, or preparation of the manuscript.
Competing Interests:The authors have declared that no competing interests exist.
* Email: [email protected]
Introduction
Most of the DNA stored in eukaryotic cells is non-coding. Long considered as ‘‘junk DNA’’ because of the unclear biological significance [1], a rising body of evidence ‘‘sound the death knell’’ for the concept of useless DNA [2]. The results, mainly produced in the last decade, are clearly showing that non-coding regions are involved in replication and transcription functions [3–7].
In spite of the increasing evidence supporting an ‘‘abundant purifying selection’’ for intronic regulatory sequences [8], the forces driving the evolution of the intron architecture (namely length and base composition) still remains a debated subject. The link between intron length and base composition (the molar ratio of guanine plus cytosine, i.e. GC content) was first observed by Duret and colleagues analyzing several vertebrate genomes [9]. These authors reported that not only the coding sequences, but also the corresponding intronic sequences where shorter in the rich genes [9]. Interestingly, the different intron length of GC-poor and GC-rich genes was not affected by the occurrence of repetitive and/or transposable elements [9]. Further analysis carried out at the intra-genome level linked intron length to gene expression. On one side, several authors pointed out that small
introns were selected for highly expressed genes, thus favoring the hypothesis based on selection for transcription efficiency and/or economy [10–16]; on the other, a selection for the compactness of housekeeping genes was pointed out, thus upholding the hypothesis of a genome design [17]. However, more detailed analysis revealed that: i) housekeeping genes were no more compact than the narrowly expressed genes [15], and ii) a higher occurrence of short intron sequences in GC-rich more than in GC-poor genes was highlighted by several and different statistical approaches [13,17–19].
In 1995, Hughes and Hughes [20], comparing introns sizes in human versus chicken, noted that introns were shorter in birds, an observation confirmed later on by more exhaustive studies [21,22]. The authors pointed out that evolutionary constraints linked to the metabolic cost of flight, probably would shape the intron size [20]. A hypothesis, indeed, supported by the observation that the basal mammalian metabolic rate was lower than the avian ones [23].
from polar to tropical environment [24]. A more detailed analysis showed that the variability of the GC content among fishes living in different habitat was not dictated by a dissimilar rate of the methylation-deamination process of the CpG doublets [25]. Between metabolic rate and GC content a significant positive correlation was found [24].
In the present paper the genomes of five fishes, namelyDanio
rerio(zebrafish), Oryzias latipes (medaka), Gasterosteus aculeatus
(three-spine stickleback),Takifugu rubripes (fugu) andTetraodon
nigrovirids (pufferfish) were analyzed in the context of a link between the following variables: intron length, GC-content and metabolic rate. The results support the key role played by the metabolic rate in shaping architecture and base composition of intronic sequences.
Materials and Methods
Coding sequences (CDS) of the genome assembly were retrieved from the ENSEMBL (http://ftp.ensembl.org) for all five fishes namely:
D. rerio(Assembly: Zv7, Apr 2007, Ensembl Release: 48.7b); O. latipes(Assembly: HdrR, Oct 2005, Ensembl Release 48.1d); G. aculeatus (Assembly: BROAD S1, Feb 2006, Ensembl
Release 48.1e);T. rubripes (Assembly: FUGU 4.0, Jun 2005,
Ensembl Release 48.4h); T. nigroviridis (Assembly:
TETRA-ODON 7, Apr 2003, Ensembl Release 48.1j).
Intronic sequences were retrieved from UCSC Genome
browser (http://genome.ucsc.edu), for all five fishes namely:D.
rerio(Assembly: Apr 2007, Zv7/danRer5);O. latipes
(Assem-bly: Oct 2005, NIG/UT, MEDAKA 1/ oryLat2);G. aculeatus
(Assembly: Feb 2006, BROAD/gas Acu1);T. rubripes
(Assem-bly: Oct 2004 (JGI 4.2/ fr2); T. nigroviridis (Assembly: Feb
2004, Genoscope 7.0/tetNig1). In each genome the number of full
length genes (i.e. CDS+ introns) was:D. rerio17085,O. latipes
13247, G. aculeatus 16101, T. rubripes 19123, T. nigroviridis
10898. Sequences containing ambiguity in identification of certain bases were discarded. Basic sequence information were retrieved by using Infoseq, an application of EMBOSS package (EMBOSS, Release 5.0; http://emboss.sourceforge.net/). The software Co-donW (1.4.4) was used to detect stop codons within the reading frame of CDSs (hence removed from the dataset before inferring orthology) and to calculate the molar ratio of guanine plus cytosine (GC).
Orthologous CDS were identified using a Perl script, which performs reciprocal Blastp [26] and selects the Best Reciprocal
Hits. The e-value threshold to filter the blast results was e210.
Once pairs of orthologous CDS were identified between two species, the orthology was extended to the corresponding intronic
sequences. More precisely, if the coding sequencejithof speciesm
(CDSjm) turned out to be the ortholog of the coding sequenceskith
of species z (CDSkz), the intronic sequence (i.e. the sequence
obtained concatenating all internal introns) of CDSjm was
considered ortholog to the intronic sequence of CDSkz. Introns
at 59- and 39-flanking regions were disregarded. The differences in
GC-content (DGCi) and length (Dbpi) of intronic sequences were
computed for each pair of orthologs. Sequences showingDGCi,
|0.1%| and/or Dbpi,|100| were disregarded from further
analysis. The histogram showing the percentage of sequences Figure 1. The histograms show the base composition distribu-tion of the intronic sequences (GCi) in the five teleostean genomes.In each panel, the average GCi and the skewness (SK) of the distribution are reported.
removed in each pairwise comparison, before and after removing repetitive and transposable elements, was reported as supplemen-tary material (Figure S1). Incidentally, the amount of sequences removed was well below the threshold of 10%, unless in the
comparisonT. rubripes vs. T. nigroviridis(,20%), essentially due
to the very short phylogenetic distance between the two species [27].
The number of orthologous intronic sequences in each of the ten possible pairwise combinations among the five fishes were the
following: D. rerio - O. latipes (2874); D. rerio - G. aculeatus
(5703); D. rerio - T. rubripes (5351); D. rerio - T. nigroviridis (4473); O. latipes - G. aculeatus (3206); O. latipes - T. rubripes (2822); O. latipes - T. nigroviridis (2583); G. aculeatus - T. rubripes (5966) G. aculeatus T. nigroviridis (5077); T. rubripes -T. nigroviridis (4401). The percent of positive DGCi was calculated as follows:
Xn
j~1
(GCi {GCi )w07 Xn
j~1 xj
" #
100
where:n is number of orthologous genes between two speciesm
andz. The percent of positiveDbpi between species m and z was
calculated following the same rules. Needless to say, the percent of negative events was the complement to hundred.
RepeatMasker (Version 3.1.9, http://repeatmasker.org) was used to mask the interspersed repeats and low complexity DNA sequences.
Statistic was performed using the software StatView 5.0 and the VassarStats website (http://www.vassarstats.net/index.html). Da-ta regarding physiological and environmenDa-tal parameters of the five teleostean fishes were retrieved from www.fishbase.org/.
Specimens
Zebrafish and pufferfish were obtained from a local store (CARMAR, Italy), whereas three-spine stickleback (from now on shortly termed as stickleback) were collected in the Nature Reserve
of Posta Fibreno (FR, Italy). Medaka specimens were kindly provided by Dr. Conte (IGB, Naples – Italy).
Animals were maintained in the facilities of the Dept. of Biology of the University of Naples Federico II, and were acclimated for a minimum of 14 days prior to experiments in glass tanks with dechlorinated, continuously filtered and aerated water, with 10 h:14 h L:D photoperiod. Distinct environmental parameters were set for each species, according to their habitat conditions,
respectively: Zebrafish: 27uC, freshwater, pH 7.0; Medaka: 26uC,
freshwater, pH 6.5 (controlled via a CO2controller); Stickleback:
20uC, freshwater, pH 7.0; Pufferfish: 26uC, 10%salinity, pH 8.4.
Zebrafish and medaka were fed daily with commercial pellet (Tetramin, Tetra, Germany). Stickleback and pufferfish were fed daily with Chironomus’ larvae (Eschematteo s.r.l., Italy). All the species displayed a normal behaviour in the maintenance tanks. Before measuring oxygen consumption specimens were fasted for 48 h. The procedures described above were approved by the Animal Care Review Board of the University Federico II of Naples. Regarding fugu, data are available in [28].
Respirometry
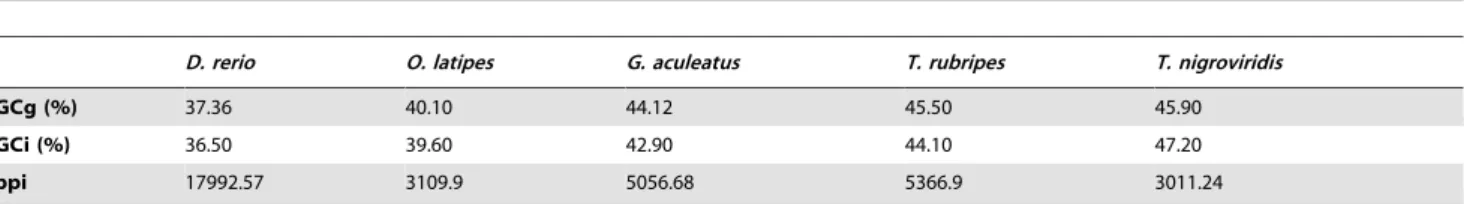
Oxygen consumption of individual specimen was performed in a closed system, using a respirometer whose volume was different according to the species used (ranging from 50 to 200 ml). Water conditions in the respirometer were identical to those of maintenance tanks for each species. An oxygen microelectrode (YSI 5357 Micro Probe, USA) was set through the respirometer cover to continuously record the water oxygen content. The microelectrode was connected to an Oxygen Monitor System (YSI 5300 A), whose output signal was acquired via an analogical-digital interface (Pico Technology Ltd, UK) connected to a PC for automated data acquisition using a specific software (Picolog Pico Technology Ltd., UK). Water in the respirometer was fully aerated and continuously stirred to maintain uniform the oxygen concentration. Before introducing the fish into the respirometric chamber, the oxygen sensor was calibrated at 100% air saturated water. Animals were weighed, transferred into the respirometric chamber and left undisturbed for 10–30 min to adapt to the new Table 1.Average values of genome (GCg) and intron (GCi) base composition, intron lenght (bpi) and metabolic rate temperature-corrected by Boltzmann’s factor (MR) in fish genomes.
D. rerio O. latipes G. aculeatus T. rubripes T. nigroviridis
GCg (%) 37.36 40.10 44.12 45.50 45.90
GCi (%) 36.50 39.60 42.90 44.10 47.20
bpi 17992.57 3109.9 5056.68 5366.9 3011.24
doi:10.1371/journal.pone.0103889.t001
Table 2.Average bp% and GC% of repetitive elements removed by Repeat Masker.
bp% S.E. GC% S.E.
D. rerio 5.710 0.086 14.200 0.023
O. latipes 2.224 0.133 23.459 0.005
G. aculeatus 2.040 0.032 35.517 0.003
T. rubripes 3.576 0.070 39.807 0.004
T. nigroviridis 3.059 0.058 42.685 0.004
S.E. = standard error.
ambient. After adaptation, aeration was set off, the chamber was closed, and the fall in oxygen content was recorded. No more than 15–20% of oxygen content fall was allowed. Atmospheric pressure
during determination was measured and used to calculate pO2
according to the equation:
pO2~ðAP{SVPÞ 0:2096
where:APis the atmospheric pressure (kPa),SVPis the saturated
vapor pressure of water at the temperature of measurement, and
0.2096 the O2fraction in the air. From the pO2value, the oxygen
concentration, in mg l21, was calculated as: [O2] = pO2 x a,
wherea(in mg-O2l21kPa21) is the oxygen solubility in water at
the temperature and salinity of measurement. Knowing the
chamber volume, the total amount of oxygen (in O2mg) in the
chamber as a function of time during the oxygen consumption measurement is determined. The linear regression of the total
oxygenvs.time relationship gives the amount of oxygen consumed
by the animal per unit time. Dividing this value by the animal weight gives the specific oxygen consumption. Regarding fugu, Yagi and colleagues [28] followed a similar methodology, and published results were supplemented with additional data.
Data regarding oxygen consumption were obtained in resting or routine conditions, avoiding any possible source of stress. Fish
mass specific metabolic rate values, expressed as mgO2x kg21x
h21, were temperature-corrected using the Boltzmann’s factor
(MR = MR0e
E/kT,
where MR is the temperature- corrected mass
specific metabolism, MR0is the metabolic rate at the temperature
T expressed in K; E (energy activation of metabolic processes)
=,0.65 eV; k (the Boltzmann’s constant) = 8.6261025eV K21
[29].
Results
The five species analyzed in the present paper, ordered according to the phylogenetic tree reported in [27], showed an increasing GC-content (Table 1). The genomic and the intronic base composition (GCg and GCi, respectively) showed the same
ranking order, i.e.D. rerio(zebrafish),O. latipes(medaka),G.
aculeatus (stickleback) , T. rubripes (fugu) , T. nigroviridis (pufferfish). In each species, GCi was lower than the corresponding
GCg, with the exception ofT. nigroviridis. As expected, the two
variables were significantly correlated (p-value,6.761023). On
the contrary, bpi showed no correlation with GCg, GCi (Table 1). In Fig. 1 (panels A-E), the histograms of the GCi distribution in each genome were reported. Species were ordered according to the increasing phylogenetic distance [27]. Interestingly: i) the GCi% was higher in stickleback than zebrafish; and ii) the values of the skewness (SK) were negatively correlated with the corresponding GCi%. These results were in contradiction with the thermostability hypothesis, since GC and genome heteroge-neity (due to the formation of GC-rich isochores) are expected to increase at increasing environmental temperature ([42], for a review). The complete statistical analysis of GCi distribution in each genome was reported as supplementary material (Table S1). The lack of correlation between bpi and both GCg and GCi (Table 1) deserved further consideration. Indeed, the number of
available full gene sequences (i.e. CDS+introns) was very different
for each species (see Materials and Methods). In order to avoid any bias due to the size of the datasets, the comparative genome analysis was restricted to sets of orthologous intronic sequences (see Materials and Methods). Moreover, to highlight the possible effect of transposable and/or repetitive elements, the software Repeat-Masker was used to clean up all the intronic sequences. The
average length (bp%) of the intronic sequence masked by RepeatMasker in each species, as well as the corresponding GC%, were reported in Table 2. Regarding length, the introns of zebrafish and stickleback showed the highest and the lowest effect of the RepeatMasker step. On the average intronic sequences were
shortened by a,6% and,2%, respectively (Table 2). Regarding
base composition, values were increasing from zebrafish (,14%)
to pufferfish (,42%). In spite of such a great variability, the
average GCi% values before and after RepeatMasker changed
slightly from set to set of orthologous introns (Table 3), and were barely different from those of the whole set of intronic sequences (Table 1). The SK values of each GCi distribution of orthologous intronic sequences, before RepeatMasker, were reported in Table S2. For each species the average SK value was: 0.45 (zebrafish), 1.087 (medaka), 0.67 (stickleback), 0.50 (fugu) and 0.69 (pufferfish).
The differences in length (Dbpi) and base composition (DGCi) of
the intronic sequences, before and after RepeatMasker, were computed independently for each variable in each pairwise Figure 2. The histogram shows the percents of orthologous intronic sequences increasing in length (Dbpi, blue bars) and GC content (DGCi, red bars) in each pairwise comparison.Data before (bRM) and after (aRM) RepeatMasker are reported. In cluster A: comparison of medaka, stickleback, fugu and pufferfish against zebrafish. In cluster B: comparison of stickleback, fugu and pufferfish against medaka. In cluster C: comparison of fugu and pufferfish against stickleback. Within each cluster pairwise comparisons were ordered according to the increasing phylogenetic distance.
doi:10.1371/journal.pone.0103889.g002
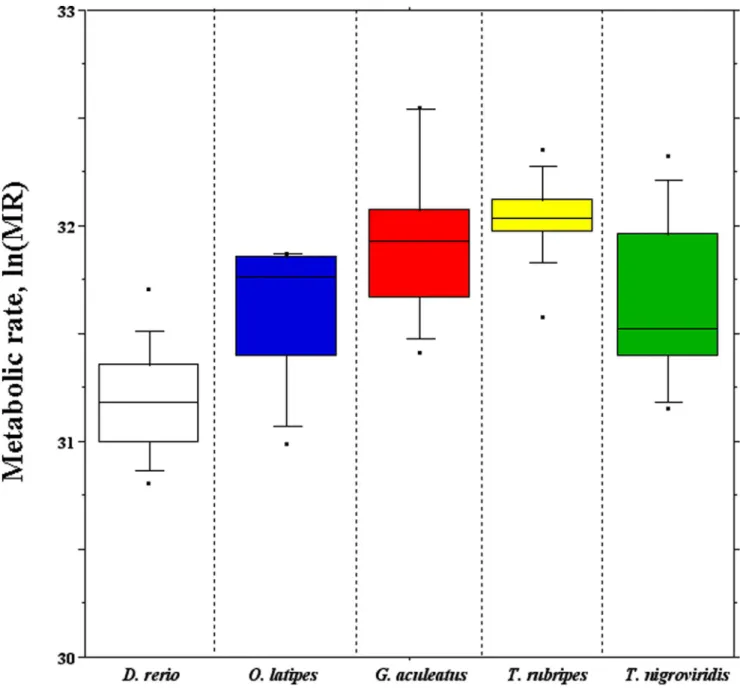
Figure 3. Box plots of the routine metabolic rate temperature-corrected using the Boltzmann’s factor (MR) measured in each teleostean fish.
comparison of orthologous intronic sequences. The pairwise comparisons were grouped in three clusters. The first (A) grouping
Ds of medaka, stickleback, fugu and pufferfish vs zebrafish (i.e.
Dmedaka-zebrafish; Dstickleback- zebrafish; Dfugu-zebrafish and D
pufferfish-zebrafish); the second (B) grouping those of stickleback, fugu and
pufferfishvs.medaka; and the third (C) comprising those of fugu
and pufferfish vs. stickleback (Fig. 2). Comparisons within each
cluster were ordered according to the increasing phylogenetic distance [27]. In Fig. 2, the histogram bars referred to the
percentage of sequences longer (Dbpi%, blue bars) and GC-richer
(DGCi%, red bars) in the first of the two species (for example
medaka in the D medaka-zebrafish). The percents of intronic
sequences longer and GC-richer in the second species (i.e.
zebrafish in theDmedaka-zebrafish) accounted for the complement
to hundred (not shown).
No significant differences were observed before and after RepeatMasker (Fig. 2), with the exception of data regarding
cluster A, whereDGCi, after removing transposable and repetitive
elements, was reduced in each pairwise comparison of a,10%. In
Fig. 2,Dbpi% andDGCi% displayed an opposite behavior within
each pairwise comparison, indicating that the majority of the intronic sequences were shorter and/or GCi-richer in the first of
the two species (for example medaka in theDmedaka-zebrafish). For
example, in the clusterA, theDbpi values, even after
RepeatMas-ker, were very low,11%,,9%,,5% and,3%, whereas those
of the correspondingDGCi were very high,70%, 90%,,88%
and,92%. The above trend was observed also in clustersBand
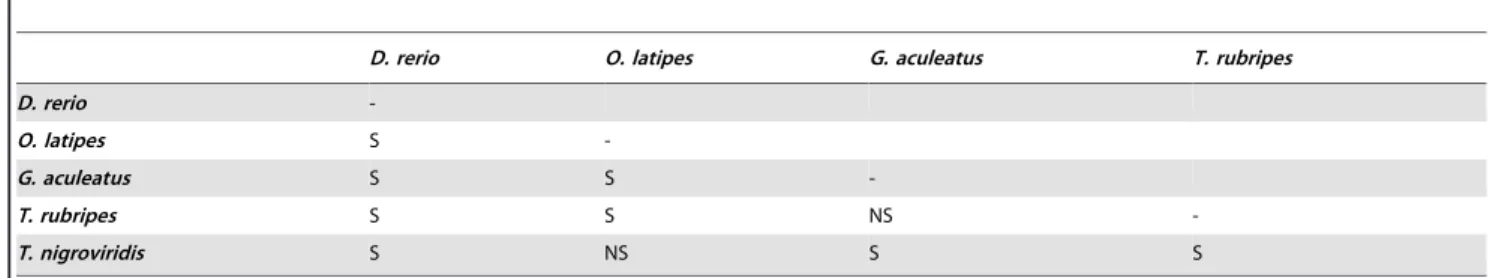
C, as well as in the pairwise comparison fuguvs.pufferfish (Fig. 2). The routine metabolic rate was measured for each species. The values were temperature-corrected using the Boltzmann’s factor, and shortly denoted as metabolic rate (MR). For each species, the distribution of log-normalized MR values was reported as box plots (Fig. 3), while the average values were reported in Table S3, also reporting the physiological parameters, i.e. the environmental
ranges of temperature (uC) and salinity (S%) of the five fishes. The
Student-Newman-Keuls post hoc test for multiple comparisons
was performed to assess the significance (thresholdp,0.561022)
of the MR differences observed among species (Table 4). In short:
i) the MR of zebrafish was significantly the lowest; ii) that of medaka was significantly lower than those of stickleback and fugu, but not significantly different from that of pufferfish; iii) the MR of stickleback and fugu were not significantly different; iv) that of pufferfish was significantly different from those of stickleback and fugu.
The MR average values showed a correlation with GCg
(p-value,8.561022), and no correlation with GCi. It is worth to
bring to mind that in a larger dataset of 34 teleostean species the
correlation between MR and GCg was highly significant,
p-value,2.561023[24]. For each pair of species, theDMR values
were computed and correlated with the correspondingDGCi and
Dbpi average values obtained before running RepeatMasker. The
Spearman rank correlation test was performed to assess the
statistical significance (Table 5).DGCi andDbpi were significantly
correlated (Rho -0.709,p-value,3.361022), as well asDGCi and
DMR (Rho 0.770, p-value,2.161022), while the correlation
between Dbpi and DMR was at the limit of the statistical
significance (Rho -0.648, p-value,5.161022). Replacing DMR
withDTu, i.e. the increments of the average, or the maximum,
environmental temperature experienced by each species, no
significant correlation was observed with both DGCi (Rho
-0.287, p-value,42.161022 and Rho -0.126, p-value,
72.8.161022, respectively) Dbpi (Rho -0.037, p-value,
92.161022and Rho -0.101,p-value,78.161022, respectively).
Intron length (Dbpi) and GC content (DGCi) were further
analyzed, testing the concomitant effect of both variables on the intronic sequences. Orthologous sequences of each pairwise genome comparison were grouped into four classes, according to the following criteria:
a) negativeDbpi and positiveDGCi values, named as N/P;
b) both negativeDbpi andDGCi values, named as N/N;
c) positiveDbpi and negativeDGCi values, named as P/N;
d) both positiveDbpi andDGCi values, named as P/P.
The frequencies of each class in each pairwise comparison, before and after RepeatMasker, were reported in Fig. 4, clustered Table 4.Student-Newman-Keuls post hoc test.
D. rerio O. latipes G. aculeatus T. rubripes
D. rerio
-O. latipes S
-G. aculeatus S S
-T. rubripes S S NS
-T. nigroviridis S NS S S
S = significant (threshold levelp,5.061022). NS = not significant.
doi:10.1371/journal.pone.0103889.t004
Table 5.Correlation coefficients Rho (in italic) andp-values (in bold) of Spearman correlation test.
Dbpi DGCi DMR
Dbpi - ,3.361022 ,5.161022
DGCi 20.709 - ,2.161022
DMR 20.648 0.770
and ordered as in Fig. 2. Also in this analysis, substantial differences before and after RepeatMasker were only observed
in clusterA, mainly affecting the N/P class (Fig. 4). Nevertheless,
in all pairwise genome comparison, the N/P class showed the highest frequency. The significance of the different frequencies observed among the four classes was tested by the one-side binomial statistical test [30] (Table S4, for details). The N/P class
was significantly the highest in all pairwise comparisons,p-value,
361025. Even after RepeatMasker, the N/P values in the cluster
Aranged from,59% ofDmedaka-zebrafishto,86% ofDpufferfish
-zebrafish; inBfrom,44% ofDsticleback-medakato,62% ofD
pufferfish-medaka; inCfrom,40% ofDfugu-sticlebackand,58%. ofD
pufferfish-sticleback(Fig. 4). In the comparisonDpufferfish-sticlebackthe N/P class
was close to 50%.
Within each cluster, no specific trend was observed for the N/ N, P/N and P/P. The N/N class was at the second rank position
in six over ten pairwise comparisons, ranging from ,3% (in
zebrafishvs.stickleback) to.30% (in sticklebackvs.fugu). The P/
N class (ranging from,1% to ,10%) was the less represented,
particularly in clusterA; while the P/P class, ranging from,3% to
,28%, was mainly represented in the clusterB(Fig. 4).
Discussion
A general agreement on the hypothesis that selection mainly shapes the intron length through the expression level can be found in the current literature [10,12,13,15,33,34]. On the contrary, the link between the forces shaping both the regional GC content and the intron length remains a debated issue since evidence have been produced both in favor or against [9,13,17,18,31,33].
Within the frame of the metabolic rate hypothesis [35], Vinogradov pointed out that increments of the GC content, on one side, increase the DNA bendability [35] and, on the other, reduce the nucleosome formation potential [32]. Recently, the
former point was further confirmed [36].In situhybridization of
probes with different base composition showed that GC-rich chromosomal regions were, indeed, characterized by an open chromatin structure, while GC-poor ones characterized by a close chromatin structure [37]. Hence, an increment of the GC should increase: i) the probability that a GC-rich CDS, mainly bearing short non-coding sequences, could be harbored in a GC-rich and actively transcribed genome region [13,18,31,38]; and ii) the DNA bendability, thus reducing the probability to have DNA breakages during the transcription process [35].
In the present study a linear correlation between intron length (bpi) and the corresponding GC content (GCi) was not found. Neither analyzing the whole data set of intronic sequences available for each genome (Table 1), nor each subset of othologous intronic sequences.
However, starting from orthologous intron sets and computing
independentlyDbpi andDGCi in each pairwise genome
compar-ison, a different picture came out. For example, in the pairwise
comparison Dmedaka-zebrafish the largest part of the intronic
sequences of medaka showed a lower length and a higher GCi content (Fig. 2). The same applied in all pairwise comparisons before and after cleaning sequences by RepeatMasker). Differ-ences between before and after RepeatMasker were observed only
in the pairwise comparisons of the cluster A(Fig. 2). The effect
should be ascribed to the high occurrence of type II transposable
elements covering,39% of zebrafish genome, against a ,10%
observed in medaka, stickleback fugu and pufferfish [39]. For each species, the routine metabolic rate was measured and temperature-corrected using the Boltzmann’s factor, according to
[29]. Differences of the average metabolic rate (DMR) were
calculated in each pairwise comparison of the teleostean species.
Interestingly, DMR was correlated negatively with the average
Dbpi and positively with the average DGCi (Table 5) computed
before RepeatMasker. Both correlations were statistically
signifi-cant (Table 5). In turn, Dbpi and DGCi were negatively and
significantly correlated (Table 5). The correlation of DMR vs.
Dbpi was of particular interest because opened to the hypothesis
that the occurrence of transposable and repetitive elements would be under the ultimate control of the metabolic rate of the organisms. A random insertion of transposable elements or a random increment of the repetitive elements in the intronic
regions, indeed, should alter the opposite trend betweenDbpi and
DGCi. However, the negative trend between the two variables was
found to hold also after cleaning up intronic sequences by RepeatMasker (Fig. 2).
The analyses of the four possible combinations of the differences in intron length and GC content (the four classes in Fig. 4), further supported the inverse relationship between the two variables. Indeed, the N/P class (grouping intronic sequences showing
concomitantly negative Dbpi and positive DGCi values) was
significantly the highest in all pairwise comparisons, p-value,
361025, also after RepeatMasker (Fig. 4). Conversely, the P/N
class (grouping intronic sequences showing concomitantly positive
values forDbpi and negative ones forDGCi) was counter selected,
accounting on the average for,5% the orthologous set of genes.
In short, in each pairwise comparison the largest majority of intronic sequences (N/P class) were under a converging constraint for a reduction of the length and an increment of the GC content. For the other sequences grouped in the P/P, P/N and N/N classes such a converging constraint was most probably not of use, likely because of different or no constraints. Regarding the P/P and the P/N, a possible explanation could be that those classes are most probably harboring: i) genes on which the co-transcriptional splicing is taking place, a process mainly affecting genes carrying long and GC-rich introns [40]; or ii) genes showing alternative splicing, a process that was reported to be favored in genes harboring long introns [41].
A possible explanation for the discrepancy between the intra-and the inter-genomes analysis most probably could be ascribed to
the fact that the former was a picture of a status quo, i.e. a
snapshot of a genome, whereas the latter was an analysis of anin
fieriprocess, i.e. a work in progress. Indeed, it is worth to recall that all pairwise comparisons between fishes were performed according to the phylogenetic relationship of the five species [27].
Recent analysis on a large dataset of fishes, ,150 teleostean
species, showed that MR and GCg were both decreasing from polar to tropical habitat and that the positive correlation between the two variables was statistically significant [24,25].
Actually, the metabolic rate hypothesis is not the only one proposed to explain the GC content variability among and within genomes. Two alternative hypotheses have been proposed.
increments of temperature [42]. According to this hypothesis, increments of environmental or body temperature (for poikilo-therms and homeopoikilo-therms, respectively), should affect the genomic GC content, and in particular the genome base composition heterogeneity, due to the formation of GC-rich isochores [42].
Present data were not supporting the hypothesis. In fact, Jabbari and colleagues, comparing orthologous coding sequences between fugu and pufferfish, showed that both GC content and compo-sitional heterogeneity were higher in the latter, ascribing the results to the higher environmental temperature of pufferfish [43]. However, although if our data regarding SK and GCi of these two species were in agreements with the above report (Fig. 1, Table S2 and Table 3), extending the pairwise comparisons to the other species (Table S2), discrepancies between SK, GCi and living temperature were observed. Indeed, stickleback, living in an
environmental temperature range of 4–20uC (Table S3), showed
both higher SK and GCi (Table S2 and Table 3) and incidentally also higher GCg (Table 1) values than those of zebrafish, living in
the range of 18–24uC (Table S3). The above results, on one side,
were in agreement with the structure of the isochores found in stickleback and zebrafish genomes [44], but, on the other, were in contradiction with the thermodynamic hypothesis [42]. The observation that polar teleosts were characterized by a GCg higher than those of tropical ones, not ascribed to an increased deamination process [24,25], further confuted the thermodynamic hypothesis.
The second one, essentially based on the biased gene conversion (BGC), linked the high GC content to the high recombination rate [45–47]. However, an analysis of vertebrate genomes showed that no correlation was observed between GC content and recombi-nation rate among vertebrate genomes [48]. Thus the BGC hypothesis seems not apt to explain the GC content variability among organisms. Indeed, also in bacteria the BGC hypothesis was rejected [49].
In conclusion, the metabolic rate seems to be the main selective factor driving the evolution of the genome architecture, in
particular regarding length and base composition of intronic sequences. The present results not only further support previous observations about genome evolution of vertebrates [24,25,50], but also open a challenge for a comparative study of the gene expression level among teleosts.
Supporting Information
Figure S1 Removed sequences for each pairwise
com-parison. (PDF)
Table S1 Descriptive Statistics of GCi distribution.
(PDF)
Table S2 Skewness of GCi% in each set of orthologous
introns before RepeatMasker. (PDF)
Table S3 Physiological parameters for the five analyzed
fish. (PDF)
Table S4 Binomial test, before and after
RepeatMas-ker, for all the pairwise comparisons. (PDF)
Acknowledgments
Thanks are due to Dr. Claudia Angelini for fruitful help in statistical analysis, and to Dr. Massimo Di Giulio, as well as the two referees Dr. Alexei Fedorov and anonymous one, for constructive criticisms improving the presentation of the paper.
Author Contributions
Conceived and designed the experiments: CA GD. Performed the experiments: AC LB AT MY. Analyzed the data: AC AT GD. Contributed reagents/materials/analysis tools: AT CA. Wrote the paper: AC AT CA GD.
References
1. Ohno S (1972) So much ‘‘junk’’ DNA in our genome. Brookhaven Symp Biol 23: 366–370.
2. Pennisi E (2012) Genomics. ENCODE project writes eulogy for junk DNA. Science 337: 1159, 1161.
3. Mattick JS, Gagen MJ (2001) The evolution of controlled multitasked gene networks: the role of introns and other noncoding RNAs in the development of complex organisms. Mol Biol Evol 18: 1611–1630.
4. Mattick JS (2001) Non-coding RNAs: the architects of eukaryotic complexity. EMBO Rep 2: 986–991.
5. Fedorova L, Fedorov A (2003) Introns in gene evolution. Genetica 118: 123– 131.
6. Shabalina SA, Spiridonov NA (2004) The mammalian transcriptome and the function of non-coding DNA sequences. Genome Biol 5: 105.
7. Derrien T, Johnson R, Bussotti G, Tanzer A, Djebali S, et al. (2012) The GENCODE v7 catalog of human long noncoding RNAs: analysis of their gene structure, evolution, and expression. Genome Res 22: 1775–1789.
8. Ward LD, Kellis M (2012) Evidence of abundant purifying selection in humans for recently acquired regulatory functions. Science 337: 1675–1678. 9. Duret L, Mouchiroud D, Gautier C (1995) Statistical analysis of vertebrate
sequences reveals that long genes are scarce in GC-rich isochores. J Mol Evol 40: 308–317.
10. Castillo-Davis CI, Mekhedov SL, Hartl DL, Koonin EV, Kondrashov FA (2002) Selection for short introns in highly expressed genes. Nat Genet 31: 415–418. 11. Eisenberg E, Levanon EY (2003) Human housekeeping genes are compact.
Trends Genet 19: 362–365.
12. Urrutia AO, Hurst LD (2003) The signature of selection mediated by expression on human genes. Genome Res 13: 2260–2264.
13. Versteeg R, van Schaik BD, van Batenburg MF, Roos M, Monajemi R, et al. (2003) The human transcriptome map reveals extremes in gene density, intron length, GC content, and repeat pattern for domains of highly and weakly expressed genes. Genome Res 13: 1998–2004.
14. Comeron JM (2004) Selective and mutational patterns associated with gene expression in humans: influences on synonymous composition and intron presence. Genetics 167: 1293–1304.
15. Li SW, Feng L, Niu DK (2007) Selection for the miniaturization of highly expressed genes. Biochem Biophys Res Commun 360: 586–592.
16. Rao YS, Wang ZF, Chai XW, Wu GZ, Zhou M, et al. (2010) Selection for the compactness of highly expressed genes in Gallus gallus. Biol Direct 5: 35. 17. Vinogradov AE (2004) Compactness of human housekeeping genes: selection for
economy or genomic design? Trends Genet 20: 248–253.
18. Arhondakis S, Auletta F, Torelli G, D’Onofrio G (2004) Base composition and expression level of human genes. Gene 325: 165–169.
19. Wang D, Yu J (2011) Both Size and GC-Content of Minimal Introns Are Selected in Human Populations. PLoS One 6: e17945.
20. Hughes AL, Hughes MK (1995) Small genomes for better flyers. Nature 377: 391.
21. Vinogradov AE (1998) Genome size and GC-percent in vertebrates as determined by flow cytometry: the triangular relationship. Cytometry 31: 100–109.
22. Zhang Q, Edwards SV (2012) The evolution of intron size in amniotes: a role for powered flight? Genome Biol Evol 4: 1033–1043.
23. Kozlowski J, Konarzewski M, Gawelczyk AT (2003) Cell size as a link between noncoding DNA and metabolic rate scaling. Proc Natl Acad Sci U S A 100: 14080–14085.
24. Uliano E, Chaurasia A, Berna´ L, Agnisola C, D’Onofrio G (2010) Metabolic rate and genomic GC. What we can learn from teleost fish. Marine Genomics 3: 29–34. doi:10.1016/j.margen.2010.1002.1001.
25. Chaurasia A, Uliano E, Berna´ L, Agnisola C, D’Onofrio G (2011) Does Habitat Affect the Genomic GC Content? A Lesson from Teleostean Fish: A Mini Review Huppage, NY (USA): Sean P. Dempsey Ed. Nova Science Publishers. 61–80 p.
27. Loh YH, Brenner S, Venkatesh B (2008) Investigation of loss and gain of introns in the compact genomes of pufferfishes (Fugu and Tetraodon). Mol Biol Evol 25: 526–535.
28. Yagi M, Kanda T, Takeda T, Ishimatsu A, Oikawa S (2010) Ontogenetic phase shifts in metabolism: links to development and anti-predator adaptation. Proc Biol Sci 277: 2793–2801.
29. Gillooly JF, Brown JH, West GB, Savage VM, Charnov EL (2001) Effects of size and temperature on metabolic rate. Science 293: 2248–2251.
30. Benjamini Y, Hocheberg Y (1997) Multiple hypotheses testing with weights. Scandinavian Journal of Statistics 24: 407–419.
31. Duret L, Mouchiroud D (1999) Expression pattern and, surprisingly, gene length shape codon usage in Caenorhabditis, Drosophila, and Arabidopsis. Proc Natl Acad Sci U S A 96: 4482–4487.
32. Vinogradov AE (2005) Noncoding DNA, isochores and gene expression: nucleosome formation potential. Nucleic Acids Res 33: 559–563.
33. Carmel L, Koonin EV (2009) A universal nonmonotonic relationship between gene compactness and expression levels in multicellular eukaryotes. Genome Biol Evol 1: 382–390.
34. Rao YS, Chai XW, Wang ZF, Nie QH, Zhang XQ (2013) Impact of GC content on gene expression pattern in chicken. Genet Sel Evol 45: 9. 35. Vinogradov AE (2001) Bendable genes of warm-blooded vertebrates. Mol Biol
Evol 18: 2195–2200.
36. Ortiz V, de Pablo JJ (2011) Molecular origins of DNA flexibility: sequence effects on conformational and mechanical properties. Phys Rev Lett 106: 238107. 37. Federico C, Scavo C, Cantarella CD, Motta S, Saccone S, et al. (2006)
Gene-rich and gene-poor chromosomal regions have different locations in the interphase nuclei of cold-blooded vertebrates. Chromosoma 115: 123–128. 38. Saccone S, Bernardi G (2001) Human chromosomal banding by in situ
hybridization of isochores. Methods Cell Sci 23: 7-15.
39. Howe K, Clark MD, Torroja CF, Torrance J, Berthelot C, et al. (2013) The zebrafish reference genome sequence and its relationship to the human genome. Nature 496: 498–503.
40. Carrillo Oesterreich F, Bieberstein N, Neugebauer KM (2011) Pause locally, splice globally. Trends Cell Biol 21: 328–335.
41. Kandul NP, Noor MA (2009) Large introns in relation to alternative splicing and gene evolution: a case study of Drosophila bruno-3. BMC Genet 10: 67. 42. Bernardi G (2004) Sructural and Evolutionary Genomics. Natural Selection in
Genome Evolution. Amsterdam: Elsevier. 434 p.
43. Jabbari K, Bernardi G (2004) Body temperature and evolutionary genomics of vertebrates: a lesson from the genomes of Takifugu rubripes and Tetraodon nigroviridis. Gene 333: 179–181.
44. Costantini M, Auletta F, Bernardi G (2007) Isochore patterns and gene distributions in fish genomes. Genomics 90: 364–371.
45. Meunier J, Duret L (2004) Recombination drives the evolution of GC-content in the human genome. Mol Biol Evol 21: 984–990.
46. Duret L, Arndt PF (2008) The impact of recombination on nucleotide substitutions in the human genome. PLoS Genet 4: e1000071.
47. Duret L, Galtier N (2009) Biased gene conversion and the evolution of mammalian genomic landscapes. Annu Rev Genomics Hum Genet 10: 285– 311.
48. Kai W, Kikuchi K, Tohari S, Chew AK, Tay A, et al. (2011) Integration of the genetic map and genome assembly of fugu facilitates insights into distinct features of genome evolution in teleosts and mammals. Genome Biol Evol 3: 424–442.
49. Hildebrand F, Meyer A, Eyre-Walker A (2010) Evidence of selection upon genomic GC-content in bacteria. PLoS Genet 6.