The Evolution of Web Content and Search Engines
Ricardo Baeza-Yates
Yahoo! Research Barcelona, Spain &Santiago, Chile
[email protected]
´
Alvaro Pereira Jr
Dept. of Computer Science Federal Univ. of Minas GeraisBelo Horizonte, Brazil
[email protected]
Nivio Ziviani
Dept. of Computer Science Federal Univ. of Minas GeraisBelo Horizonte, Brazil
[email protected]
ABSTRACT
The Web grows at a fast pace and little is known about how new content is generated. The objective of this paper is to study the dynamics of content evolution in the Web, giv-ing answers to questions like: How much new content has evolved from the Web old content? How much of the Web content is biased by ranking algorithms of search engines? We used four snapshots of the Chilean Web containing doc-uments of all the Chilean primary domains, crawled in four distinct periods of time. If a page in a newer snapshot has content of a page in an older snapshot, we say that the source is a parent of the new page. Our hypothesis is that when pages have parents, in a portion of pages there was a query that related the parents and made possible the creation of the new page. Thus, part of the Web content is biased by the ranking function of search engines. We also define a ge-nealogical tree for the Web, where many pages are new and do not have parents and others have one or more parents. We present the Chilean Web genealogical tree and study its components. To the best of our knowledge this is the first paper that studies how old content is used to create new content, relating a search engine ranking algorithm with the creation of new pages.
1.
INTRODUCTION
The Web grows at a fast pace and little is known about how new content is generated. At the same time, a large part of the Web is duplicated (according to different sources [4, 15, 8, 11] the percentage is between 22% and 30%). Other pages are created by using older pages, for example by query-ing a search engine, selectquery-ing a few highly ranked pages and copying selected paragraphs from them.
Our work is a first step to try to understand how old content is used to create new content. That is, we want to find the original sources, if any, of the content of a new page. We can say that each source is aparentof a new page and hence we can define a genealogical tree for the Web, where many pages are really new and do not have parents
Permission to make digital or hard copies of all or part of this work for personal or classroom use is granted without fee provided that copies are not made or distributed for profit or commercial advantage and that copies bear this notice and the full citation on the first page. To copy otherwise, or republish, to post on servers or to redistribute to lists, requires prior specific permission and/or a fee.
WEBKDD’06, August 20, 2006, Philadelphia, Pennsylvania, USA.
Copyright 2006 ACM 1-59593-444-8...$5.00.
and others have one or more parents. So the first question is: what is the percentage of new pages that come from old pages?
In this work we state the hypothesis that when pages have parents, most of the times there was a query that related the parents and made possible for a person to create the new page. If this is the case, some Web content is biased by the ranking function of some search engine. So the second question is: how big is this bias? We give a partial answer to this question, showing that it happens in practice for our data set.
In this work we mine the Web text content and discover important data that allow us to contribute to the Web search and Web usage mining areas in the following aspects, consid-ering our data set: i) we present strong evidences that search engine ranking algorithms bias the content of the Web; ii) we present a study about the influence of old content in new pages; and iii) we show that the number of copies from pre-viously copied Web pages is indeed greater than the number of copies from other pages.
This paper is organized as follows. Section 2 presents important definitions and information about the Web col-lections used in the experiments. Section 3 presents the algorithm to detect duplicates, important to study the dy-namics of the Web. Section 4 presents the algorithm and the results related to the log based Web evolution study. Section 5 presents the Web genealogical tree components and a study of the Chilean Web genealogical tree. Section 6 presents related work. Finally, Section 7 presents the con-clusion of our work.
2.
DEFINITIONS AND WEB COLLECTIONS
In this section we present some definitions and the Web collections used in the experiments.
The definitions are the following:
Definition 1 (Minimal Number of Identical Para-graphs): It is a minimal threshold of the number of identi-cal paragraphs to consider a new document as a partial copy of an old document.
Definition 2 (New Similar Document): It is a new document composed by at least one paragraph from an old document.
Definition 3 (Answer Set): It is the document set re-turned by the query processor of a search engine for a given query.
Definition 5 (Shingle Paragraph): It is a way for mea-suring the content similarity among documents, using the concept of shingles [3]. A shingle paragraph is a sequence of three sentences of the document, where a sentence is a sequence of words ended by a period. In this work we used two types of shingle paragraphs: with overlapof sentences andwithout overlapof sentences. As an example, suppose we have a document containing six sentencess1. s2. s3. s4. s5. s6, wheresi, 1≤i≤6, is a sentence of the text. The
shingle paragraphs with overlap of sentences are: “s1. s2. s3.”, “s2. s3. s4.”, “s3. s4. s5.”, “s4. s5. s6.”. The shingle paragraphs without overlap of sentences are: “s1. s2. s3.”, “s4. s5. s6.”.
Definition 6 (Cluster): It is a set of documents with ex-actly the same shingle paragraphs, without overlap of sen-tences. Each document in a collection is either (i) dupli-cate, if it belongs to a cluster, or (ii)unique, otherwise.
Definition 7 (Equivalent Documents): Two documents in two distinct Web collections are equivalent if their URLs are identical. Equivalent documents may beidentical, if they have exactly the same shingle paragraphs, ordifferent, otherwise.
Definition 8 (Document Relationship): A new docu-ment has aparentif it shares a minimal number of identical shingle paragraphs with the parent document and they are not equivalent. An old document has achildif it shares a minimal number of identical paragraphs with the child doc-ument and they are not equivalent. These definitions are recursive if more than two collections are considered. Thus, for three collections it is possible to identify grandparents and grandchildren, considering the newest and the oldest collections, respectively. Parent–child document pairs are
identicalif the documents have exactly the same shingle paragraphs, ordifferent, otherwise.
Definition 9 (Orphan and Sterile Documents): A new document isorphanif it does not have an equivalent doc-ument or a parent docdoc-ument in the old collection. An old document issterileif it does not have an equivalent docu-ment or a child docudocu-ment in the new collection.
For the experiments we used four collections of pages of the Chilean Web that were crawled in four distinct periods of time. Table 1 presents the main characteristics of the four collections. Each collection was crawled by the Web search engine TodoCL1
. In each crawl, the complete list of the Chilean Web primary domains were used to start the crawl-ing, guaranteeing that a set of pages under every Chilean domain (.cl) was crawled, once the crawls were pruned by depth. Once we used accurate and representative subsets of the Web, we also had accurate and representative samples of the Web for experimentation.
Table 1: Characteristics of the collections.
Col. Crawling date # of docs Size (Gbytes) 2002 Jul 2002 891,707 2.3 2003 Aug 2003 2,862,126 9.4 2004 Feb 2004 2,796,749 11.8 2005 Jan 2005 2,883,455 11.3
1
www.todocl.cl
3.
DUPLICATE DETECTION
Once we are comparing the content of distinct web collec-tions we need to detect duplicate documents to avoid false matches in the experiments. In this section we present the algorithm to find duplicate documents in our Web collec-tions. The algorithm works by clustering duplicate docu-ments [8]. Once our collections are not large, the algorithm uses the whole text of the documents for comparison and does not associate a fingerprint to the documents, improv-ing the precision of the results.
The comparison step of the algorithm uses shingle para-graphs without overlap of sentences (see Definition 5). Col-lection C (with n documents) is divided intom subcollec-tions Si, 0 ≤i < m. The algorithm runs inm steps. For
each subcollection Si, 0≤i < m, the shingles of the
docu-ments inSi are first inserted into a hash table.
Next, the shingles ofC are searched in the hash table. A duplicate is detected if all shingles of a document inChave a match in a document ofSi and both documents have the
same number of shingles. At the end of each iterationi, the subcollectionSi is excluded fromC (C=C−Si).
For each new duplicate pair found, a new cluster (see De-finition 6) is created and the duplicate pair is inserted into the new cluster. For that, a cluster identifier is associated to each document. If one of the documents of the pair was previously inserted into a given cluster, then the other docu-ment of the pair is inserted into this cluster. At the end, the algorithm returns a set of clusters, each cluster containing a list of duplicated documents.
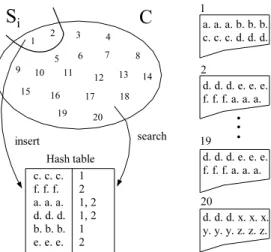
Figure 1 illustrates the main steps of the algorithm using a sample test collectionCcontainingn= 20 documents. In the example, collectionCis divided intom= 10 subcollec-tions, each one containing 2 documents. Sentences in each document are represented by letters, as shown in documents 1, 2, 19 and 20. Every document contains four shingle sen-tences (for instance, document 1 has the shingles “a. a. a.”, “b. b. b.”, “c. c. c.”, “d. d. d.”).
Following Figure 1, in the first iteration the documents 1 and 2 (from subcollectionS0) are inserted into the hash ta-ble. Next, the shingles of the documents ofC(documents 1 to 20) are searched in the hash table. Therefore, it is possi-ble to see that document 19 is a duplicate of document 2. In the second iteration, documents 3 and 4 (from subcollection S1) are inserted into the hash table and the shingles of the documents of collectionC(documents 3 to 20) are searched in the hash table. Next iterations occur similarly.
Using this algorithm, false matches occur when two docu-ments have the same number of identical shingle paragraphs, but with some repeated shingle. For example, suppose that the document 3 in Figure 1 has the following sentences: e. e. e. d. d. d. e. e. e. d. d. d(the shingles are “e. e. e.”, “d. d. d.”, “e. e. e.” and “d. d. d.”). Since every shingle of the document 3 is found in the hash table for the document 2, they are considered duplicates. As this situation seems to occur with a very small probability, the percentage results are not biased by false matches.
4.
LOG BASED CONTENT EVOLUTION
Figure 1: Process for duplication analysis.
new document. Section 4.1 presents a description of the algorithm used. Section 4.2 presents the setup procedure to perform the experiments. Section 4.3 presents the ex-periments and results on the log based content evolution, providing many evidences toward the consistency of the hy-pothesis.
4.1
Algorithm Description
In this section we describe the algorithm to study the evo-lution of the Web content, based on logs. The algorithm is composed by two stages. The objective of the first stage is to find new similar documents (see Definition 2). The ob-jective of the second stage is to filter the new similar docu-ments found in the first stage to find, with a high probability, new documents with content of old documents returned by queries. The two stages are described in the next sections.
4.1.1
Finding New Similar Documents
We use Figure 2 as an example to explain the method to find new similar documents, with the purpose of finding can-didates to be filtered in the second stage of the algorithm. For this, we consider pairs of old–new Web collections, re-ferring to the older collection asold(O) and the more recent collection asnew (N). We explain the method dividing it into three main steps.
Firstly, a setQof queries (a query log) is used to simulate a user performing a query on the search engine. The query processor of the search engine TodoCL is used as the ranking function and applied to each query and to the old collection. An answer set Ai (see Definition 3) is returned for each
query performed. In the example of Figure 2 the ranking function returns the documents 3 and 7 for the query 1 and the documents 13 and 17 for the query 2. The content of these documents are shown in the figure.
Secondly, every document from the total answer set T (see Definition 4) has its shingle paragraphs extracted and inserted into the hash table. We use shingle paragraphs with overlap of sentences (see Definition 5). With the purpose of comparison, shingles are normally used in samples, as a ran-domized technique, what allows false positives. In this work we consider all the shingle paragraphs of the documents, with the advantage of improving the precision.
Thirdly, every document from the new collectionNhas its
Figure 2: Method to find new similar documents.
shingle paragraphs searched in the hash table. A new similar document is detected when at least one shingle of the new document is found in the hash table. While new documents are compared a table is constructed containing important data for the next stage: the new similar document identifier, the old document identifier, and the query identifier.
In the example of Figure 2 the new collection has 20 doc-uments (docdoc-uments 1, 2 and 20 are shown). Document 1 is a new similar document, since one or more shingles of this document is found in the hash table. Document 1 has shin-gle paragraphs from documents 3, 7, 13 and 17. Document 2 also is a new similar document.
An important goal of this algorithm stage is the possibility of repeating the search engine operation in a given period of time. We are able to repeat what had been done in the past by users of the search engine TodoCL, recovering the same Web documents which they recovered on that period of time. It is possible because:
• We know (with a good approximation) the periods of time that every collection was indexed and used in the search engine (see Table 1). No other collection was used in the TodoCL search engine between July, 2002 and January, 2005.
• We used the same query processor used by the search engine in each period of time between every collection pair.
• We used the most frequent performed queries, aiming to increase the probability of finding a query used for copying by at least one of the users that performed that query in the past.
4.1.2
Filtering New Similar Documents
At this stage the new similar documents found in the first stage are filtered. Besides the data returned from the pre-vious stage, the conditions to filter also use data about du-plicates returned by the duplicate detection algorithm (see Section 3), and data with the URLs of the documents for every collection. The conditions are the following:
30 identical shingle paragraphs. This condition is im-portant to eliminate false matches that has only few identical shingle paragraphs, that occurs because some documents have, for example, an identical prefix or suffix automatically generated by a html editor.
2. The new document must be composed by pieces of two old documents returned by the same query. It is intuitive that, in many cases, if the new document has some content of documents returned by the same query, a user might be performed that query before composing the new document. We think that in many cases a user performed a query and used only one query result to compose a new page. This situation cannot be captured by our algorithm. If we considered this situation, we could not infer that the user reached that page because she previously performed the query in the search engine.
3. The new document must contain at least twodistinct
shingle paragraphs from each old document, guaran-teeing that the old content used in the new document is not the same among each of the two old documents.
4. The new document URL cannot exist in the old collec-tion. This condition represents a strong evidence that the new document content was not published in the old collection, improving the precision of the results.
5. Once a new document match all conditions, any dupli-cate of this document cannot be considered as a new match. With this condition we eliminate duplicates on the new documents.
6. Once two old documents match all conditions, any du-plicate of one of these old documents cannot be consid-ered as a new match. For example, consider that two old documents A and B are used to compose a new document. If latter B and C are candidates to com-pose another new document and, ifCis a duplicate of A, the new match is not considered. With this condi-tion we eliminate duplicates on the old documents.
Notice that with all these conditions we may filter many false negatives. For example, maybe a document with an old URL has a new content copied from old documents (see condition 4 above). Maybe a user really used queries to find documents to copy but the user copied only few shingle paragraphs (see condition 1). Maybe a user used only one document returned from a query to compose the new docu-ment (see conditions 2 and 3). We do not regard with these situations. We are concerned in reducing as many as possi-ble the false matches, i. e., to avoid finding a new document that was not composed because a user performed a query.
4.2
Experimental Setup
In the experiments we used sets of the most frequent queries performed in a given period. We selected the most frequent queries because once more users performed that query, it is more probable that one of the users has done it to compose a new document. We sorted the queries by their frequencies, eliminated the top 1,000 queries (they are many times navigational or related to sex) and considered 15,000 top queries. For every query log these 15,000 queries
Table 2: Characteristics of the logs.
Col. Log Period Most freq. Least freq. 2002 Aug/02 – Jun/03 640 71 2003 Sep/03 – Dec/03 168 23 2004 Feb/04 – Jan/05 449 51
represent approximately 14% of the user requisitions in the search engine.
Table 2 presents the meta data related to the three query logs used. In some experiments we manipulated this log, as we present in Section 4.3.
The considered log periods are related to the period that the collections presented in Table 1 had been used as data in the search engine. We did not consider one month of log before and after each crawl, since we are not sure when the new database was indexed and refreshed in the oper-ating search engine. For example, the collection 2002 was crawled in July, 2002 and the collection 2003 was crawled in August, 2003. The query log 2002 considers the period between August, 2002 and June, 2003.
4.3
Experimental Results
This section presents the experimental results related to the log based content evolution study. The experiments are in general based on the following criteria: compare the num-ber of documents returned by the algorithm of Figure 2 that obey all the six conditions shown in Section 4.2, using: (i) the real log for a given period, and (ii) a log of another pe-riod. For example, if we use the collection pair 2003–2004 as data set, in the situation(i)above we would use the query log 2003 shown in Table 2. One of the query logs 2002 and 2004 could be used for the situation (ii). To support our hypothesis, more documents might be returned for the sit-uation (i), that simulates real query requisitions between 2003 and 2004.
In general our collections have been crawled in a very distant period one from another. Table 1 in Section 2 pre-sented the period of each crawl. From collection 2002 to 2003, there is an interval of 13 months, equivalently from collection 2004 to 2005. The period from collection 2003 to 2004 is the shortest: six months.
In order to choose the collection pair to be used in the experiments we observed the average lifespan of Web docu-ments. The lifespan of a document is the difference between the date that it was deleted and the date that it was created [5]. Junghoo Cho [9] found that the average lifespan of Web documents is between 60 and 240 days, considering a sample of 720,000 documents from popular sites. Brewington et al. [2] found that the average lifespan is approximately 140 days for a data set of 800 million documents. Other works [14, 10, 6] present similar values, also considering other measures further average lifespan.
If we choose an old–new collection pair crawled 390 days longer one apart from another, it is probable that many new documents composed using old documents are no more detected in the new collection, due to the lifespan of the new document. For this reason we choose the collection pair 2003–2004 as old and new collections for the first experiment set.
logs and algorithm refereed to in Sections 4.1 and 4.2. Our first experiment set consists of using the three fre-quent query logs presented in Table 2 for the collection pair 2003–2004, using the algorithm of Figure 2. For instance, our hypothesis is that some users performed queries in lection 2003 for composing new documents, published in col-lection 2004.
Figure 3 presents three curves for the query logs 2002, 2003 and 2004, from 5 to 30 minimal number of identical paragraphs. For the query log 2003 the algorithm returned much more documents than for the other logs for any min-imal number of identical paragraphs considered. It is an evidence toward the consistency of our hypothesis.
0 50 100 150 200 250 300
5 10 15 20 25 30
New documents found
Minimal number of identical paragraphs log 2003 on col. 2003 log 2004 on col. 2003 log 2002 on col. 2003
Figure 3: Query logs 2002, 2003 and 2004 used for the collection pair 2003–2004 for different minimal number of identical paragraphs.
According to Figure 3, the use of the query logs 2002 and 2004 also returned some new documents. More documents are returned using the query log 2004 than the query log 2002. We highlight some possible reasons for this figure:
• It is possible that the query log 2004 has more similar queries to the query log 2003 than to the query log 2002.
• It is possible that queries which returned new doc-uments with the query log 2004 were not in the set of the 15,000 frequent queries considered in the query log 2003, but occurred in another part of the query log 2003.
• It is possible that some documents returned with the query log 2004 (or also with the query log 2002) was composed by old documents returned in two or more different queries performed by the user in a session.
• It is possible that the old documents were returned together by other queries in another search engine.
Figure 4 shows the gain for using the query log 2003 in relation to the other query logs. The gain consists in the percentage of how much better the query log 2003 was in relation to the query logs 2002 and 2004 for different minimal number of identical paragraphs. For the query log 2004 the gain is most of the times higher than 50%, reaching 75% when the minimal number of identical paragraphs is 10. For
the query log 2002 the gain is very high, reaching 253% when the minimal number of identical paragraphs is 30.
0 50 100 150 200 250 300
5 10 15 20 25 30
Gain of log 2003 related to other logs (%)
Minimal number of identical paragraphs gain log 2003 to log 2002 gain log 2003 to log 2004
Figure 4: Percentage gain from the query log set 2003 in relation to logs 2002 and 2004.
In the second experiment set we used parts of the logs shown in Table 2. We divided the query logs 2002 and 2004 into five bimonthly logs. For example, in log 2004 we considered the months February and March as being the bimonthly log 1, the months April and May as being the bimonthly log 2, and so on, until the months October and November as being the bimonthly log 5. We preferred not to use the remaining month in the log, December, since this log would have queries with about half of the frequency of the bimonthly logs, what probably would bias the results.
For each bimonthly log we sorted the queries by their fre-quencies, eliminated the top 1,000 queries and considered the 5,000 top queries. We used less queries than the previ-ous logs (in which we used 15,000 queries) because now the period is shorter (two months) and we are not interested in less frequent queries. Table 3 presents information about the bimonthly logs. The average values considered in the table are related to the five bimonthly logs used for each year.
Table 3: Characteristics of the bimonthly logs.
Col. Log Period Average Average most freq. least freq. 2002 Aug/02 – May/03 98 27 2004 Feb/04 – Nov/04 149 27
Figure 5 presents the number of documents returned when the five 2002 bimonthly logs are used for the collection pair 2002–2003. Bimonthly log 5 is the most recent bimonthly log and bimonthly log 1 is the oldest bimonthly log.
According to Figure 5, the most recent bimonthly logs returned more documents than older bimonthly logs. This would be expected, considering that many documents com-posed by documents returned by queries in the oldest bi-monthly logs do not exist any more in collection 2003, due to the lifespan of the documents.
20 30 40 50 60 70 80 90
5 10 15 20 25 30
New documents found
Minimal number of identical paragraphs bimonthly log 5 bimonthly log 4 bimonthly log 3 bimonthly log 2 bimonthly log 1
Figure 5: Bimonthly logs from query log 2002, used for the collection pair 2002–2003.
of identical paragraphs. The gain is greater than or equal to 100% for the minimal number of identical paragraphs greater than five.
0 20 40 60 80 100 120 140
5 10 15 20 25 30
Gain of log bimonthly 5 related to 1 (%)
Minimal number of identical paragraphs gain
Figure 6: Percentage gain from bimonthly log 5 to bimonthly log 1 (query log 2002) for the collection pair 2002–2003.
Figure 7 presents the number of documents returned when the five 2004 bimonthly logs are used, considering the col-lection pair 2004–2005. We observed the same behavior for the logs 2004 and 2002.
As a conclusion, considering that the average lifespan of a Web document is of 140 days [2], equivalently 4.5 months, the fact of finding a great number of documents for the two most recent bimonthly logs from both query logs 2002 and 2004 is another evidence that users performed queries in the search engine before composing their new pages with old content.
The third experiment set uses the bimonthly logs 4 and 5 from both query logs 2002 and 2004 for both collection pairs 2002–2003 and 2004–2005. We expect better results running the bimonthly logs from 2002 for the collection pair 2002– 2003 and the bimonthly logs from 2004 for the collection pair 2004–2005, since they are the real simulation of users performing queries in the past.
20 30 40 50 60 70 80 90
5 10 15 20 25 30
New documents found
Minimal number of identical paragraphs bimonthly log 5 bimonthly log 4 bimonthly log 3 bimonthly log 2 bimonthly log 1
Figure 7: Bimonthly logs from query log 2004, used for the collection pair 2004–2005.
Figure 8 presents the number of documents returned when the bimonthly logs 4 and 5 from 2002 and 2004 are used, considering the collection pair 2002–2003. When the real data is used (logs 2002) the result is substantially better.
40 60 80 100 120 140 160
5 10 15 20 25 30
New documents found
Minimal number of identical paragraphs log 2002 on col. 2002 log 2004 on col. 2002
Figure 8: Bimonthly logs 4 and 5 from query logs 2002 and 2004 used for the collection pair 2002– 2003.
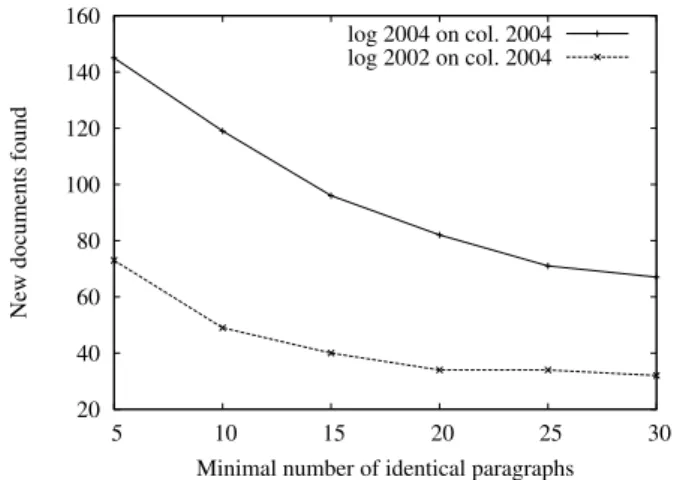
Figure 9 presents the number of documents returned when bimonthly logs 4 and 5 from query logs 2002 and 2004 are used, considering the collection pair 2004–2005. The com-parison of the two curves provides another evidence toward the consistency of our hypothesis.
As a conclusion, we have presented strong evidences that the stated hypothesis is true, in distinct ways, for our data set. We discard the possibility that all the results found and shown in this section are coincidences.
5.
GENEALOGICAL TREES
20 40 60 80 100 120 140 160
5 10 15 20 25 30
New documents found
Minimal number of identical paragraphs log 2004 on col. 2004 log 2002 on col. 2004
Figure 9: Bimonthly logs 4 and 5 from query logs 2002 and 2004 used for the collection pair 2004– 2005.
the genealogical tree for the Chilean Web, using distinct old–new collection pairs.
5.1
Genealogical Tree Components
In this section we define the components of genealogical trees for the Web. These components represent data that can be discovered and used to reflect how content copies are made over a set of Web collections crawled in distinct periods. The components are the following:
1. An old and a new collection.
2. The set of equivalent documents in an old–new collec-tion pair (see Definicollec-tion 7). It is possible to identify the following subsets:
(a) Duplicate or unique equivalent documents in both old and new collections.
(b) Identical or different equivalent documents.
3. The set of parents in a collection (see Definition 8). If three or four collections are considered, it is possible to find the grandparents and great-grandparents. It is possible to identify the following subset: duplicate or unique parents documents.
4. The set of children in a collection (see Definition 8). If three or four collections are considered, it is possible to find the grandchildren and great-grandchildren. It is possible to identify the following subsets:
(a) Duplicate or unique children documents. (b) Identical or different children documents, in
rela-tion to the parent of each document.
5. The set of orphan new documents (see Definition 9). It is possible to identify the following subset: duplicate or unique orphan documents.
6. The set of sterile old documents (see Definition 9). It is possible to identify the following subset: duplicate or unique sterile documents.
Figure 10 presents an example of these components for an old–new collection pair. The old collection is represented on the left side of the figure (documents one to five) and the new collection on the right side (documents six to ten). Each document has an identifier, an URL and a textual content. Sentences in the content are represented by letters, sepa-rated by periods. The example does not consider duplicate or unique documents.
Figure 10: Example of genealogical tree compo-nents.
According to Figure 10, document six is equivalent and identical (component 2.b above) to document one. Doc-ument seven is equivalent and different (component 2.a) to document two. Documents three and four are parents (com-ponent 3) of documents in the new collection. Document five is sterile (component 6). Document eight is an identical child from document three (component 4.b). Document nine is a different child from document four (component 4.b) and finally, document ten is an orphan document (component 5).
5.2
Algorithm Description
In this section we describe our algorithm to study the genealogical tree for the Web. Similarly to the algorithm presented in Section 4.1, this algorithm is composed by two stages. The objective of the first stage is to find new similar documents (see Definition 2). The objective of the second stage is to select and classify the old and new documents according to the components presented in the previous sec-tion.
The first stage of the algorithm consists of randomly se-lecting a sample of old documents (from an old collection O), inserting their shingles into a hash table, and searching for the shingles of each new document (from a new collection N) in the hash table.
Figure 11 presents the second stage of the algorithm. Ni
is the new similar document and Oj is the correspondent
old document with some similarity with Ni. minN um is
the minimal number of identical paragraphs.
1 For each document pair (Ni,Oj)
2 IfminN um >10
3 If it is the first time thatOj is a parent
andOj URL is found in the new collection
4 Increment the number of equivalents; 5 Else
6 If it is the first time thatNior a
duplicate ofNiis a child
7 Increment the number of children; 8 Classify the child as identical or
different, and duplicate or unique; 9 If it is the first time thatOj is a parent
10 Increment the number of parents;
Figure 11: The second stage of the algorithm to study genealogical trees for the Web.
common, that was not cleaned by the crawler system. The algorithm continues by verifying if Oj is found in
the new collection, in step 3. If it is found, the number of equivalent documents is incremented. If it is not the first occurrence ofOj, it is not searched again.
After verifying if the documents are equivalent, the al-gorithm verifies if Ni is a child of Oj. The condition
rep-resented in step 6 of the algorithm is a way of eliminating duplicates of the new collection. Consider that a document A has thousands of duplicates in both collections old and new. It is probable that if we randomly choose about 5% of the old collection, one of the duplicates ofAwill be chosen. If we allow duplicates in the new collection, every dupli-cate ofAin the new collection will be considered as a child, introducing noises in the results.
Finally, if condition 6 is true, Ni is a child ofOj. The
child is classified and the number of parents is incremented, what happen only ifNiis the first child ofOj.
5.3
Chilean Web Genealogical Tree
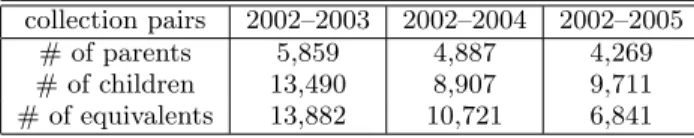
We study the genealogical tree for the Chilean Web by randomly choosing documents from collections 2002, 2003 and 2004 and observing the occurrence of parts of these doc-uments in the most recent collections. Table 4 presents the number of parents in collection 2002 that generate children, grandchildren and great-grandchildren, respectively in col-lections 2003, 2004 and 2005. The random sample contains 120,000 documents from collections 2002 and 2003.
Table 4: Number of equivalent documents and par-ents in collection 2002 that generated descendants.
collection pairs 2002–2003 2002–2004 2002–2005 # of parents 5,859 4,887 4,269 # of children 13,490 8,907 9,711 # of equivalents 13,882 10,721 6,841
According to Table 4, 5,859 documents of the collection 2002 are parents of 13,490 documents in the collection 2003 for the sample considered. We see that 8,907 documents in the collection 2004 are grandchildren of documents in the collection 2002, and that 9,711 documents in the collection 2005 are great-grandchildren of documents in the collection 2002.
Table 5, by its turn, presents the number of parents in
collection 2003 that generate children and grandchildren, respectively in collections 2004 and 2005. In relation to the collection 2003, 5,328 documents are parents of documents in the collection 2004 and 5,038 are grandparents of doc-uments in the collection 2005. The sample considered in collection 2003 generated content in 33,234 documents of the collection 2004 and 29,070 documents of the collection 2005.
Table 5: Number of equivalent documents and par-ents in collection 2003 that generated descendants.
collection pairs 2003–2004 2003–2005 # of parents 5,328 5,038 # of children 33,234 29,070 # of equivalents 19,268 10,495
The collection 2003 generated much more children than collection 2002. We suppose that it occurs because the Chilean Web of 2002 was not crawled in a great portion. Thus, many documents in the most recent collections were composed by documents existent in the Web in 2002 but not existent in the collection 2002.
Observing Tables 4 and 5 we see that the number of chil-dren is always considerably greater than the number of par-ents. For the collection pair 2003–2004 there are, on average, more than six children for each parent. Thus, few documents are copied many times, so the number of sterile documents is indeed smaller than the number of orphan documents.
Now we observe the evolution of the number of children and the number of equivalent documents in these years. From collection pair 2003–2004 to collection pair 2003–2005 the number of children reduced only 12.5%, while the num-ber of equivalent documents reduced 45.5%. From collection pair 2002–2004 to collection pair 2002–2005 the number of children increased.
We conclude that the number of copies from previously copied documents is indeed greater than the number of doc-uments copied from random old docdoc-uments. An open ques-tion is: do the search engines contribute to this situaques-tion, since they privilege popular documents [7, 1] and people use search engine to compose new documents (according to the evidences previously presented in this paper)?
Now we study the characteristics of parent and child doc-uments. According to Definition 8, each parent–child docu-ment pair is either identical or different. According to De-finition 6, each document in a collection is either duplicate or unique. Thus, we are able to classify parent and child documents according to the following four characteristics: different and duplicate; different and unique; identical and duplicate; and identical and unique.
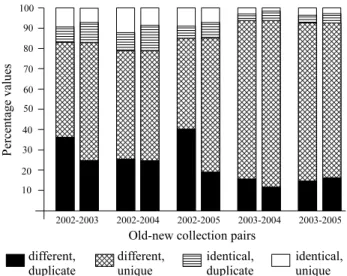
Figure 12 presents the classifications for each collection pair considered in Tables 4 and 5. The figure is divided into sets of double bars. Each double bar represents information of parent–child pairs of an old–new collection pair. The first bar of each double bar represents the parents characteristics, in relation to the old collection. The second bar of each double bar represents the children characteristics, in relation to the old collection.
Figure 12: Different types of parent and child doc-uments for different collection pairs.
parents in collection 2002, existent in the parent–child docu-ment pairs, are different and duplicate. About 47% (that is, about 83% less 36%) are different and unique. Thus, about 83% are different and about 17% are identical. Observing the second bar, we see that about 7% of the children are identical and unique.
Notice that as the number of children is greater than the number of parents (see Tables 4 and 5), the percentage of parents in the old collection (the first bars of the double bars in Figure 12) considers repeated parent documents.
According to Figure 12, much more different parents (or children) are found in relation to identical parents (or chil-dren). It means that most of the copies are partial, and copies of the entire document are not very common.
Comparing the unique and duplicate parents in Figure 12, we see that most parents are unique. It means that unique documents are more often copied than duplicate documents. Considering that we eliminated duplicates (see Section 5.2), the duplicate documents are only the original dupli-cated documents. On average for the four collections, there are about 4.3 unique documents for each original duplicated document. Thus, in proportion, the number of duplicate parents (and children) is greater than the number of unique parents (and children). It means that, in proportion, dupli-cate documents are more copied than unique documents.
Analyzing only the identical pairs, in every collection pair the number of duplicate parents (in the first bar) is shorter than the number of duplicate children (in the second bar). More than this, most of the identical parents are unique, but most of the identical children are duplicate. We believe that it occurs because a portion of the parents is already existent in the new collection. If a child has an identical document in the collection (its parent), it is classified as duplicate.
Analyzing only the different pairs in Figure 12, for every collection pair, most parents are unique. With exception of the collection pair 2003–2005, the number of unique children is greater than the number of unique parents.
Now we study the characteristics of the equivalent docu-ments. Equivalent documents are also classified according to the following characteristics (see Definitions 6 and 10): different and duplicate; different and unique; identical and
duplicate; and identical and unique. Figure 13 presents the classifications for the collection pair studied so far. The fig-ure is divided into sets of double bars. Each double bar represents information of a collection pair. The first bar of each double bar represents the characteristics of equiv-alent documents in the old collection. The second bar of each double bar represents the characteristics of equivalent documents in the new collection.
Figure 13: Different types of equivalent documents for different collection pairs.
According to Figure 13, the number of identical lents is much greater than the number of different equiva-lents. Other works also showed that modifications in the Web occur in a minor fraction of the documents [14, 13].
Now we observe the bars of Figure 13 throughout time, i. e., the differences from collection pair 2002–2003 to col-lection pairs 2002–2004 and 2002–2005, and the differences from collection pair 2003–2004 to 2003–2005. We see that the number of duplicate old equivalents (black and lined in-ner bars) increases, but the number of duplicate new equiv-alents remains stable or decreases. The reason is that, as time goes by, the duplicates of the equivalent documents die and the last duplicate document is found as an unique document.
The number of different equivalents also increases, in re-lation to the number of identical equivalents. It occurs be-cause documents that have changes tend to have a longer lifespan.
6.
RELATED WORK
Ntoulas et al. [13] found that after a year, about 60% of the documents and 80% of the links on the Web are replaced.
Cho and Roy [7] studied how much impact search engines have on the popularity evolution of Web documents. Given that search engines currently return popular documents at the top of search results, they showed that newly created documents are penalized because these documents are not very well known yet. Baeza-Yates, Castillo and Saint-Jean [1] also showed that Pagerank is biased against new docu-ments, beside obtaining information on how recency is re-lated with Web structure.
Researches that show that Pagerank is biased against new pages works as a complement for our research, in the sense we show that ranking algorithms bias the content of the Web. From the perspective of a search engine user, the Web does not evolve too much, considering that the new content is, in a great part, composed by the content of old popular documents.
Mitzenmacher [12] introduced a dynamic generative user model to explain the behavior of file size distributions (not only Web text documents). He demonstrated that files that are copied or modified are more likely to be copied or mod-ified subsequently.
Our work differs from the above mentioned papers in three main aspects: i) we aim to associate the search engine rank-ing algorithms with the Web content evolution; ii) we study how old content is used to create new content in new docu-ments; and iii) we study the relation of duplicate and unique documents with the evolution of the Web content through-out the years.
7.
CONCLUSIONS
In this paper we have shown that a significant portion of the Web content has evolved from old content, for our data set. We have also shown that this portion is biased in part by the ranking algorithm of Web search engines, as people use a query to select several sources to apply a cut and paste to create part or all the content of a new page.
Additionally, we have shown that the number of copies from previously copied Web pages is indeed greater than the number of copies from other pages. An open question is: do the search engines contribute to this situation, since they privilege popular documents and people use search engine to compose new documents? If the answer is true, search engines contribute for the Web does not evolve too much.
For future work we will study new heuristics to find other parts of the genealogical tree. For example, it is possible that some pages can be identified by unique shingles that have been copied (something similar to genetic markers for biological mining, as in the Genographic project2
). We also want to study the structure of the genealogical tree to find frequent patterns that can help to understand better the evolution of Web content.
Acknowledgements
We would like to thank Barbara Poblete who organized and supplied us with the Chilean collections and query logs. This work was partially funded by Spanish MEC Grant TIN 2005-09201 (R. Baeza-Yates and A. Pereira Jr) and by Brazilian GERINDO Project–grant MCT/CNPq/CT-INFO
2
http://www5.nationalgeographic.com/genographic/
552.087/02-5 (N. Ziviani and A. Pereira Jr), and CNPq Grants 30.5237/02-0 (N. Ziviani) and 14.1636/2004-1 (A. Pereira Jr).
8.
REFERENCES
[1] Ricardo Baeza-Yates, Carlos Castillo, and Felipe Saint-Jean.Web Dynamics, chapter Web Dynamics, Structure and Page Quality, pages 93–109. 2004. [2] Brian Brewington, George Cybenko, Raymie Stata,
Krishna Bharat, and Farzin Maghoul. How dynamic is the web? InNinth Conference on World Wide Web, pages 257–276, Amsterdam, Netherlands, May 2000. [3] A. Broder. On the resemblance and containment of
documents. InCompression and Complexity of Sequences (SEQUENCES’97), pages 21–29, 1998. [4] A. Broder, S. Glassman, M. Manasse, and G. Zweig.
Syntactic clustering of the Web. InSixth International World Wide Web Conference, pages 391–404, 1997. [5] Carlos Castillo.Effective Web Crawler. PhD thesis,
Chile University, 2004. Chapter 2.
[6] Xiangping Chen and Prasant Mohapatra. Lifetime behaviour and its impact on Web caching. InIEEE Workshop on Internet Applications (WIAPP’99), pages 54–61, San Jose, CA, July 1999.
[7] J. Cho and S. Roy. Impact of search engine on page popularity. InWorld Wide Web Conference
(WWW’04), pages 20–29, New York, USA, May 2004. [8] J. Cho, N. Shivakumar, and H. Garcia-Molina.
Finding replicated Web collections. InACM International Conference on Management of Data (SIGMOD), pages 355–366, May 2000.
[9] Junghoo Cho. The evolution of the web and
implications for an incremental crawler. In 26th Intl. Conference on Very Large Databases (VLDB), pages 527–534, Cairo, Egypt, September 2000.
[10] Fred Douglis, Anja Feldmann, Balachander
Krishnamurthy, and Jeffrey C. Mogul. Rate of change and other metrics: a live study of the world wide Web. InSymposium on Internet Technologies and Systems USENIX, pages 147–158, 1997.
[11] D. Fetterly, M. Manasse, and M. Najork. On the evolution of clusters of near-duplicate Web pages. In
First Latin American Web Congress, pages 37–45, Santiago, Chile, November 2003.
[12] M. Mitzenmacher. Dynamic models for file sizes and double pareto distributions.Internet Mathematics, 1(3):305–333, 2003.
[13] Alexandros Ntoulas, Junghoo Cho, Hyun Kyu Cho, Hyeonsung Cho, and Young-Jo Cho. A study on the evolution of the Web. In US – Korea Conference on Science, Technology, and Entrepreneurship (UKC), pages 1–6, Irvine, USA, 2005.
[14] Alexandros Ntoulas, Junghoo Cho, and Christopher Olston. What’s new on the Web? the evolution of the Web from a search engine perspective. In World Wide Web Conference (WWW’04), pages 1–12, New York, USA, May 2004.
[15] Narayanan Shivakumar and Hector Garcia-Molina. Finding near-replicas of documents on the Web. In