125
INTER-ANNUAL VARIABILITY OF NET ECOSYSTEM PRODUCTIVITY OVER INDIA
R. K. Nayaka* , V.K. Dadhwala, N. R. Patelb and C. B. S. Dutta a
National Remote Sensing Center, Hyderabad b
Indian Institute of Remote Sensing, Dehradun
*E-mail: [email protected]; [email protected]
KEYWORDS:CASA, net primary productivity, inter annual variability, remote sensing, carbon cycle, India
ABSTRACT:
The net ecosystem productivity (NEP) is the estimates of net carbon exchanges between the vegetation-soil system and the atmosphere. Estimates of NEP could play important role in defining a terrestrial ecosystem as a net source and sink of atmospheric CO2. We model monthly NEP over India for past 26 years (1981-2006) by incorporating satellite observations of vegetation index together with other climatic parameters in to efficiency based terrestrial ecosystem model. Results depict large spatial and temporal variability of NEP over India. NEP climatology over India showed that this region sequestered annually 9.4 Tg C (at the rate of 2.54 gC m-2) and hence appeared to be a net sink of atmospheric CO2. Strength of the CO2 sequestration over the country has been increased during the study period with average linear growth rate of 1.8 TgC yr-2.
1. INTRODUCTION
Plant biomass and soil organic matter contain about 2200 Gt C, two times more than that in the atmosphere. The carbon fluxes be-tween the vegetation-soil system and the atmosphere (77 Pg C per Year) are 10 times larger than the CO2 emission from the fossil fuels. The net ecosystem productivity (NEP) is the estimate of net carbon exchanges between the vegetation-soil system and the at-mosphere. The spatial and temporal variability of NEP could play an important role in the global carbon cycle and in variation of atmospheric CO2 concentration (Schimel et al. 2000, 2001). Al-though many of the studies revealed that global terrestrial ecosys-tem was a net carbon sink, but carbon uptakes and releases had large spatial and temporal variability due to the impacts of envi-ronmental and biological factors, such as climatic conditions, vegetation distribution, land use, etc (Fu and Wen, 1999). India is a large country, situated in the tropics between 8 – 380 N latitudes in the northern hemisphere. The country has diverse vegetation cover with climate varying from monsoonal in the south to temperate in the north. The climate over India undergone large changes during past two decades with the clear warming trends under the background of global warming. The variation of temperature and precipitation had distinct regional differences (Dash and Hunt 2007). Therefore, understanding spatial and tem-poral variability of the carbon cycle is of great significance to es-timate the variation of global terrestrial carbon sink. Several stud-ies were carried out on terrestrial carbon cycle in India (Hingane 1991, Hooda et al., 1996; Chhbra and Dadhwal 2003; Nayak et al., 2009 & 2011) and these had mainly focused on estimation of NPP and carbon stock over India. However, a few studies were carried out in the recent past to describe variability of NEP over the monsoon Asia including India (Titan et al. 2003, Potter et al. 2005), we believe that comprehensive analysis on spatial pattern of NEP and its seasonal and inannual variability in Indian ter-restrial ecosystem were not been adequately investigated. There-fore, in this paper, high spatial resolution of satellite observations of Normalized Vegetation Index (NDVI) and other climatic data
sources were used in a terrestrial biosphere model, the Carnegie– Ames–Stanford Approach (CASA; Potter et al. 2003) to estimate the NEP over Indian during 1981-2006. The seasonal and inter-annual variability of NEP over the subcontinent was also ana-lyzed.
2. MATERIAL AND METHODS
2.1 Model description
In this study, a simple terrestrial biosphere model, the CASA was used to estimate the spatial pattern of NEP over India. NEP is computed in the model for each year as the difference between net primary production (NPP) of vegetation and the respiration loss of CO2 by microbes in the soil (Rh) which excludes the effect of small-scale fires and other localized disturbances or vegetation re-growth patterns on carbon fluxes (Schimel et al., 2001). The model calculates NPP by estimating optimal metabolic rates of carbon fixation processes under the limiting effect of temperature and water stress scalars. The model is designed to couple seasonal pattern of NPP to soil heterotrophic respiration (Rh) of CO2 of soils worldwide. First order decay equations simulate exchanges of decomposing plant residue (metabolic and structural fraction) at the soil surface. The model also simulate surface soil organic matter (SOM) fraction that presumably vary in age and chemical composition. Turnover of active (microbial biomass and labile substrates), slow (chemically protected), and passive (physically protected) fraction of the SOM are represented. In the present study, analysis of spatio-temporal variability of simulated NEP during past 26 years (1981-2006) at 2 minute spatial resolution over India was carried out.
2.2 Databases
The time varying input data for the model run includes: Normalized Vegetation Index (NDVI), air-temperature (Tair), surface solar radiation (SOLR), and precipitation (PPT). The monthly NDVI data over India used in the model were based on International Archives of the Photogrammetry, Remote Sensing and Spatial Information Sciences, Volume XXXVIII-8/W20, 2011
ISPRS Archives XXXVIII- 8/W20; Workshop Proceedings: Earth Observation for Terrestrial Ecosystems
126 Global Inventory Modeling and Mapping Studies (GIMMS) NDVI databases at 8-km spatial resolution (Tucker et al., 2005). The data of climatic parameters used in the study were based on Climate Research Unit (CRU) at the University of East Anglia (UEA) (www.cru.uea.ac.uk/cru/data/hrg). The CRU monthly climatic databases of temperature, precipitation and cloudiness were available at 0.5 degree grid and derived by interpolating measurements acquired from weather stations across the globe. The cloud fraction data were used to obtain surface solar radiation over the country at monthly time scale by using the methodology described in Mani (1980). Extra-terrestrial radiation used in the method was obtained from Surface Radiation Budget (SRB) databases (http://gewex-srb.larc.nasa.gov/). Monthly climatic drivers and NDVI so obtained were re-sampled at 2 minute spatial resolution in order to match the model grid.
The stationary land cover map of the country used in the present study was based on the land cover map of Southeast Asia derived at 1 Km spatial resolution by using multi-date SPOT-VEGETATION data for the global land cover-mapping project (Agrawal et al. 2003). In the present study, the land cover attribute data were then resampled at 2 minute resolution using ENVI pixel aggregate function. The soil attribute map of the country used in the present study was based on the Food and Agriculture Organization (FAO) of UNESCO world soil map (Reynolds et al. 1999). The map provides the data of various composition of the soil of upper 30 cm depth: sand, silt, and clay fraction at 5 minute resolution. The data were interpolated at the model resolution and then soil attribute map as per the seven classes defined in the CASA model was prepared.
3. RESULTS
3.1 NEP and its variability
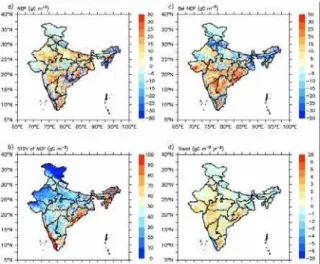
The spatial pattern of annual NEP climatology and associated standard deviation during the 26-year study period over India were presented in Fig. 1. Statistics of estimated NEP over the major land cover types of the country is presented in table 1. The positive values of NEP represent net ecosystem sink fluxes (i.e. net CO2 uptake from the atmosphere) and negative values represent net annual ecosystem source fluxes (i.e. net CO2 loss to the atmosphere), all in units of gC m-2yr-1.
In a climatological year, India is the region of net sink of atmospheric CO2 with total annual uptake of 9.85 (σ = 41.35) Tg C which was estimated at the rate of 2.54 (σ = 29.16) gC m-2yr-1. Out of the total annual NEP, cropland contributed 9.1 Tg C, mixed shrub and grassland contributed 1.32 Tg C and forest land contributed –0.54 Tg C (table 1). Regarding the monthly variability during the climatological year, the terrestrial India behaves as a net sink of atmospheric CO2 during peak periods of both growing seasons: August - December and Feb-March due to large enhancement of NPP (Fig. 2). During April-June, total NEP over the country is negative and the country behaves as a source of atmospheric CO2.
As shown in Fig 1, the estimated NEP exhibits large spatial variation across the country. Positive NEP with small values of standard deviation (σ) were estimated over most parts of the agricultural land (Indo-Gangetic plain; the coastal states in the
eastern and southern peninsular platue) and mixed-shrub and grassland over desertic tracts of northwestern and central peninsular India. While small negative NEP values with large σ were estimated mostly over the forest region on the south-eastern region of north-east states and western ghat of the country.
Figure 5 Mean annual NEP (a) and the standard deviation (b) during 2006, c) decadal change of annual NEP during 1981-1990 and during 1991-2000, d) long-term linear growth rate of NEP over India during 1981-2006.
Land use/land cover (% land coverage of
the country)
Mean NEP and σσσσ
( gC m-2 yr-1)
Total NEP and σσσσ
(Tg C yr-1)
Trend (Tg C yr-2)
Mixed dry land and irrigated crop land(37)
4.5 (17.6) 5.44 (15.4) 0.72
Irrigated cropland and
pasture (16.5) 6.8 (16.5) 3.65 (7.1) 0.13 Broadleaf deciduous
forest (14.5) -0.12 (34.6) -0.41 (8.5) 0.23 Mixed shrub and
grass land (11) 3.77 (18.2) 1.32 (4.9) 0.15 Broadleaf evergreen
tree (5) -1.15 (60.8) -0.13 (2.9) -0.06 Grassland (4) -0.06(9.3) -0.01 (0.6) 0.02 All LU/LC (100) 3.01 (25.2) 9.85 (36.9) 1.79
Table 1: Statistics of annual NEP climatology and long-term linear growth rate of total NEP over major land cover types in India.
4 5 55
ISPRS Archives XXXVIII- 8/W20; Workshop Proceedings: Earth Observation for Terrestrial Ecosystems
127 Figure 6 Monthly variation of total NEP and NPP over the country during a climatological year 1981-2006 (upper panel) and monthly variation of total NEP over different dominant land covers of the country during the climatological year.
As shown in Fig 3, total annual NEP over the country remained negative during 1981-1986 with average value (-20 Tg C yr-1) and then it has been increased continuously up to 60 Tg C yr-1 in 1990. Since then, total NEP over the country was however oscillating between large negative value (-60 Tg C yr-1) in 1992 to large positive value (78 Tg C yr-1) in 1999, the mean value of total NEP estimated during past 15 years (1993-2006) was 20 Tg C yr-1. These NEP estimates could be compared with global total annual NEP during different years. Based on Potter et al. (2003), the global NEP was varied between -900 in 1982 to 2100 Tg C yr -1
in 1998.
Figure 3. a) Inter-annual variation of total annual NEP (continuous) during the study period and linear trend lines (dash line) fitted using the least square procedure; b) the same as above but for the total agricultural lands of the country; c) the same as above but for the forest (continuous lines), and mixed shrub and grassland (dash lines) of the country.
3.2 NEP Trend
The long-term linear growth rate (trend) of annual NEP over the country was estimated at pixel levels using the least square procedure between annual NEP and years. The result was presented in Fig. 1d which suggests that most part of India exhibits positive growth rate. Relatively large positive values of NEP trend (> 2 gC m-2yr-1) were estimated over major parts of Odisa, Chhattisgarh, Gujrat, crop and grasslands of south-central plateau (western part of MP; most part of Maharastra, Karnatak, Tamil Nadu), some parts of the Indo-Gangetic plain and north-eastern states. Negative NEP trend were estimated over southern portion of Western Ghat (Kerala), most of the states belong to the north India (Punjab, Hariyana, Himachal Pradesh, Uttarakhand, Jharkhand) and major parts of northeast states. In national scale, the linear growth rate of NEP over the country is 1.8 TgC yr-2 (see Fig. 3). This growth rate is associated with the contributions of 0.85 TgC yr-2 from the cropland, 0.36 TgC yr-2 from the region dominated by shrub and grassland, and 0.18 TgC yr-2 from the regions dominated by forestland. Analysis also suggests that India as a whole is the source of atmospheric CO2 during 1981-1986 and afterwards it became major sink of atmospheric CO2. The decadal change of annual NEP estimated as the difference between average annual NEP during 1996-2005 and during 1986-1995 as presented in Fig. 1c depicts that increase of NEP occurred over most parts of southern India. Declining of NEP occurred over most past northern high latitude portion of north India; north-east states; and southern portion of Western Ghat hills.
4. CONCLUDING REMARKS
The CASA, a remote sensing driven terrestrial biosphere model was used to simulate spatio-temporal patterns of NEP over India during 1981-2006. The simulated NEP over the country exhibits strong inter-annual variability. Positive NEP with small values of standard deviation was estimated over most part of the agricultural land and mixed-shrub and grassland over desertic tracts of northwestern and central peninsular India. While negative NEP values with large standard deviation were estimated mostly over forest region on the south-eastern region of north-east states and western ghat of the country.
In an average India is the region of net sink of atmospheric CO2 with total annual uptake of 9.5 Tg C yr-1. This annual uptake was associated with large positive contribution (8.5 Tg C yr-1) from the agricultural lands, relatively smaller contribution (1.3 Tg C yr-1) from the mixed shrub and grassland, and small negative contribution (-0.2 Tg C yr-1) from the forest region. The country is mostly sink of atmospheric CO2 during peak periods of both the growing seasons (August-November and February-March) and remaining periods of a year, the country is mostly source of atmospheric CO2.
Total NEP over the country exhibits strong inter-annual variabil-ity. Air-temperature has small but significant control on the inter-annual variability of NEP, whereas precipitation has very small positive and solar radiation has negligible impact on the control of inter-annual variability of NEP. Estimated long term linear growth rate of NEP over the country was 1.8 Tg C Yr-2 (8.5%) which is small but significant. This increase of NEP was primar-International Archives of the Photogrammetry, Remote Sensing and Spatial Information Sciences, Volume XXXVIII-8/W20, 2011
ISPRS Archives XXXVIII- 8/W20; Workshop Proceedings: Earth Observation for Terrestrial Ecosystems
128 ily due to enhancement of productivity over the agricultural lands and mixed shrub and grassland of the country.
REFERENCES
Agrawal, S., Joshi, P. K., Shukla, Y., Roy, P.S. (2003). SPOT VEGETATION multi temporal data for classifying vegetation in south central Asia. Current Science 84 (11), 1440-1448.
Chhabra, A., Dadhwal, V. K. (2004). Estimating terrestrial net primary productivity over India. Current Science 86 (2), 269-271. Dadhwal V.K., and Nayak SR (1993) A preliminary estimate of biogeochemical cycle of carbon for India. Science and Culture 59 (1/2):9-13.
Dash, S. K. and Hunt J. C. R. (2007). Variability of climate change in India, Current science , 93, 6, pp 782-788.
Fu, C., Wen, W.G., 1999. Variation of ecosystems over East Asia in association with seasonal, interannual and decadal monsoon climate variability. Climatic Change 43, 477– 494.
Hingane LS (1991) Some aspect of carbon dioxide exchange between atmosphere and Indian plant biota, Climate Change, 18, 425-435.
Hooda, R. S., Dye, D.G., Shibaski, R. (2003, Evaluating agricultural and non agricultural carbon fixation over India using remote sesning data. Proc. SPIE, 4879, 108
Mani, A. (1980). Handbook of Solar Radiation : Data for India, 498 pp., 1981, Books and Periodicals Agency, BP-10032. Nayak , R. K. , N. R. Patel, and V. K. Dadhwal (2011)nter-annual variability of Net Primary Productivity over India, International Journal of Climatology (in press).
Nayak, R. K., N. R. Patel and V. K. Dadhwal (2009). Estimation and analysis of terrestrial net primary productivity over India by remote-sensing-driven terrestrial biosphere model, Journal of
Environment Monitoring and Assessment- 10.1007/s10661-009-1226-9.
Potter, C., S. Klooster, P. Tan, M. Steinbach, V. Kumar and V. Genovese, 2005, Variability in terrestrial carbon sinks over two decades: Part 2 - Eurasia, Global and Planetary Change, 49, 177-186.
Potter, C.S., Klooster, S.A., Myneni, R.B., Genovese, V., Tan, P. N., Kumar, V. (2003). Continental scale comparisons of terrestrial carbon sinks estimated from satellite data and ecosystem modeling 1982–1998. Global Planetary Change 39, 201– 213.
Reynolds, C. A., Jackson, T.J., and Rawls, W. J. (1999). Estimated available water content from the FAO soil map of the world, global soil profile databases, pedotransfer functions, Boulder: NOAA National Geophysical Data Center.
Schimel, D., et al. (2001). Recent patterns and mechanisms of carbon exchanges by terrestrial ecosystems, Nature, 414, 169-172. Tian, H., Melillo, J. M., Kicklighter, D. W., et al. (2003). Regional carbon dynamics in monsoon Asia and its implications for the global carbon cycle.Global and Planetary Change 37: 201– 217
Tucker, C.J., Pinzon, J., Brown, M., et al. (2005) Extended AVHRR 8-km NDVI data set compartable with MODIS and SPOT vegetation NDVI data, Int. J. Remote Sens., 26, 4485-498.
ACKNOWLEGEMENTS
This research work is carried out as the part of National carbon Project, ISRO-Geosphere and Biosphere Programme. We thank Global Inventory Modeling and Mapping Studies (GIMMS), NOAA for providing bi-monthly NDVI data. We also thank Climate Research Unit of East Anglia, UK for providing the various climate data used in this study.