www.biogeosciences.net/bg/1/147/ SRef-ID: 1726-4189/bg/2004-1-147 European Geosciences Union
Biogeosciences
Carbon dynamics and CO
2
air-sea exchanges in the eutrophied
coastal waters of the Southern Bight of the North Sea: a modelling
study
N. Gypens1, C. Lancelot1, and A. V. Borges2
1Universit´e Libre de Bruxelles, Ecologie des Syst`emes Aquatiques, CP-221, Bd du Triomphe, B-1050, Belgium
2Universit´e de Li`ege, MARE, Unit´e d’Oc´eanographie Chimique, Institut de Physique (B5), B-4000 Sart Tilman, Belgium Received: 16 August 2004 – Published in Biogeosciences Discussions: 7 September 2004
Revised: 6 December 2004 – Accepted: 20 December 2004 – Published: 23 December 2004
Abstract. A description of the carbonate system has been incorporated in the MIRO biogeochemical model to investi-gate the contribution of diatom andPhaeocystis blooms to the seasonal dynamics of air-sea CO2exchanges in the East-ern Channel and SouthEast-ern Bight of the North Sea, with focus on the eutrophied Belgian coastal waters. For this applica-tion, the model was implemented in a simplified three-box representation of the hydrodynamics with the open ocean boundary box ‘Western English Channel’ (WCH) and the ‘French Coastal Zone’ (FCZ) and ‘Belgian Coastal Zone’ (BCZ) boxes receiving carbon and nutrients from the rivers Seine and Scheldt, respectively. Results were obtained by running the model for the 1996–1999 period. The simulated partial pressures of CO2 (pCO2) were successfully com-pared with data recorded over the same period in the cen-tral BCZ at station 330 (51◦26.05′N; 002◦48.50′E). Bud-get calculations based on model simulations of carbon flow rates indicated for BCZ a low annual sink of atmospheric CO2(−0.17 mol C m−2y−1). On the opposite, surface wa-ter pCO2in WCH was estimated to be at annual equilibrium with respect to atmospheric CO2. The relative contribution of biological, chemical and physical processes to the modelled seasonal variability of pCO2 in BCZ was further explored by running model scenarios with separate closures of bio-logical activities and/or river inputs of carbon. The suppres-sion of biological processes reversed direction of the CO2 flux in BCZ that became, on an annual scale, a significant source for atmospheric CO2(+0.53 mol C m−2y−1). Over-all biological activity had a stronger influence on the mod-elled seasonal cycle of pCO2 than temperature. Especially Phaeocystiscolonies which growth in spring were associated with an important sink of atmospheric CO2that counteracted the temperature-driven increase of pCO2at this period of the year. However, river inputs of organic and inorganic carbon
Correspondence to:N. Gypens ([email protected])
were shown to increase the surface water pCO2and hence the emission of CO2to the atmosphere. Same calculations con-ducted in WCH, showed that temperature was the main fac-tor controlling the seasonal pCO2cycle in these open ocean waters. The effect of interannual variations of fresh water discharge (and related nutrient and carbon inputs), temper-ature and wind speed was further explored by running sce-narios with forcing typical of two contrasted years (1996 and 1999). Based on these simulations, the model predicts sig-nificant variations in the intensity and direction of the annual air-sea CO2flux.
1 Introduction
salt marshes (Wang and Cai, 2004) act as sources of CO2 to the atmosphere. However, the paucity of field data pre-vents the comprehensive biogeochemical description of the very diverse coastal ecosystems that is needed for the inte-gration of CO2 fluxes on a global scale. Furthermore, lit-tle is known on the seasonal and interannual variability of CO2 dynamics and fluxes in coastal ecosystems, although it has been shown to be highly significant in open oceanic waters in relation to large scale climatic forcings acting at various time-scales (e.g. Takahashi et al., 2003). In the ab-sence of long term time-series, these aspects of CO2cycling in coastal ecosystems can only be approached with modelling tools (e.g. Ianson and Allen, 2002). Up to now, little mecha-nistic modelling effort has been devoted to the description of the dynamics of dissolved inorganic carbon (DIC) in coastal environments (Walsh et al., 1994, 1996; Mackenzie et al., 2004).
The North Sea is amongst the best-studied coastal areas in the World, with respect to its physical, chemical and biolog-ical characteristics. However, the spatio-temporal monitor-ing of DIC has been limited to near-shore waters such as the German Bight, the Wadden Sea or the Belgian coastal zone (Hoppema, 1991; Borges and Frankignoulle, 1999, 2002b; Brasse et al., 2002). Recently the seasonality of pCO2has been investigated in the whole North Sea (Thomas et al., 2004b). On this basis a detailed carbon budget that identi-fies the major players in the large scale air-sea CO2 fluxes has been established (Thomas et al., 2004b). Results point the Southern Bight as distinct from the Northern North Sea in terms of organic and inorganic carbon cycling. This is related to both their different hydrographic features (perma-nently well-mixed shallow versus seasonally-stratified water column, in the South and North, respectively) and the influ-ence of rivers inputs that are concentrated in the Southern Bight.
The Belgian coastal zone (BCZ) located in the Southern Bight of the North Sea is a highly dynamic system with wa-ter masses resulting from the variable mixing between the in-flowing southwest Atlantic waters through the Strait of Dover and the Scheldt freshwater and nutrient inputs. The inflowing Atlantic waters are themselves enriched with nutrient inputs from the river Seine (Lancelot et al., 1987). The river in-puts characterized by a large excess of nitrate over phosphate and silicate are shaping the structure and the functioning of the ecosystem characterized by the dominance of undesirable recurrent blooms of non-siliceous phytoplankton like Phaeo-cystiscolonies (Lancelot, 1995).
In this paper, we test a complex biogeochemical model (MIRO-CO2)to investigate the present-day impact of land-based nutrients and carbon inputs from the Seine and Scheldt rivers on the functioning of the Phaeocystis-dominated ecosystem of the Southern Bight of the North Sea and the related air-sea CO2exchanges. The model is run over the 1996–1999 period when existing field data of CO2 partial pressure (pCO2)allow model validation. We further conduct
model scenarios to evaluate the respective contribution of bi-ological, chemical and physical processes to the seasonal and annual variability of pCO2. Finally, we investigate the im-pact of the hydro-climatic constraints (river inputs, tempera-ture, wind stress) on the pCO2seasonal dynamics by running scenarios with contrasting but realistic meteorological condi-tions.
2 Material and method
2.1 Model description
The MIRO-CO2 biogeochemical model results of the cou-pling of the detailed biogeochemical MIRO model (Lancelot et al., 2004) with the physico-chemical module of Hannon et al. (2001) detailing the seawater carbonate system and air-sea CO2exchange. MIRO is a mechanistic model that describes C, N, P and Si cycling through aggregated components of the Phaeocystis-dominated ecosystem of the North Sea. It includes thirty-two state variables assembled in four mod-ules expressing the dynamics of phytoplankton, zooplank-ton, organic matter degradation and nutrients (NO3, NH4, PO4 and SiO), regeneration by bacteria in the water col-umn and the sediment. The phytoplankton module considers three phytoplankton groups (diatoms, free-living autotrophic nanoflagellates andPhaeocystis colonies) the growth phys-iology of which is described according to the AQUAPHY model of Lancelot et al. (1991). The latter model consid-ers 3 intracellular constituents (small metabolites, reserve material, functional and structural metabolites) and distin-guishes different processes: photosynthesis, reserve synthe-sis and catabolism, growth and associated nutrient uptake, respiration and lysis. The zooplankton module details the dynamics of two groups: the microzooplankton feeding on free-living autotrophic nanoflagellates and bacteria and the mesozooplankton grazing on diatoms and microzooplankton.
100 km
North Sea
Channel
WCH FCZ
BCZ
Seine
Scheldt
Somme
Rhine
N
*
330Fig. 1.Map of the studied area showing the MIRO multi-box frame (adapted from Lancelot et al., 2004) and the location of the station 330 (51◦26.05′N; 002◦48.50′E).
biological uptake or release of carbon and the phytoplankton assimilation of nitrate, all provided by the MIRO model. Air-sea CO2fluxes are calculated from the pCO2gradient across the air-sea interface and the gas transfer velocity estimated from wind speed and using the parameterisation of Nightin-gale et al. (2000). The latter was chosen among several exist-ing empirical formulations since it was established from dual tracer experiments in the Southern Bight of the North Sea. 2.2 Model runs
The MIRO-CO2 model was applied in the coastal domain of the eastern English Channel and Southern Bight of the North Sea, between the Baie de Seine and the northern limit of BCZ (Fig. 1). The model was implemented in a multi-box frame delineated on the basis of the hydrological regime and the river inputs. In order to take into account the cu-mulated nutrient enrichment of Atlantic waters by the Seine and Scheldt rivers, two successive boxes, assumed to be homogeneous, were chosen from the Baie de Seine to the BCZ (Fig. 1). Each successive box was characterized by its own area, depth, water temperature and average salin-ity, light conditions and water residence time and was treated as an open system, receiving water from the southern adja-cent box and exporting water to the northern box (Lancelot et al., 2004). The boundary conditions were provided by the results of the calculations performed for the conditions ex-isting in the Western Channel area, considered as a quasi-oceanic closed system. Initial conditions of nutrients were extracted from the database of Radach et al. (1995). Initial conditions of DIC (2070 mmol C m−3)and total alkalinity (2290 mmol m−3)were estimated from existing data in the area for the 1996-1999 period (Borges and Frankignoulle, 2003). The seasonal variation of the state variables was cal-culated by solving the equations expressing mass conserva-tion, according to the Euler procedure, with a time step of
J F M A M J J A S O N D
0 5 10 15 20 25
0 10 20 30 40
W
ate
r te
mp
er
at
u
re
°
C
S
ali
n
ity
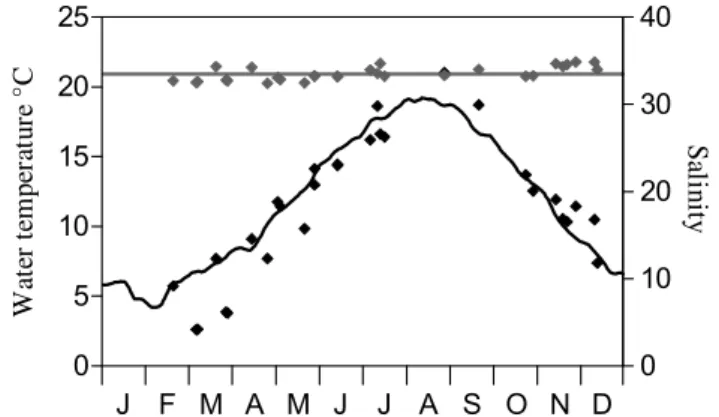
Fig. 2. Modelled (solid line for BCZ) and observed (at station 330) temperature (black) and salinity (grey).
15 min. Conservation equations and parameters are detailed in Lancelot et al. (2004).
Model simulations were run with 1996–1999 climatolog-ical forcings for hydro-meteorologclimatolog-ical conditions and river inputs. These functions were computed from recorded daily global solar radiation (Oostende Station, Institut Royal de M´et´eorologie, Belgium), seawater temperature and monthly nutrient loads for the rivers Seine (Cellule Antipollution de Rouen du Service de la Navigation de la Seine, France) and Scheldt [Institute for Inland Water Management and Waste Water Treatment, The Netherlands) and Department of En-vironment and Infrastructure (Ministry of Flemish Commu-nity, Belgium). Organic carbon loads by the Scheldt were re-trieved from the Dutch water base (http://www.waterbase.nl). For the river Seine, we used data described in Servais et al. (2003). Land-based fluxes of DIC and TA were esti-mated based on a compilation of DIC and TA concentra-tions in the Seine and the Scheldt rivers (Frankignoulle et al., 1996, 1998; Frankignoulle and Borges, 2001b; Abril, per-sonal communication) and river discharges, making use of the “apparent zero end-member” method (Kaul and Froelich, 1984). Atmospheric pCO2 was extracted from the Mace Head (53◦33′N 9◦00′W, Southern Ireland) and the National Oceanic and Atmospheric Administration/climate Monitor-ing and Diagnostics Laboratory/Carbon Cycle Greenhouse Gases Group (NOAA/CMDL/CCGG) air sampling network (available at http://www.cmdl.noaa.gov/). Wind speed at 50.0◦N 6.0◦W was provided by the Pacific Fisheries En-vironmental Laboratory (PFEL) and is based on Fleet Nu-merical Meteorology and Oceanography Center (FNMOC) synoptic pressure fields.
2.3 Validation data
a) Diatoms
0 50 100 150 200
mg
C
m
-3
b)Phaeocystis colonies
0 400 800 1200 1600
mg
C
m
-3
c) Chlorophyll-a
0 10 20 30 40
mg
C
h
la
m
-3
d) Bacteria
0 50 100
mg
C
m
-3
e) Microzooplankton
J F M A M J J A S O N D 0
50 100
mg
C
m
-3
f) Copepods
J F M A M J J A S O N D 0
50 100
mg
C
m
-3
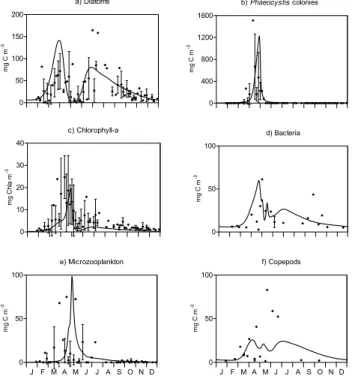
Fig. 3. Model results in BCZ (solid line) and observations 5-day average and standard deviation over 1996–1999 ()of(a)diatoms, (b)Phaeocystiscolonies,(c)Chlorophyll-a,(d)bacteria,(e) micro-zooplankton and(f)copepods at the station 330 for the 1996–1999 period.
were collected at a weekly frequency except during winter when bimonthly (Rousseau, 2000). DIC was calculated from TA and pCO2measured between 1996 and 1999 in the BCZ and WCH (Borges and Frankignoulle, 1999, 2002b, 2003). Due to the inherent discrepancy between in situ temperature at the time of pCO2 measurement and that imposed by the climatological forcing of the model (Fig. 2), field data of pCO2were corrected with respect to the modelled tempera-ture. Similarly, DIC and TA data obtained at station 330 were normalized to the mean BCZ salinity of 33.5 imposed by the chosen box-model implementation in order to overcome the effect of salinity discrepancy (Fig. 2). The normalized DIC and TA are written DIC(33.5)and TA(33.5).
3 Results and discussion
3.1 Model validation
3.1.1 Biological state variables
Figure 3 compares MIRO-CO2 predictions of diatom (Fig. 3a) and Phaeocystis (Fig. 3b) biomass, total phyto-plankton (mg Chl a m−3, Fig. 3c), bacteria (Fig. 3d), mi-crozooplanktonic (Fig. 3e) and copepods (Fig. 3f) biomass with field data collected between 1996 and 1999. The model
a) DIC(33.5)
1800 2000 2200 2400 2600
mmo
l C
m
-3
b) TA(33.5)
2000 2100 2200 2300 2400 2500 2600
mmo
l m
-3
c) pCO2
J F M A M J J A S O N D
0 100 200 300 400 500 600
ppm
Fig. 4. Model results (solid line) and observations ()of(a) dis-solved inorganic carbon DIC(33.5),(b)total alkalinity TA(33.5)and (c)surface water pCO2. The dotted line corresponds to the atmo-spheric equilibrium. Modelled results of sensitivity test were added (dotted line) on(a)DIC(33.5),(b)TA(33.5)plots.
reached by copepods and bacteria in spring and fall, respec-tively, are not properly simulated. These weaknesses of the model are discussed in Lancelot et al. (2004) and is mainly attributed to some mismatch between the simulated seasonal succession of copepods and their prey which might be re-lated to some unreliable description of either the mortality process and fate ofPhaeocystiscolonies and derived matter and/or the copepod feeding function. Experimental work in this matter is in progress.
3.1.2 Carbonate chemistry
Figure 4 compares MIRO-CO2 simulations of DIC(33.5) (Fig. 4a), TA(33.5)(Fig. 4b) and surface water pCO2(Fig. 4c) with field observations. The seasonal evolution of DIC(33.5) and TA(33.5) is reasonably well captured by the model but concentrations obtained overestimate field data, especially in winter and late fall (Fig. 4a, b) when biological activity is low (Fig. 3). The simulated DIC(33.5)clearly reaches lowest values at the time ofPhaeocystisbloom maximum (Fig. 3b; Fig. 4a) and increases in mid-May when heterotrophs pre-vail over autotrophs (Fig. 4a; Fig. 3d, e, f). In agreement the highest TA(33.5) values (Fig. 4a) are modelled in end April-early May when phytoplankton biomass is elevated (Fig. 3a, b, c) and consumes NO3. Lowest TA(33.5) are simulated in late fall (Fig. 4b) when phytoplankton growth has ceased but heterotrophic process and nitrification are still operating. The observed seasonal signal of TA(33.5) is well represented (Fig. 4b) but the modelled amplitude (110 mmol m−3)is weak compared to that suggested by field data (∼200 mmol m−3, Fig. 4b), mainly because of the fail-ure of the model to captfail-ure the observed late fall-winter min-ima (Fig. 4b). At the annual scale, Atlantic waters bring 96% of TA in BCZ and river loads and biological processes con-tribute 3.9% and 0.1%, respectively. Sensitivity tests with varying initial TA corresponding to the range of observed values in WCH (Borges and Frankignoulle, 2003) indicate that a reduction of WCH initial conditions of TA by less than 2% improves significantly model simulations of DIC (Fig. 4a) and TA (Fig. 4b) in winter while fall observations remain overestimated by the model (Fig. 4a, b). Elevated modelled TA in fall could result from an overestimation of river inputs during this period. At that time of the year (Oc-tober to January), river discharge is high and inputs of TA ac-count for 45% of annual river loads. Due to the importance of biological processes on magnitude and seasonal variability of DIC, modification of DIC initial value in the Western Chan-nel has no impact on DIC magnitude in the Belgian coastal zone.
The discrepancies in the BCZ between observed and mod-elled DIC and TA are due to the structure of the model since initial conditions are not forced in the BCZ but result from the transformations of chemical water properties from the WCH (model initial conditions) due to river inputs and bi-ological activity during transport through the FCZ and BCZ
Import Scheldt
Export BCZ
10.7
226.26
3.87 18.79
14.53
DIC
TOC
10.63 0.11
3.88
11.12 236.74
BCZ
0.17
10.7
226.26
3.87 18.79
14.53
DIC
TOC
10.63 0.11
3.88
11.12 236.74
BCZ
0.17
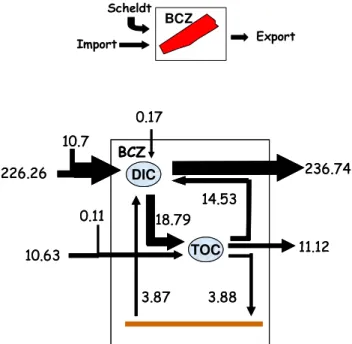
Fig. 5. Annual budget of C flows at the scale of the BCZ (mol C m−2y−1).
boxes. Altogether, these discrepancies between observed and modelled DIC and TA have no influence on the magnitude and seasonal evolution of the modelled pCO2.
The comparison between modelled and measured pCO2 (Fig. 4c) shows that our model is able to describe the ob-served seasonal variability, both in time and amplitude. The latter (defined as the difference between the maximum and minimum values) is evaluated at 300 ppm with pCO2values ranging between 445 ppm in summer and 145 ppm in spring (Fig. 4c). Model pCO2 values generally agree fairly well with observations except in fall when field data are signifi-cantly higher than modelled values. Over the winter season, modelled surface pCO2 are close to saturation (Fig. 4c). A marked decrease of pCO2is simulated in early March and co-incides with the onset of the diatom bloom (Fig. 4c; Fig. 3a) and pCO2reaches its minimum (145 ppm) during the Phaeo-cystis bloom (Fig. 4c; Fig. 3b). Modelled pCO2 increases asPhaeocystisdeclines and values above saturation with re-spect to atmospheric CO2are reached in July up to the end of October (Fig. 4c). The model early decrease of surface water pCO2in September compared to observations might be due to some underestimation of modelled bacterial biomass (and related activity) during fall (Fig. 3d).
3.2 Carbon budget
a) Air-sea CO2
-30 -20 -10 0 10 20 30
mmo
l C
m
-2 d
-1
-0.17 mol m-2 y-1
b) Water temperature
0 5 10 15 20 25
°C
-1 -0.5 0 0.5 1
c) GPP, R & NEP
J F M A M J J A S O N D
-1 -0.5 0 0.5 1
R GPP NEP
mo
l C
m
-2
d
-1
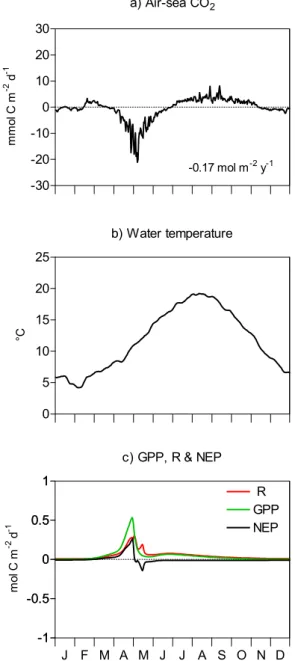
Fig. 6. Seasonal evolution of(a)modelled air-sea CO2flux, (b) mean water temperature for the 1996–1999 period and(c) gross primary production (GPP), total respiration (R) and net ecosystem production (NEP) computed for BCZ from MIRO-CO2daily simu-lations of biological activities.
highlight the importance of Atlantic inputs of inorganic (226.26 mol C m−2y−1)and organic (10.63 mol C m−2y−1) carbon representing, respectively, 95 and 99% of total inputs to BCZ. River Scheldt inputs contributes to 4.5 and 1% of total DIC and TOC inputs, respectively. The uptake of atmo-spheric CO2 is low (−0.17 mol C m−2 y−1) i.e. less than 0.1% of the total input of DIC. Autotrophic processes fix some 8% of the annual input of DIC (18.79 mol C m−2y−1) from which 77 and 20% is remineralzed in the water column
and sediment, respectively (Fig. 5). At the annual scale BCZ exports to the North some 0.38 mol C m−2y−1as TOC while little carbon is buried in the sediment (0.01 mol C m−2y−1). 3.3 Physical and biological controls of surface water pCO2 and air-sea CO2fluxes in central BCZ at the seasonal and annual scales
Physical and biological mechanisms regulating pCO2 (Fig. 4c) and air-sea exchanges of CO2(Fig. 6a) in central BCZ were first investigated based on the comparative anal-ysis of MIRO-CO2 daily forcing of temperature (Fig. 6b) and predictions of biological features (gross primary produc-tion GPP, community respiraproduc-tion R (including autotrophic and heterotrophic planktonic and benthic respiration) and net ecosystem production NEP (the difference between GPP and R), Fig. 6c). In winter (November to late February), NEP and R are close to zero (Fig. 6c) and pCO2 fluctua-tions (Fig. 4c) are modulated by river inputs of carbon and seawater temperature (Fig. 6b). The system is near equi-librium and air-sea CO2 fluxes are close to zero (Fig. 6a). From mid-March to end April, NEP is high enough to re-verse the positive effect of temperature increase on pCO2 that reaches extremely low values with respect to saturation (Fig. 4c; Fig. 6b, c). In accordance, our model calculates for this period an important sink of atmospheric CO2in cen-tral BCZ (up to−20 mmol C m−2 d−1; Fig. 6a). In May, NEP is strongly negative (i.e. the system is heterotrophic) and surface water pCO2 increases due to both respiration and temperature increase (Fig. 4c; Fig. 6b, c). As a conse-quence the system evolves progressively from a sink of at-mospheric CO2during spring to a source during the period end of June to November (Fig. 6a). After November, the system is again close equilibrium (Fig. 6a). Overall MIRO-CO2 estimates a weak annual sink of atmospheric CO2 of −0.17 mol C m−2y−1.
As a first attempt to appraise the relative importance of physical and biological controls of surface water pCO2, we used the approach of Takahashi et al. (2002) that separates the seasonal effect of ‘net biology’ from that of tempera-ture. As defined by these authors the ‘net biology’ effect includes the effect of biological processes, TA variation due to nitrate utilization, air-sea exchange of CO2and an addition of DIC and TA by external forcing (river inputs in the present study). Removal of the temperature effect on pCO2 simula-tions is obtained after normalization of modelled daily values of pCO2to the annual mean temperature (11.9◦C) using the equation:
a) Reference -30 -20 -10 0 10 20 30
-0.17 mol m-2 y-1
a ir-s e a C O2 , m m ol m
-2 d
-1
b) Suppression of biology
No biology : +0.53 mol m-2 y-1
No Phaeocystis : +0.31 mol m-2 y-1
c) Suppression of river C inputs
J F M A M J J A S O N D -30 -20 -10 0 10 20 30 ai r-s ea C O2 , m m ol m
-2 d
-1
-1.04 mol m-2 y-1
d) Temperature forcing
J F M A M J J A S O N D -0.32 mol m-2 y-1
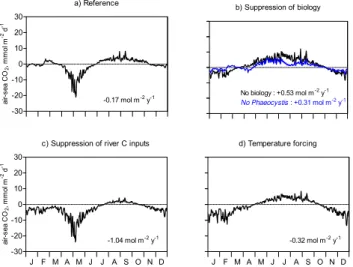
Fig. 7. Seasonal evolution of MIRO-CO2pCO2computed for(a) the reference run and by closing(b)biological processes or only
Phaeocystisgrowth,(c)river inputs of inorganic and organic car-bon or(d)both biological processes and carbon inputs. The annual integrated CO2air-sea flux calculated for each scenario is indicated on the corresponding plot.
The seasonal effect of temperature on pCO2is further esti-mated by attributing to the mean annual pCO2deduced from model runs (i.e. 360 ppm) a correction factor based on the difference betweenTmod andTmeanas above. According to these calculations, the effect of biology on pCO2, represented by the seasonal amplitude of pCO2 values corrected to the mean annual temperature, is estimated at 350 ppm (150 ppm in May to 500 ppm in February). The effect of tempera-ture change is less, 230 ppm (260 ppm in January-February to 490 ppm in July-August). The relative importance of the temperature and ‘net biology’ effect (T/B) is given by the ra-tio between the above seasonal amplitudes and is evaluated at 0.66. Thus, based on MIRO-CO2results we conclude that temperature contributed less to the seasonal pCO2 variabil-ity of central BCZ in 1996–1999 than biological processes. However in areas influenced by river inputs of carbon and nu-trients such as BCZ, the approach of Takahashi et al. (2002) includes their impact in the so-called ‘net biology’ effect.
As an alternate approach to resolve these contributions, we compared MIRO-CO2 reference 1996–1999 simulations of the seasonal evolution of surface water pCO2 in BCZ and the related annual air-sea CO2fluxes (Fig. 7a) with those ob-tained by closing separately biological processes, Phaeocys-tisonly (Fig. 7b) and the river inputs of organic and inorganic carbon (Fig. 7c). For the latter scenario the river nutrient inputs were maintained. A supplementary MIRO-CO2 sce-nario with closing both biological processes and river inputs of carbon was conducted to extract the solely thermodynamic effect of temperature change on pCO2(Fig. 7d).
Suppressing biological processes predicts in BCZ a signif-icant annual source of atmospheric CO2(+0.53 mol C m−2
a) pCO2
0 100 200 300 400 500 600 ppm
b) Air-sea CO2 flux
-30 -20 -10 0 10 20 30
BCZ: -0.17 mol m-2
y-1
WCH: -0.01 mol m-2
y-1
mmo
l C
m
-2 d
-1
c) Water temperature
J F M A M J J A S O N D 0 5 10 15 20 25 °C -0.5 -0.25 0 0.25 0.5 d) NEP
J F M A M J J A S O N D
-0.5 -0.25 0 0.25 0.5 mo l C m -2 d -1
Western Channel Belgian Coastal Zone
Fig. 8. Seasonal evolution of MIRO-CO2 simulations of daily (a)pCO2,(b)air-sea CO2flux,(c)water temperature and(d)net ecosystem production computed for WCH and BCZ boxes. Model results of pCO2in WCH (solid line) are compared with available observations in that area (). The dotted line, in the pCO2plots, corresponds to atmospheric pCO2. The calculated annual CO2 air-sea flux is added to each plot of air-air-sea CO2flux.
y−1, Fig. 7b). This suggests that biology is responsible for the annual sink predicted in BCZ (Fig. 7a) by taking up to 0.7 mol C m−2y−1of atmospheric CO2. In the absence of biology, seasonal evolution of water pCO2is mainly deter-mined by temperature and water CO2super-saturation with respect to the atmosphere is simulated in summer (Fig. 7b) when water temperature is elevated (Fig. 6b). Additional comparison with scenarios closing separately Phaeocystis
a) Scheldt water discharge
0 100 200 300 400
m
3 s
-1
b) Temperature
0 5 10 15 20 25
°C
c) Wind speed
J F M A M J J A S O N D
0 5 10 15 20
m s
-1
1996 1999 1996-1999
Fig. 9. Seasonal cycle of(a)Scheldt fresh water discharge, (b) water temperature and(c)wind speed for 1996 and 1999 compared to the climatological reference (for (a) Scheldt discharge and (b) water temperature).
d). NEP mostly that associated toPhaeocystiscolonies ex-plains the predicted CO2 sink in spring which, under these conditions of temperature should have been a CO2source to-wards the atmosphere (Fig. 7a, b). During summer, tempera-ture first and then C remineralization are the most important controls (Fig. 7b, d).
3.4 Role of land-based nutrients
In order to better appraise the role of land-based nutri-ents and carbon in modulating the seasonal cycle of surface water pCO2 and air-sea CO2 fluxes, we compared model
0 100 200 300 400 500 600
pC
O2
, p
p
m
0 100 200 300 400 500 600
pC
O2
, p
p
m
J F M A M J J A S O N D 0
100 200 300 400 500 600
pC
O2
, p
p
m
J F M A M J J A S O N D 0
100 200 300 400 500 600
pC
O2(
11.9)
, p
p
m
a) Wind speed forcing b) River forcing
Temperature forcing
1996 1999
c) d)
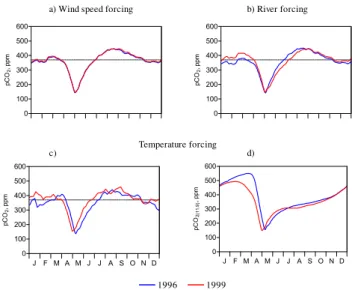
Fig. 10. Seasonal evolution of MIRO-CO2 pCO2 obtained with changing(a)wind speed,(b)river carbon and nutrient loads(c) wa-ter temperature of 1996 and 1999 and(d)same as (c) but normalized to BCZ average temperature of 11.9◦C. The dotted line corresponds to atmospheric equilibrium.
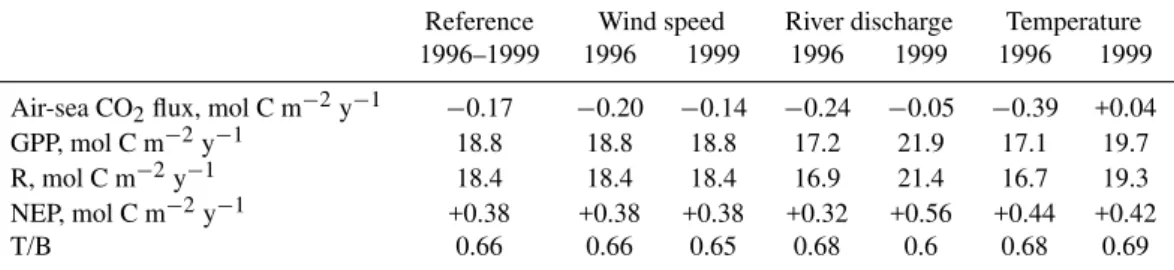
Table 1.Comparison between annual integrations of air-sea CO2fluxes, gross primary production (GPP), respiration (R) and net ecosystem production (NEP) computed for the reference run (1996–1999) and those obtained with separate modification to the reference of 1996 and 1999 river nutrient and carbon loads or temperature or wind speed forcing. The relative importance of temperature and biology effect on pCO2is expressed by the ratio T/B.
Reference Wind speed River discharge Temperature
1996–1999 1996 1999 1996 1999 1996 1999
Air-sea CO2flux, mol C m−2y−1 −0.17 −0.20 −0.14 −0.24 −0.05 −0.39 +0.04
GPP, mol C m−2y−1 18.8 18.8 18.8 17.2 21.9 17.1 19.7
R, mol C m−2y−1 18.4 18.4 18.4 16.9 21.4 16.7 19.3
NEP, mol C m−2y−1 +0.38 +0.38 +0.38 +0.32 +0.56 +0.44 +0.42
T/B 0.66 0.66 0.65 0.68 0.6 0.68 0.69
3.5 Sensitivity to external present-day forcings
In this section we explore to what extent changing meteo-rological conditions (rainfall (i.e. river discharge), temper-ature, wind stress) could alter the seasonal and annual dy-namics of pCO2 in coastal waters. For this application, we choose to compare MIRO-CO2 reference simulations rela-tive to the 1996–1999 climatological year with results ob-tained when running the model with changing one by one either the river inputs of carbon or the water temperature or the wind speed forcing corresponding to the most con-trasted “meteorological” years for the period (the dry 1996 and wet 1999 year). For each simulation, the other forc-ing were maintained equal to the reference 1996–1999 mean value. Over 1996–1999, nutrient loads were very variable, modulated by freshwater discharge that was higher in 1999 compared to 1996 (Fig. 9a). Nutrient concentrations in the Seine and Scheldt rivers were indeed unchanged over this period. Similarly, concentrations of organic and inorganic carbon were assumed constant. Significantly higher temper-atures were observed in 1999 compared to 1996, especially between January and August (Fig. 9b). Daily wind speeds were quite variable with however a similar annual average of 5.05 and 5.16 m s−1in 1996 and 1999, respectively (Fig. 9c). The relative impact of each forcing was explored based on a comparison of modelled pCO2along the season (Fig. 10) and MIRO-CO2 annual budget of biological activity (GPP, R and NEP) and air-sea CO2 flux (Table 1). Generally, the seasonal trends and magnitude of pCO2variations were not significantly modified. However, significant changes in the intensity and direction of the annual air-sea CO2 flux were simulated (Table 1).
3.5.1 Wind speed forcing
We found a negligible effect of wind speed on the seasonal cycle of pCO2 (Fig. 10a), since this forcing does not con-trol NEP and temperature in our model (Table 1). Still, these model scenarios reveal that the daily variations of wind speed impacted significantly on the annual budget of air-sea
CO2(18%; Table 1). The largest sink is predicted in 1996 (−0.2 mol C m−2 y−1, Table 1) and corresponds to lower gas transfer velocity, (8.38 and 8.58 cm h−1(normalized to a Schmidt number of 600) in 1996 than in 1999, respectively). 3.5.2 River forcing
Comparison of seasonal simulations of water pCO2obtained with 1996 and 1999 river loads, shows for 1996 lower val-ues between January and March, similar in May and higher from May to August (Fig. 10b). The lower late winter pCO2 simulated in 1996 are mostly due to the lower DIC river inputs as biological activity in winter is low. The ini-tial winter pCO2value in 1996 also probably explains why minimal pCO2 values simulated in spring are very simi-lar for both years (Fig. 10b), although the maximum NEP value obtained during the Phaeocystis bloom is higher in 1999 than 1996 (0.28 mol C m−2 d−1in 1999 compared to 0.21 mol C m−2d−1in 1996, not shown).
On an annual base we calculated a lower sink for atmo-spheric CO2in 1999 compared to 1996 (Table 1) which con-trasts with the elevated NEP simulated in 1999 (Table 1) in response to the higher riverine nutrient inputs. This has to be related to the higher DIC river inputs in 1999 that in-duce higher initial pCO2 values in winter (Fig. 10b). Al-together this scenario points the dual role of river inputs on the seasonal dynamics of pCO2in eutrophied coastal waters by modulating their carbon and nutrient conditions.
3.5.3 Temperature forcing
(Fig. 10d). The 9 days delay obtained for the minimal sim-ulated pCO2values in spring (Fig. 10d) is related to the late onset ofPhaeocystisbloom in 1996 as a consequence of the temperature dependence of GPP. On an annual base, NEP is lower in 1999 than in 1996 (Table 1), in spite of a higher GPP in 1999 than in 1996 (Table 1), due to the stronger tempera-ture dependence of heterotrophic processes.
The shift from an annual sink in 1996 to a source in 1999 of atmospheric CO2 (Table 1) is related to a combination of temperature effect on the carbon chemistry and biology (increased respiration at higher temperature). Their relative importance can be assessed through the calculation of the T/B i.e. the ratio between1pCO2(t emp)and1pCO2(bio) (Ta-ble 1). This suggests a higher temperature effect on biology than carbon chemistry. Indeed the T/B increase from 0.68 in 1996 to 0.69 in 1999 (Table 1) is due to a higher difference between1pCO2(bio)(362 ppm in 1996 compared to 353 ppm in 1999) than1pCO2(t emp) (247 ppm in 1996 and 244 ppm in 1999).
4 Conclusions
The MIRO-CO2 simulations, by showing stronger seasonal signals of pCO2 and related air-sea CO2 fluxes in the car-bon and nutrient-enriched BCZ compared to more oceanic waters (WCH), is giving additional support to observation-based conclusions on the key role of coastal areas in the global carbon cycle (e.g. Frankignoulle and Borges, 2001a). We also demonstrated the advantage of model simulations and sensitivity analysis for the identification of the major physical and biological mechanisms controlling the seasonal dynamics of surface water pCO2and their external forcing. In particular, we highlighted the significance of the Phaeo-cystisbloom in the spring-time drawn-down of atmospheric CO2. The model also allows us to explore how the intensity and direction of the annual air-sea CO2flux was changed in relation to realistic variations of environmental forcing such as water temperature, fresh water discharge or wind speed.
Model results revealed that the seasonal variation of pCO2 in the BCZ is strongly driven by nutrient-enriched biologi-cal activity in spring that counteracts the effect of temper-ature increase. On an annual scale for the 1996–1999 pe-riod, the solely river inputs of organic and inorganic car-bon are driving a source of CO2 of +0.87 mol C m−2 y−1 that is balanced by an atmospheric CO2uptake of−0.7 and −0.32 mol C m−2 y−1 due to nutrient stimulated NEP and temperature change, respectively. Globally an annual weak sink is predicted for BCZ. However, based on a sensitivity analysis, we also showed that the present-day interannual variations of fresh water discharge (and related land-based nutrient and carbon inputs) and water temperature might have a significant impact on the air-sea CO2 fluxes in the BCZ.
These simulations clearly illustrate the potentially sig-nificant but complex variations of CO2 fluxes in near-shore coastal ecosystems in response to small environmental changes within the range of present-day variability. These variations in CO2 fluxes are a small glimpse of those that can be expected from environmental changes predicted in the near future in context of global change and/or of man-agement strategies.
Acknowledgements. This work was carried out in the framework of the Belgium Federal Science Policy projects AMORE (EV/11/19) and CANOPY (EV/03/20), the EU-FP5 project EUROTROPH (EVK3-CT-2000-00040) and the project 2.4545.02 of the Fonds National de la Recherche Scientifique (FNRS). DIC and TA data in the Seine estuary were kindly provided by G. Abril (D´epartement de G´eologie et Oc´eanographie, Universit´e de Bordeaux 1). N. Gypens has financial support from the ‘Fond pour la Formation `a la Recherche dans l’Industrie et dans l’Agriculture’ (FRIA, FNRS, Belgium). We also acknowledge the reviewers for their constructive feedback.
Edited by: J. Middelburg
References
Billen, G. and Servais, P.: Mod´elisation des processus de d´egradation bact´erienne de la mati`ere organique en milieu aqua-tique, In: Micro-organismes dans les ´ecosyst`emes oc´eaniques (Bianchi, M., Marty, D., Bertrand, J.-C., Caumette, P., and Gau-thier, M.), edited by: Masson, 219–245, 1989.
Borges, A. V. and Frankignoulle, M.: Daily and seasonal variations of the partial pressure of CO2in the surface seawater along Bel-gian and southern Dutch coastal areas, J. Mar. Syst., 19, 251– 266, 1999.
Borges, A. V. and Frankignoulle, M.: Distribution of surface car-bon dioxide and air-sea exchange in the upwelling system off the Galician coast, Global Biogeochem. Cycles, 16 (2), art.-no. 1020, 1–14, 2002a.
Borges, A. V. and Frankignoulle, M.: Distribution and air-water exchange of carbon dioxide in the Scheldt plume off the Belgian coast, Biogeochemistry, 59, 41–67, 2002b.
Borges, A. V. and Frankignoulle, M.: Distribution of surface carbon dioxide and air-sea exchange in the English Chan-nel and adjacent areas, J. Geophys. Res., 108 (C8), 3140, doi:10.1029/2000JC000571, 2003.
Borges, A. V., Djenidi, S., Lacroix, G., Th´eate, J.-M., Delille, B., and Frankignoulle, M.: CO2 atmospheric flux from man-grove surrounding waters, Geophys. Res. Let., 30 (11), 1558, doi:10.1029/2003GL017143, 2003.
Bouillon, S., Frankignoulle, M., Dehairs, F., Velimirov, B., Eiler, A., Abril, G., Etcheber, H., and Borges, A. V.: Inorganic and organic carbon biogeochemistry in the Gautami Godavari estuary (Andhra Pradesh, India) during pre-monsoon: the local impact of extensive mangrove forests, Global Biogeoch. Cycles, 17 (4), 1114, doi:10.1029/2002GB002026, 2003.
Cai, W. J., Wiebe, W. J., Wang, Y. C., and Sheldon, J. E.: Intertidal marsh as a source of dissolved inorganic carbon and a sink of nitrate in the Satilla River-estuarine complex in the southeastern US, Limnol. Oceanogr., 45 (8), 1743–1752, 2000.
Cai, W.-J., Wang, Z. A., and Wang, Y.: The role of marsh-dominated heterotrophic continental margins in transport of CO2 between the atmosphere, the land-sea interface and the ocean, Geophys. Res. Lett., 30, 3–1/3–4, 2003.
DeGrandpre, M. D., Olbu, G. J., Beatty, C. M., and Hammar, T. R.: Air-sea CO2fluxes on the US Middle Atlantic Bight, Deep-Sea Research Part Ii, Topical Studies in Oceanography, 49 (20), 4355–4367, 2002.
Frankignoulle, M. and Borges, A. V.: European continental shelf as a significant sink for atmospheric carbon dioxide, Global Bio-geochem. Cycles, 15 (3), 569–576, 2001a.
Frankignoulle, M. and Borges, A. V.: Direct and indirect pCO2 measurements in a wide range of pCO2 and salinity val-ues (the Scheldt estuary), Aquatic Geochemistry, 7, 267–273, doi:10.1023/A:1015251010481, 2001b.
Frankignoulle, M., Bourge, I. and Wollast, R.: Atmospheric CO2 fluxes in a highly polluted estuary (The Scheldt), Limnology and Oceanography, 41 (2), 365–369, 1996.
Frankignoulle, M., Abril, G., Borges, A. V., Bourge, I., Canon, C., Delille, B., Libert, E., and Th´eate, J.-M.: Carbon dioxide emis-sion from European estuaries, Science, 282, 434–436, 1998. Gattuso, J.-P., Frankignoulle, M., and Wollast, R.: Carbon and
carbonate metabolism in coastal aquatic ecosystems, Ann. Rev. Ecol. Syst., 29, 405–433, 1998.
Hannon, E., Boyd, P. W., Silvoso, M., and Lancelot, C.: Modelling the bloom evolution and carbon flows during SOIREE: Implica-tions for future in situ iron-experiments in the Southern Ocean, Deep-Sea Research II, 48, 2745–2773, 2001.
Hoppema, J. M. J.: The seasonal behaviour of carbon dioxide and oxygen in the coastal North Sea along the Netherlands, Nether-lands Journal of Sea Research, 28 (3), 167–179, 1991.
Ianson, D. and Allen, E.: A two-dimensional nitrogen and carbon flux model in a coastal upwelling region, Global Biogeochem. Cycles, 6 (1), 1011, doi:10.1029/2001GB0001451, 2002. Kaul, L. and Froelich, P.: Modelling estuarine nutrient
biogeochem-istry in a simple system, Geochim. Cosmochim. Acta, 48, 1417– 1433, 1984.
Lancelot, C.: The mucilage phenomenon in the continental coastal waters of the North Sea, The Science of the Total Envir., 165, 83–102, 1995.
Lancelot, C., Billen, G., Sournia, A., Weisse, T., Colijn, F., Veld-huis, M., Davies, A., and Wassmann, P.: Phaeocystis blooms and nutrient enrichment in the continental coastal zone of the North Sea, Ambio, 16 (1), 38–46, 1987.
Lancelot, C., Spitz, Y., Gypens, N., Ruddick, K., Becquevort, S., Rousseau, V., Lacroix, G., and Billen, G.: Modelling diatom-Phaeocystis blooms and nutrient cycles in the Southern Bight of the North Sea with focus on the Belgian coastal zone: the MIRO model, Mar. Ecol. Prog. Syst., accepted, M5518, 2004.
Mackenzie, F. T., Lerman, A., and Andersson, A. J.: Past and present of sediment and carbon biogeochemical cycling models, Biogeosciences, 1, 11–32, 2004,
SRef-ID: 1726-4189/bg/2004-1-11.
Millero, F. J., Zhang, J.-Z., Fiol, S., Sotolonge, S., Roy, R. N., Lee, K., and Mane, S.: The use of buffers to measure pH in seawater, Marine Chemistry, 44, 143–152, 1993.
Nightingale, P. D., Malin, G., Law, C. S., Watson, A. J., Liss, P. S., Liddicoat, M. I., Boutin, J., and Upstill-Goddard, R. C.: In-situ evaluation of air-sea gas exchange parametrizations using novel conservative and volatile tracers, Global Biogeochem. Cycles, 14, 373–387, 2000.
Radach, G., P¨atsch, J., Gekeler, J., and Herbig, K.: Annual cy-cles of nutrients and chlorophyll in the North Sea, Ozeanographie Berichte 20, Zentrum f¨ur Meeres- und Klimaforschung, 1995. Raymond, P. A., Bauer, J. E., and Cole, J. J.: Atmospheric CO2
eva-sion, dissolved inorganic carbon production, and net heterotro-phy in the York River estuary, Limnol. Oceanogr., 45 (8), 1707– 1717, 2000.
Rousseau, V.: Dynamics of Phaeocystis and diatom blooms in the eutrophicated coastal waters of the Southern Bight of the North Sea, PhD Thesis, Universit´e Libre de Bruxelles, Belgium, 205, 2000.
Servais, P., Mercier, P., and Anzil, A.: Activit´e h´et´erotrophe et biod´egradabilit´e de la mati`ere organique dans la zone de turbidit´e maximale de l’estuaire de Seine, Programme Seine-Aval, 2003. Takahashi, T., Sutherlan, S. C., Sweeney, C., Poisson, A., Metzl,
N., Tilbrook B., Bates, N., Wanninkhof, R., Feely, R. A., Sabine, C., Olafsson, J., and Nojiri, Y.: Global sea-air CO2flux based on climitalogical surface ocean pCO2, and seasonal biological and temperature effects, Deep-sea Research II, 49, 1601–1622, 2002. Takahashi, T., Sutherland, S. C., Feely, R. A., and Cosca, C. E.: Decadal variation of the surface water pCO2in the western and central equatorial Pacific, Science, 302 (5646), 852–856, 2003. Thomas, H., Bozec, Y., Elkalay, K., and de Baar, H. J. W.: Enhanced
open ocean storage of CO2 from shelf sea pumping, Science, 304, 1005–1008, 2004a.
Thomas, H., Bozec, Y., de Baar, H., Elkalay, K., Frankignoulle, M., Schiettecatte, L.-S., and Borges, A. V.: The Carbon budget of the North Sea, Biogeosciences Discussions, 1, 367–392, 2004b, SRef-ID: 1810-6285/bgd/2004-1-367.
Tsunogai, S., Watanabe, S., and Sato, T.: Is there a “continen-tal shelf pump” for the absorption of atmospheric CO2?, Tellus Series B-Chemical and Physical Meteorology, 51 (3), 701–712, 1999.
Walsh, J. J. and Dieterle, D. A.: CO2cycling in the coastal ocean, I – A numerical analysis of the Southeastern Bering Sea with applications to the Chukchi Sea and the northern Gulf of Mexico, Prog. Oceanog., 34, 335–392, 1994.
Walsh, J. J., Dieterle, D. A., Muller-Karger, F. E., Aagaard, K., Roach, A. T., Whitledge, T. E., and Stockwell, D.: CO2cycling in the coastal ocean, II. Seasonal organic loading of the Arctic Ocean from source waters in the Bering Sea, Cont. Shelf Res., 17 (1), 1–36, 1996.
Wang, Z. A. and Cai, W.-J.: Carbon dioxide degassing and inor-ganic carbon export from a marsh-dominated estuary (the Duplin River): A marsh CO2 pump, Limnol. Oceanogr., 49 (2), 341– 354, 2004.