www.atmos-chem-phys.net/9/2543/2009/ © Author(s) 2009. This work is distributed under the Creative Commons Attribution 3.0 License.
Chemistry
and Physics
Aerosol hygroscopicity in the marine atmosphere: a closure study
using high-time-resolution, multiple-RH DASH-SP and size-resolved
C-ToF-AMS data
S. P. Hersey, A. Sorooshian, S. M. Murphy, R. C. Flagan, and J. H. Seinfeld
Departments of Chemical Engineering and Environmental Science and Engineering, Caltech, Pasadena, CA 91125, USA Received: 14 July 2008 – Published in Atmos. Chem. Phys. Discuss.: 4 September 2008
Revised: 17 November 2008 – Accepted: 24 March 2009 – Published: 7 April 2009
Abstract. We have conducted the first airborne hygro-scopic growth closure study to utilize data from an Aero-dyne compact Time-of-Flight Aerosol Mass Spectrome-ter (C-ToF-AMS) coupled with size-resolved, multiple-RH, high-time-resolution hygroscopic growth factor (GF) mea-surements from the differential aerosol sizing and hygro-scopicity spectrometer probe (DASH-SP). These data were collected off the coast of Central California during seven of the 16 flights carried out during the MASE-II field campaign in July 2007. Two of the seven flights were conducted in airmasses characterized by continental ori-gin. These flights exhibited elevated organic volume frac-tions (VForganic=0.56±0.19, as opposed to 0.39±0.20 for all other flights), corresponding to significantly suppressed GFs at high RH (1.61±0.14 at 92% RH, as compared with 1.91±0.07 for all other flights), more moderate GF sup-pression at intermediate RH (1.53±0.10 at 85%, compared with 1.58±0.08 for all other flights), and no measurable GF suppression at low RH (1.31±0.06 at 74%, compared with 1.31±0.07 for all other flights). Organic loadings were slightly elevated in above-cloud aerosols, as compared with below-cloud aerosols, and corresponded to a similar trend of significantly suppressed GF at high RH, but more moderate impacts at lower values of RH. A hygroscopic closure based on a volume-weighted mixing rule provided good agreement with DASH-SP measurements (R2=0.78). Minimization of root mean square error between observations and predictions indicated mission-averaged organic GFs of 1.22, 1.45, and 1.48 at 74, 85, and 92% RH, respectively. These values agree with previously reported values for water-soluble or-ganics such as dicarboxylic and multifunctional acids, and correspond to a highly oxidized, presumably water-soluble,
Correspondence to:J. H. Seinfeld ([email protected])
organic fraction (mission-averaged O:C=0.92±0.33). Fi-nally, a backward stepwise linear regression revealed that, other than RH, the most important predictor for GF is VForganic, indicating that a simple emperical model relat-ing GF, RH, and the relative abundance of organic material can provide accurate predictions (R2=0.77) of hygroscopic growth for the California coast.
1 Introduction
Atmospheric aerosols change size with fluctuations in rela-tive humidity, with a magnitude dictated by chemical com-position. Because this hygroscopic response determines par-ticle size, it influences direct climate forcing attributed to aerosols. Further, subsaturated hygroscopic growth factor (Dp,wet/Dp,dry) is strongly correlated with CCN activity (Prenni et al., 2001). Given the importance of aerosol water uptake on both the direct and indirect light scattering proper-ties of aerosols, incomplete understanding of aerosol hygro-scopicity has been identified as a major limitation in estima-tions of climate forcing (IPCC, 2007).
Massling et al., 2007), and chamber (e.g., Ansari and Pandis, 2000; Cocker et al., 2001a,b; Duplissy et al., 2008) studies have sought to address how the presence of organics affects the water uptake characteristics of atmospheric aerosol. De-spite advances in understanding of hygroscopic characteris-tics of organic-containing particles, measurements of aerosol hygroscopicity in field campaigns have remained relatively sparse.
Closure studies, which attempt to reconcile simultane-ously measured hygroscopic and chemical data, link labo-ratory studies of hygroscopicity, theoretical models for water uptake, and field measurements of aerosol-water interactions. The standard method for predicting hygroscopic growth from composition data is based on volume-weighted water uptake by the individual chemical constituents. While it is usually possible to predict water uptake for the inorganic fraction of atmospheric aerosols, the wealth of organic species in the at-mosphere, combined with limited understanding of organic aerosol hygroscopicity, has led investigators to assign the wa-ter uptake of organics as the particle growth not explained by inorganic constituents (e.g., Malm et al., 2005).
An important approach in hygroscopicity closure is to combine ambient measurements of water uptake with simul-taneous, detailed chemical measurements from the Aerodyne Aerosol Mass Spectrometer (AMS). One notable ground-based study in an urban atmosphere (Gysel et al., 2007) used chemical data from the AMS to make volume-weighted pre-dictions of hygroscopic growth factor (GF), providing good agreement between predicted and measured hygroscopicity values. Their study represents an improvement in the hygro-scopic treatment of organics over prior work, but is limited by both low time resolution and single-RH conditions inher-ent in HTDMA systems.
The current study presents data obtained during seven flights in the marine atmosphere off the coast of Central Cal-ifornia during the second Marine Stratus/Stratocumulus Ex-periment (MASE-II). The dataset is the first to combine time-resolution, size-resolved AMS chemistry with high-time-resolution, size-resolved hygroscopic data at multiple RH values from the Differential Aerosol Sizing and Hy-groscopicity Spectrometer Probe (DASH-SP). Hygroscopic studies have previously been carried out in the marine atmo-sphere (see Table 1), but none of those listed utilized either AMS chemical data or hygroscopic data as highly size-, time-and RH-resolved as those presented here.
2 Experimental
2.1 MASE-II Experiment
The data presented here were obtained during a series of seven cloud probing flights carried out as part of the second Marine Stratus/Stratocumulus Experiment (MASE-II) field campaign during July 2007. The MASE-II experiment was
the second of two airborne field campaigns directed toward measurement of aerosol-cloud relationships in marine stra-tocumulus in the Eastern Pacific Ocean. The Marine Stra-tus/Stratocumulus Experiment (MASE) was carried out in 2005 off the coast of Monterey, California (Lu et al., 2007), and MASE-II was undertaken in 2007 in the same region. Both experiments were carried out in the month of July, when marine stratocumulus are prevalent over the region, and uti-lized the CIRPAS Twin Otter aircraft. In each campaign, comprehensive airborne measurements were made of aerosol and cloud properties in areas both perturbed and unperturbed by continental emissions. Tables 2 and 3 list the flights car-ried out during MASE-II and the instrument payload on-board the Twin Otter, respectively. The present study ad-dresses measurements of the hygroscopic properties of ma-rine aerosols during MASE-II. Other flights probed emis-sions from a large bovine source and a large container ship, and these data are presented elsewhere (Sorooshian et al., 2008b; Murphy et al., 2009).
2.2 Aerosol composition measurements
Non-refractory aerosol chemical species were characterized by the Aerodyne compact Time-of-Flight Aerosol Mass Spectrometer (C-ToF-AMS) (Drewnick et al., 2004a,b). Particles with vacuum aerodynamic diameters (Dva) 50 nm≤Dva≤800 nm are focused by an aerodynamic lens, pass through a 3.5% chopper, and are vaporized at 530– 600◦C. The chopper is operated in three modes, to detect
background mass spectra, ensemble average mass spectra over all particle sizes, or size-resolved mass spectra. After particle vaporization, molecules are ionized via electron im-pact, and are pulsed into a time-of-flight mass spectrome-ter. MASE-II data were collected at unit mass resolution. AMS mass spectra are deconvolved into sulfate, nitrate, am-monium, and organic mass loadings (Allan et al., 2004). O:C ratios are determined by using mass concentration atm/z44 and a parameterization presented in Aiken et al. (2008).
AMS measurements were averaged to match the time-resolution of hygroscopicity measurements, and particle den-sity was calculated for each flight leg. Because the C-ToF-AMS measures particle vacuum aerodynamic diame-ter (Dva) and the DMA measures electrical mobility diam-eter (Dem), one can determine particle density by compar-ing the volume distribution from the DMA (dV /dlog(Dem)) to the total mass distribution measured by the C-ToF-AMS (dM/dlog(Dva)) (DeCarlo et al., 2004). If one assumes that the aerosol consists of an internal mixture of spheri-cal particles, the relationship between the two diameters is
Table 1.Previous marine aerosol hygroscopicity studies.
Investigators Year Study Area Reported GFs
Hegg 1996 Eastern Pacific 1.4–2.0
Berg 1998 Pacific and Southern Oceans 1.56–1.78 Kotchenruther 1998 Mid-Atlantic 1.81–2.3∗ Gasso 2000 Eastern Atlantic γ=0.51−0.75∗∗ Swietlicki 2000 Northeastern Atlantic 1.6–1.8
Zhou 2001 Arctic Ocean 1.4–1.9
Hegg 2002 Eastern Pacific γ=0.2−0.7∗∗ Vakeva 2002 Northeastern Atlantic 1.3–1.4∗∗∗ Massling 2003 Atlantic and Indian Oceans 1.6–2.0
Hegg 2006 Eastern Pacific 1.3–1.5
Kaku 2006 Eastern Pacific 1.2–1.7
Tomlinson 2007 Southeastern Pacific 1.3–1.7∗∗∗∗
∗Ratio of light scattering coefficient at 80% RH to 30% RH.
∗∗
γfrom the expressionbsp(RH )/bsp(RH0)=((1−RH /100)/(1−RH0/100))−γ (Kasten, 1969).
∗∗∗Aitken mode particles.
∗∗∗∗
85% RH.
the final calculated particle density. Organic density is then calculated by using the bulk chemistry from the C-ToF-AMS for a given time period and assuming the particles measured by the DMA are completely dry. The dry densities of all the inorganic components are known and, assuming volume additivity, the density of the organic component can then be estimated. If the inorganic component of the particles mea-sured by the DMA is not completely dry, this procedure will result in an underestimate of the particle density because the
Demwill be larger than it would have been for a dry particle. Particles entering the C-ToF-AMS are assumed to be dry, and even if they are not completely devoid of water, the presence of small amounts of water causes little change in the vacuum aerodynamic diameter. One important issue concerning C-ToF-AMS data is the collection efficiency of particles within the instrument (Huffman et al., 2005). In this study, C-ToF-AMS mass loadings were confirmed by comparison between the sulfate measurements from the C-ToF-AMS and the Par-ticle Into Liquid Sampler – Ion Chromatograph (PILS-IC, Brechtel Mfg. Inc.) during periods when there were no rapid fluctuations in particulate mass loading. Composition data represent size-resolved AMS chemistry averaged over 10 nm size bins.
2.3 Hygroscopicity measurements
Hygroscopicity measurements were carried out with the Dif-ferential Aerosol Sizing and Hygroscopicity Spectrometer Probe (DASH-SP, Brechtel Mfg; Sorooshian et al., 2008a). Ambient particles pass through a nafion dryer before re-ceiving a uniform charge distribution in a 210Po neutral-izer. A cylindrical, single-classification differential mobil-ity analyzer (DMA) then size selects particles into narrow
Table 2.MASE-II flights.
Flight Date Type of Flight Number (July 2007)
(RF)
1 10 Cloud/aerosol interactions 2 11 Cloud/aerosol interactions
3 12 Bovine source probe
4 14 Cloud/aerosol interactions 5 15 Cloud/aerosol interactions
6 16 Coordinated ship plume probe
7 21 Cloud/aerosol interactions 8 22 Cloud/aerosol interactions 9 23 Cloud/aerosol interactions 10 24 Cloud/aerosol interactions 11 25 Cloud/aerosol interactions 12 26 Cloud/aerosol interactions 13 28 Cloud/aerosol interactions 14 29 Cloud/aerosol interactions
15 30 Bovine source probe
16 31 Cloud/aerosol interactions
Table 3.MASE-II instrument payload.
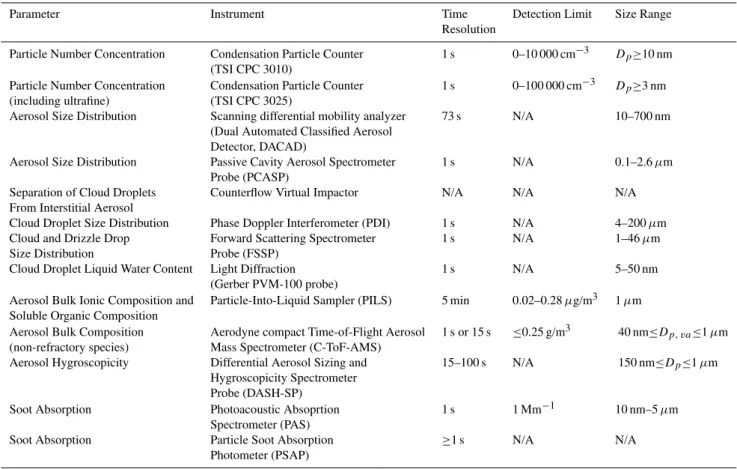
Parameter Instrument Time Detection Limit Size Range
Resolution
Particle Number Concentration Condensation Particle Counter 1 s 0–10 000 cm−3 Dp≥10 nm
(TSI CPC 3010)
Particle Number Concentration Condensation Particle Counter 1 s 0–100 000 cm−3 Dp≥3 nm
(including ultrafine) (TSI CPC 3025)
Aerosol Size Distribution Scanning differential mobility analyzer 73 s N/A 10–700 nm
(Dual Automated Classified Aerosol Detector, DACAD)
Aerosol Size Distribution Passive Cavity Aerosol Spectrometer 1 s N/A 0.1–2.6µm
Probe (PCASP)
Separation of Cloud Droplets Counterflow Virtual Impactor N/A N/A N/A
From Interstitial Aerosol
Cloud Droplet Size Distribution Phase Doppler Interferometer (PDI) 1 s N/A 4–200µm
Cloud and Drizzle Drop Forward Scattering Spectrometer 1 s N/A 1–46µm
Size Distribution Probe (FSSP)
Cloud Droplet Liquid Water Content Light Diffraction 1 s N/A 5–50 nm
(Gerber PVM-100 probe)
Aerosol Bulk Ionic Composition and Particle-Into-Liquid Sampler (PILS) 5 min 0.02–0.28µg/m3 1µm
Soluble Organic Composition
Aerosol Bulk Composition Aerodyne compact Time-of-Flight Aerosol 1 s or 15 s ≤0.25 g/m3 40 nm≤Dp, va≤1µm
(non-refractory species) Mass Spectrometer (C-ToF-AMS)
Aerosol Hygroscopicity Differential Aerosol Sizing and 15–100 s N/A 150 nm≤Dp≤1µm
Hygroscopicity Spectrometer Probe (DASH-SP)
Soot Absorption Photoacoustic Absoprtion 1 s 1 Mm−1 10 nm–5µm
Spectrometer (PAS)
Soot Absorption Particle Soot Absorption ≥1 s N/A N/A
Photometer (PSAP)
laser beam (λ=532 nm, World Star Technologies, Model TECGL-30) and scatter light in proportion to size (Dp) and refractive index (RI). Forward-scattered light is collected and focused on a photomultiplier tube, and the resulting electrical pulse is recorded by a high-speed data acquisition computer. An iterative data processing algorithm, based on laboratory calibrations with salts of known refractive indices, is used to determine the best fit on a solution surface relating elec-trical pulse height, size, and refractive index. The hygro-scopic growth factor (GF=Dp,wet/Dp,dry) is corrected for the RI change caused by particulate liquid water at elevated RH. Temperature and pressure measurements are continually made at multiple locations in the instrument, and used to en-sure that temperature and presen-sure variability do not impact hygroscopicity measurements.
In the current study, hygroscopicity was measured at dry sizes corresponding toDemof 150, 175, and 200 nm. Multi-ple RH sensors in the nafion tubes and OPCs controlled RHs to dry (≤8%), 74%, 85%, and 92%, with RH uncertainty of 1.5%. Low particle loadings inherent in the marine at-mosphere required increased on-line collection times at each DMA size step, but usually≤1 min was sufficient to over-come counting statistic limitations. Overall uncertainty in GF calculations is 4.5%.
Assuming particles to be uniform, non-light-absorbing spheres allows the assumption that the intensity of scattered light is a function of only RI and Dp. This assumption also allows calculation of dry, “effective” RI from the known DMA-selectedDpand measured scattered light intensity. 2.4 Hygroscopic closure
A volume-weighted mixing rule was used to perform a hy-groscopic closure using AMS and DASH-SP data, under the assumption of independent and additive water uptake by in-dividual constituents in each particle:
GFmixed(aw)=
X
i
ǫiGFi(aw)3
!1/3
(1) where GFmixedis the overall particle GF,aw is the water ac-tivity, GFi is the hygroscopic growth factor for pure species
i, andǫi is the volume fraction of speciesi. At equilibrium,
species was determined on the basis of the ammonium to sul-fate molar ratio (SR=[NH+4]/SO24−]). When SR≤1, the sul-fate was assumed to be a mixture of H2SO4and NH4HSO4; when 1<SR<2, sulfate was assumed to be a mixture of NH4HSO4 and (NH4)2SO4; when SR≥2, sulfate was as-sumed to be solely (NH4)2SO4. During MASE-II, sulfate was predominantly found to exist as NH4HSO4.(NH4)2SO4 is assumed to have a GF of unity at RH equal to 74% since particles are exposed to RH well below its effloresence point before subsequent rehumidification. The organic fraction was assumed to be hydrophilic, based on evidence of a high degree of organic oxygenation from AMS mass spectra (see Sect. 3.3). Values of GFifor the organic fraction were calcu-lated as those necessary to minimize the root mean square er-ror in comparing predictions with measured hygroscopicity.
3 Results
GF values for seven flights are presented (RF 7, 10, 11, 12, 13, 14, and 16 in Table 2). Table 4 presents measured GFs at each RH and eachDem,dry. Typically, multiple mea-surements were made on each leg, at each size, for each flight. The error reported is±one standard deviation in these multiple measurements. When only one measurement was made at a given size in a given leg, it is reported without error. Ship plumes were encountered on flights 10 and 16, as evidenced by brief, significantly elevated particle num-ber concentration. Analysis of GF measurements in these presumptive plumes is not presented in the present work. Aerosol densities were calculated for each leg and used in the analysis below. Mission-averaged densities (averaged over all flight legs) were found to be 1.53±0.19, 1.56±0.20, and 1.47±0.15 g/cm3for below-cloud, above-cloud, and free troposphere legs, respectively. Mission-averaged organic densities were calculated to be 1.20±0.76, 1.34±0.46, and 1.30±0.24 for below-cloud, above-cloud, and free tropo-sphere legs, respectively.
3.1 Airmass origin
Relative to the other flights, RF 12 and 16 exhibited signifi-cantly suppressed water uptake at high RH for all dry sizes. During these two flights, 92% GF values for 200 nmDem,dry particles averaged 1.61±0.14, as compared with 1.91±0.07 for all other flights. These low-GF flights corresponded to significantly elevated total organic, as measured by the AMS. Mass concentration averaged 1.97±1.71µg/m3 or-ganic (as opposed to 0.58±0.63µg/m3for all other flights), corresponding to volume fraction organic (VForganic) of 0.56±0.19 (as opposed to 0.39±0.20 for all other flights).
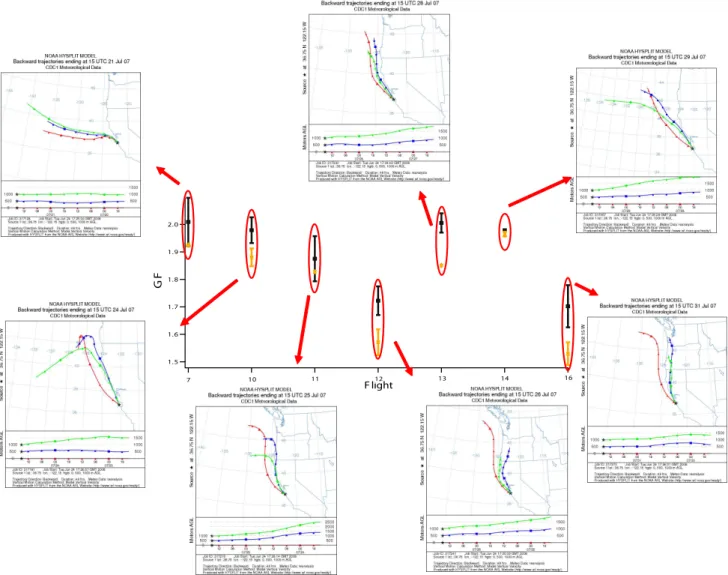
Back-trajectory analysis suggests that the MASE-II flights can be categorized by airmass origin as either polluted/continental (flights 12, 16), or non-continentally influenced (flights 7, 10, 11, 13, 14). Figure 1 shows
92% GF measurements for 200 nmDem,dry particles, with corresponding 48-h HYSPLIT (available at: http://www. arl.noaa.gov/ready/hysplit4.html) back-trajectories identify-ing airmass origin. Note that the low GFs and high VForganic measured on flights 12 and 16 correspond with airmass ori-gins over the continental United States, while higher GFs and lower VForganicmeasured on other flights correspond to air-mass origins over the clean marine environment. It is in-teresting to note that trajectories at sea level have marine origins for all flights (including low-GF flights 12 and 16), and that there is a general trend of descending air from aloft over the course of the trajectories. This suggests that mix-ing of air from aloft is a significant factor in determinmix-ing aerosol characteristics in the marine boundary layer. It is also noteworthy that GF values at low RH were not signif-icantly suppressed, with values of 1.31±0.06 at 74% (com-pared with 1.31±0.07 for all other flights). GF values at in-termediate RH were moderately suppressed in the continen-tal airmasses, measuring 1.53±0.10 at 85% (compared with 1.58±0.08 for all other flights). In other words, the effect of the high-VForganic, continental airmass was to significantly suppress GF at high RH, while having no measurable effect on aerosol water uptake at low RH and a moderate impact at intermediate RH. These results, while suggestive of con-tinental airmass influence, should be interpreted in light of the relatively coarse grid resolution of the HYSPLIT model. In this analysis, small shifts in back-trajectories toward conti-nental origin correlate with significantly suppressed high-RH GFs.
3.2 Hygroscopicity trends
No size-dependent hygroscopicity was observed over the range of measuredDem,dry, and in addition, no significant size-dependent trends in VForganic were observed. Further, organic-to-sulfate ratios from the AMS showed no signifi-cant variation over the size range measured by the DASH-SP. This suggests an internally-mixed aerosol between dry sizes of 150 and 200 nm.
1.31±0.05 above cloud, compared with 1.36±0.05 below. It appears, then, that the elevated organic loadings typical of above-cloud legs are correlated with GF suppression at high RH, and more moderate GF suppression at lower RHs. 3.3 Hygroscopic closure
A hygroscopic closure was performed, using volume-weighted hygroscopic contributions from each chemi-cal constituent identified by the AMS. O:C ratios for the flights presented were very similar for below-cloud (0.93±0.32), above-cloud (0.91±0.26), and free troposphere (0.92±0.25) legs in both continentally- (0.94±0.30) and marine-influenced (0.91±0.25) flights. This result indicates that the organic component was consistently highly oxidized. With this evidence, the organic fraction was treated as a bulk, water-soluble constituent and was not divided into soluble and insoluble fractions based on AMS organic mass spec-tra (Kondo et al., 2007). As described in Sect. 2.4, GF values were calculated for the organic component of the aerosol by minimizing root mean square error when com-paring measured GFs with volume-weighted closure predic-tions. Mission-averaged organic GFs were determined to be 1.22, 1.45, and 1.48 at 74, 85, and 92% RH, respectively. Agreement at 74 and 92% RH is within 2%, compared with the hydrophilic multifunctional and dicarboxylic acids pa-rameterized in Peng et al. 2001, though the 85% organic GF is overpredicted here by 7%. Closure results are pre-sented in Fig. 3. Markers in Fig. 3 are color-coded accord-ing to relative humidity, and marker size is proportional to VForganic. The volume-weighted hygroscopic closure utiliz-ing size-resolved AMS chemistry achieves good agreement with the 675 DASH-SP GF measurements, with anR2 of 0.78. Agreement is better at lower values of RH, owing to smaller GF magnitudes and less overall GF variability.
Aside from the obvious RH dependence of GF values, the clearest trend in Fig. 3 is that of larger markers (higher VForganic) at low GF transitioning to smaller markers (lower VForganic) at high values of GF for the same RH. The clar-ity and regularclar-ity of this trend reveal the importance of the organic fraction in determining GF values.
3.4 Simplified parameterization
To further investigate the relative importance of each pa-rameter in quantifying aerosol water uptake, and to detem-ine the simplest empirical model still capable of accurately predicting GF, a backward stepwise linear regression was performed. The process, which eliminates predictors one-by-one to generate increasingly simplified linear representa-tions of data, started with over 60 predictors, ranging from PILS and AMS chemical parameters to atmospheric data. The result is a two-parameter model that predicts GF as a function of RH and VForganic:
GF= −0.312+0.0233(RH)−0.282(VForganic) (2)
Figure 4 demonstrates the accuracy with which this model predicts DASH-SP GF values over the measured the range of RH and VForganic. It is noteworthy that theR2for this model is 0.77, indicating that the simple, two-parameter model ex-plains only 1% less variability than the full volume-weighted chemical closure, which contains significantly more informa-tion (i.e. multiple inorganic chemical species and their indi-vidual GFs, in addition to organic fraction with its associated GF). It appears as though accurate predictions of particle wa-ter uptake in this region can be made simply on the basis of relative humidity and the relative abundance of organics in the aerosol, given a relatively uniform, highly-oxidized or-ganic component internally mixed with predominantly am-monium bisulfate. While this model accurately predicts GF over the range of RH and VForganic, and for the O:C ratios measured during MASE-II, it should not be used when RH is outside the range 74%≤RH≤92%, or where VForganicis less than 0.1 or greater than 0.9.
4 Discussion
Comparing mixed organic-inorganic particles with those comprised entirely of inorganic salts, there is a strong RH-dependence in the effect of organics on hygroscopicity (Peng et al., 2001). During the MASE-II field campaign, GF values at 74% RH averaged ~1.3. Organic GFs were calculated to be 1.22 at 74% RH, suggesting that they contributed signifi-cantly to overall aerosol water uptake at low RH. GF values at 85% RH averaged ~1.6 during the campaign, and so the organic GF of 1.45 calculated for 85% RH suggests that or-ganics played a less significant role, but still influenced water uptake at intermediate RH. An organic GF value of 1.48 was calculated for 92% RH, with DASH-SP 92% GF measure-ments of ~1.8 indicating that organics make little contribu-tion to overall water uptake at high RH.
Inorganic salts exhibit deliquescent behavior as RH is in-creased. Many organics do not deliquesce or crystallize when RH is increased or decreased, respectively, but instead re-tain water at RH values well below the RH of deliquescence (RHD) of the inorganic salts with which they often co-exist in ambient particles. As a result, at RH values below the salt RHD, the presence of organics enhances water uptake. Thus, the effect of organics is to contribute significantly to overall water uptake at low values of RH in mixed organic-inorganic particles. At high RH, on the other hand, organ-ics tend to take up significantly less water than the inorganic constituents with which they co-exist in ambient particles. Therefore, at RH values above the inorganic RHD, organics appear to suppress water uptake relative to that which a pure inorganic particle would exhibit.
Table 4.GF results for below, above, free troposphere (FT), and ship plume measurements.
150 nm
Flight Below Above FT Ship Plume
74% 85% 92% 74% 85% 92% 74% 85% 92% 74% 85% 92%
7 1.40±0.04 1.57±0.03 1.82±0.05 1.26±0.06 1.55±0.04 1.78±0.01 1.40±0.03 1.55±0.03 1.84±0.04
10 1.42±0.04 1.60±0.06 1.80±0.04 1.37±0.10 1.57±0.04 1.71±0.11 1.42±0.03 1.56±0.04 1.70±0.07 1.42±0.04 1.62±0.03 1.78±0.04 11 1.44±0.05 1.61±0.06 1.80±0.07 1.40±0.07 1.51±0.02 1.64±0.05 1.38±0.07 1.52±0.06 1.65±0.10
12 1.38±0.03 1.58±0.03 1.63±0.04 1.34±0.04 1.51±0.03 1.55±0.01 1.38±0.02 1.60±0.01 1.63±0.01 13 1.39±0.01 1.61±0.05 1.82±0.02 1.35±0.01 1.61±0.03 1.75±0.05 1.27±0.05 1.49±0.07 1.61±0.08 14 1.36±0.05 1.65±0.21 1.82±0.14 1.39±0.02 1.62±0.01 1.87±0.09 1.37±0.03 1.60±0.03 1.77±0.06
16 1.41±0.02 1.58±0.05 1.64±0.08 1.33±0.03 1.52±0.03 1.54±0.03 1.29±0.04 1.49±0.07 1.52±0.06 1.38±0.02 1.59±0.02 1.61±0.04
175 nm
Flight Below Above FT Ship Plume
74% 85% 92% 74% 85% 92% 74% 85% 92% 74% 85% 92%
7 1.36±0.06 1.54±0.02 1.95±0.03 1.28±0.04 1.53±0.03 1.91±0.06 1.24±0.08 1.52±0.03 1.87±0.10
10 1.41±0.06 1.59±0.05 1.93±0.02 1.34±0.05 1.51±0.01 1.83±0.06 1.33±0.02 1.60±0.03 1.89±0.05 1.34±0.02 1.55±0.05 1.88±0.06 11 1.31±0.08 1.48±0.07 1.82±0.09 1.31±0.03 1.44±0.09 1.77±0.03 1.33±0.04 1.53±0.12 1.77±0.23
12 1.33±0.02 1.55±0.04 1.63±0.08 1.26±0.06 1.48±0.08 1.51±0.07 1.35±0.02 1.57±0.01 1.60±0.01
13 1.34±0.03 1.58±0.04 2.00±0.05 1.3 1.55 1.78 1.24±0.05 1.44±0.06 1.63±0.10
14 1.34±0.01 1.63±0.02 2.03±0.01 1.32±0.02 1.58±0.02 1.91±0.05 1.33±0.02 1.50±0.08 1.79±0.22
16 1.35±0.04 1.54±0.03 1.62±0.06 1.28±0.02 1.43±0.04 1.45±0.04 1.24±0.04 1.38±0.06 1.40±0.10 1.33±0.03 1.52±0.04 1.55±0.03
200 nm
Flight Below Above FT Ship Plume
74% 85% 92% 74% 85% 92% 74% 85% 92% 74% 85% 92%
7 1.37±0.04 1.57±0.03 1.98±0.03 1.22±0.06 1.56±0.05 1.92±0.01 1.21±0.01 1.54±0.08 1.91±0.04
10 1.41±0.09 1.72±0.09 2.01±0.05 1.33±0.02 1.57±0.07 1.87±0.04 1.35±0.01 1.63±0.06 1.93±0.06 1.33±0.04 1.66±0.06 1.95±0.05
11 1.25±0.11 1.45±0.17 1.86±0.07 1.26 1.47 1.83 1.36±0.16 1.56±0.15 1.89±0.20
12 1.33±0.03 1.64±0.03 1.73±0.05 1.29±0.03 1.48±0.10 1.55±0.12 1.37±0.05 1.64±0.05 1.69±0.04
13 1.36±0.05 1.68±0.05 2.01±0.04 1.3 1.61 1.85 1.21±0.08 1.45±0.07 1.78±0.12
14 1.42±0.11 1.65±0.05 1.98±0.10 1.31±0.05 1.60±0.03 1.96±0.01 1.35±0.09 1.59±0.10 1.89±0.11
16 1.35±0.02 1.59±0.05 1.77±0.08 1.26±0.02 1.45±0.08 1.53±0.10 1.23±0.06 1.40±0.10 1.40±0.11 1.33±0.03 1.62±0.04 1.66±0.06
50%≤RH≤94%. Note that the mixed OA/AS particle shows smooth growth with RH, as opposed to the deliquescent be-havior exhibited by the pure AS particle. The tendency of organics to retain water at low RH causes water uptake be-havior for the OA/AS particle to follow that of the descend-ing (i.e. efflorescence) branch of the pure AS growth curve. Since pure OA takes up less water at high RH than does pure AS, the growth curve for the OA/AS particle is suppressed, compared with that of pure AS. The overall result, as pre-dicted by thermodynamic theory, is that the presence of OA leads to enhanced water uptake at low RH and suppressed GF at high RH.
Virkkula et al. (1999) concluded that the most impor-tant factor contributing to GF suppression at high RH was the volume fraction of organic present in an aerosol. Oth-ers have suggested that the exact chemical identity of the organic constituents is not especially important, and that for an organic component classified as either oxidized or hydrocarbon-like, its relative abundance determines its effect on GF values (McFiggans et al., 2005; Moore and Raymond, 2008). The aerosol measured during MASE-II was com-prised of an internally-mixed combination of highly-oxidized organics with predominantly ammonium bisulfate in the size
range 150–200 nm. Results presented here from a stepwise linear regression on GF data from the marine atmosphere suggest that the single most important factor in predicting GF (aside from RH) is, indeed, VForganic. This suggests that an aerosol containing a uniform, highly-oxidized organic com-ponent may be sufficiently characterized in global models by a size distribution, RH, and a bulk estimate of the relative abundance of organics.
2.0
1.9
1.8
1.7
1.6
1.5
G
F
6 5
4 3
2 1
0
F light
7 10 11 12 13 14 16
Fig. 1. 92% GF values forDem,dry=200 nm particles are shown for below (black) and above (yellow) cloud flight legs. 48-h HYSPLIT
back-trajectories show airmass origin for each flight. Flights 12 and 16 show both suppressed GF values and continental, polluted airmass origin.
In most instruments that measure aerosol hygroscopicity, residence times for humidification are on the order of sec-onds; much longer than the equilibration time for most inor-ganics with water vapor. Sjogren et al. (2007) noted, how-ever, that particles with high volume fraction organic mate-rial may require as long as 40 s to achieve equilibrium with water vapor. If such long times are necessary to achieve equi-librium, hygroscopic measurement methods suitable for the field will tend to overpredict GF at low RH (water vapor does not evaporate completely from the particle during the drying process), while underpredicting GF at high RH (insufficient humidification time is provided for the organic fraction to achieve thermodynamic equilibrium with water vapor). In electrodynamic balance (EDB, Cohen et al., 1987a,b,c) stud-ies, suspended particles are subjected to extended exposure to water vapor (minutes to hours), establishing equilibrium.
Some organics exhibit extremely high deliquescence rela-tive humidities (DRH) (e.g., oxalic acid), while others ex-hibit gradual hygroscopic growth at low RH and substantial growth at high RH (e.g., malonic acid) (Peng et al., 2001). It is possible, given the wide range of organic species in the atmosphere and correspondingly wide range of hygroscopic properties associated with those species, and the relatively short humidification times in the DASH-SP and other similar instruments, that the effects attributed to organics may reflect some kinetic instrumental limitations.
200 150 100 50 A lt it u d e ( m ) 2.0 1.9 1.8 1.7 1.6 1.5 G F 7a 7b 10a 10b 11 12a 12b 13 14 16a 16b
Fig. 2. Below- and above-cloud 92% GF values for Dem,dry
200vnm particles as a function of altitude, with lines connecting measurements made on the same ‘trip’ from bottom to top of cloud. Marker size is proportional to VForganic, and ranges from 0.10 to
0.90. “a” and “b” designate separate “trips” during the same flight.
2.0 1.8 1.6 1.4 1.2 1.0 M e a s u r e d G F 2.0 1.8 1.6 1.4 1.2 1.0
P redicted G F
R2= 0.78 74%
85% 92%
Fig. 3. Measured GF values versus volume-weighted predictions.
Markers are color-coded with RH, and marker size is proportional to VForganic(ranging from 0.10 to 0.90). The blue line represents
1:1. 2.0 1.8 1.6 1.4 1.2 1.0 M e a s u r e d G F 2.0 1.8 1.6 1.4 1.2 1.0
P redicted G F
R2= 0.77 74%
85% 92%
Fig. 4. Predictions of GF from the simplified parameterization.
Markers are color-coded with RH, and marker size is proportional to VForganic(ranging from 0.10 to 0.90). The blue line represents
1:1.
a supersaturated particle would exhibit gradual water uptake with increased relative humidity, even at RH lower than the RHD for the inorganic salt. Assuming deliquescent behavior of the inorganic salt (i.e. the inorganic fraction is crystalline at RH RHE), this enhanced water uptake at low RH would be attributed to solely the organic fraction, thereby leading to a potential overestimation in the organic GF.
2.0 1.8 1.6 1.4 1.2 1.0 G F 0.9 0.8 0.7 0.6 0.5 R H
(NH4)2SO4 effloresence Hydrophilic Organics,
from Peng et al. (2001)
Mixed Particle:
40% organic (NH4)2SO4
growth
Fig. 5. Comparison of growth curves for pure ammonium
sul-fate, pure hydrophilic organic, and mixed organic/inorganic parti-cles. Ammonium sulfate curves calculated from AIM (Clegg et al., 1998).
5 Conclusions
We report a hygroscopic closure study for the coastal Califor-nia aerosol, using size-resolved C-ToF-AMS chemical data coupled with highly time-resolved, multiple-RH hygroscop-icity measurements from the DASH-SP.
Airmasses originating from continental locations showed elevated organic loading, and correspond to significant GF suppression at high RH. More moderate GF suppression was measured at intermediate RH and no impact was ob-served at low RH. A comparison of above-cloud with below-cloud aerosol indicated that a slightly organic-enriched layer above cloud corresponded with suppressed GFs at high RH. A volume-weighted hygroscopic closure provided excellent agreement with measured GFs, and mission-averaged or-ganic GFs at 74, 85, and 92% were calculated to be 1.22, 1.45, and 1.48, respectively. These GF values are rela-tively high when compared with many previous estimations of organic GF, but agree well with values reported for di-carboxylic and multifunctional acids. These high organic GFs are indicative of the highly oxidized state of the aged organic fraction. A simplified parameterization for predict-ing GF was developed uspredict-ing a stepwise linear regression method. This parameterization is a function of only RH and VForganic, and explains only 1% less variability than does the volume-weighted chemical closure. These results may be more broadly applicable to similar coastal condi-tions, where some aged organics are present in an otherwise marine-influenced atmosphere.
measure-ments. The importance of simultaneous GF measurements at multiple RH values is demonstrated by a simplified pa-rameterization for predicting GF as a function of RH and VForganic; a result potentially important for efficiently rep-resenting aerosol-water interactions in global models.
Acknowledgements. This work was supported by the Office of Naval Research grant N00014-04-1-0118. We acknowledge the committed, meticulous work of the CIRPAS Twin Otter crew, especially pilot Mike Hubbell and copilot Chris McGuire.
Edited by: A. Nenes
References
Aiken, A. C., DeCarlo, P. F., Kroll, J., Worsnop, D., J.A., H., Docherty, K., Ulbrich, I., Mohr, C., Kimmel, J., Sueper, D., Sun, Y., Zhang, Q., Trimborn, A., Northway, M., Ziemann, P., Canagaratna, M., Onsach, T., Alfarra, M., Prevot, A., Dommen, J., Duplissy, J., Metzger, A., Baltensperger, U., and Jimenez, J. L.: O/C and OM/OC Ratios of Primary, Secondary, and Ambient Organic Aerosols with High-Resolution Time-of-Flight Aerosol Mass Spectrometry, Environ. Sci. Technol., 42, 4478– 4485, 2008.
Allan, J., Bower, K., Alfarra, M., Delia, A., Jimenez, J., Middle-brook, A., Drewnick, F., Onasch, T., Canagaratna, M., Jayne, J., and Worsnop, D.: Technical note: Extraction of Chemically Re-solved Mass Spectra from Aerodyne Aerosol Mass Spectrometer Data, J. Aerosol Sci., 35, 909–922, 2004.
Ansari, A. S. and Pandis, S. N.: Water absorption by secondary organic aerosol and its effect an inorganic aerosol behavior, En-viron. Sci. Technol., 34, 71–77, 2000.
Berg, O. H., Swietlicki, E., and Krejci, R.: Hygroscopic growth of aerosol particles in the marine boundary layer over the Pa-cific and Southern Oceans during the First Aerosol Characteriza-tion Experiment (ACE 1), J. Geophys. Res., 103, 16 535–16 545, 1998.
Carrico, C. M., Rood, M. J., and Ogren, J. A.: Aerosol light scatter-ing properties at Cape Grim, Tasmania, durscatter-ing the First Aerosol Characterization Experiment (ACE 1), J. Geophys. Res., 103, 16 565–16 574, 1998.
Carrico, C. M., Rood, M. J., Ogren, J. A., Neususs, C., Wieden-sohler, A., and Heintzenberg, J.: Aerosol optical properties at Sagres, Portugal during ACE-2, Tellus B, 52, 694–715, 2000. Choi, M. Y. and Chan, C. K.: Continuous measurements of the
wa-ter activities of aqueous droplets of wawa-ter-soluble organic com-pounds, J. Phys. Chem. A, 106, 4566–4572, 2002a.
Choi, M. Y. and Chan, C. K.: The effects of organic species on the hygroscopic behaviors of inorganic aerosols, Environ. Sci. Technol., 36, 2422–2428, 2002b.
Clegg, S. L. and Seinfeld, J. H.: Thermodynamic models of aque-ous solutions containing inorganic electrolytes and dicarboxylic acids at 298.15 K. 2. Systems including dissociation equilibria, J. Phys. Chem. A, 110, 5718–5734, 2006.
Clegg, S. L., Brimblecombe, P., and Wexler, A. S.: Thermodynamic model of the system H+−NH+4−SO42−−NO−3−H2O at
tropo-spheric temperatures, J. Phys. Chem. A, 102(12), 2137–2154, 1998.
Cocker, D. R., Clegg, S. L., Flagan, R. C., and Seinfeld, J. H.: The effect of water on gas-particle partitioning of secondary organic aerosol. Part I: alpha-pinene/ozone system, Atmos. Environ., 35, 6049–6072, 2001a.
Cocker, D. R., Mader, B. T., Kalberer, M., Flagan, R. C., and Seinfeld, J. H.: The effect of water on gas-particle parti-tioning of secondary organic aerosol: II. m-xylene and 1,3,5-trimethylbenzene photooxidation systems, Atmos. Environ., 35, 6073–6085, 2001b.
Cohen, M. D., Flagan, R. C., and Seinfeld, J. H.: Studies of concen-trated electrolyte-solutions using the electrodynamic balance. 1. Water activities for single-electrolyte solutions, J. Phys. Chem., 91, 4563–4574, 1987a.
Cohen, M. D., Flagan, R. C., and Seinfeld, J. H.: Studies of concen-trated electrolyte-solutions using the electrodynamic balance. 2. Water activities for mixed-electrolyte solutions, J. Phys. Chem., 91, 4575–4582, 1987b.
Cohen, M. D., Flagan, R. C., and Seinfeld, J. H.: Studies of concen-trated electrolyte-solutions using the electrodynamic balance. 3. Solute nucleation, J. Phys. Chem., 91, 4583–4590, 1987c. Cruz, C. N. and Pandis, S. N.: Deliquescence and hygroscopic
growth of mixed inorganic-organic atmospheric aerosol, Envi-ron. Sci. Technol., 34, 4313–4319, 2000.
DeCarlo, P., Slowik, J., Worsnop, D., Davidovits, P., and Jimenez, J.: Particle Morphology and Density Characterization by Com-bined Mobility and Aerodynamic Diameter Measurements. Part 1: Theory, Aerosol. Sci. Tech., 39, 1185–1205, 2004.
Dougle, P. G., Veefkind, J. P., and ten Brink, H. M.: Crystallisation of mixtures of ammonium nitrate, ammonium sulphate and soot, J. Aerosol Sci., 29, 375–386, 1998.
Drewnick, F., Jayne, J. T., Canagaratna, M., Worsnop, D. R., and Demerjian, K. L.: Measurement of ambient aerosol composition during the PMTACS-NY 2001 using an aerosol mass spectrom-eter. Part II: Chemically speciated mass distributions, Aerosol. Sci. Tech., 38, 104–117, suppl. 1, 2004a.
Drewnick, F., Schwab, J. J., Jayne, J. T., Canagaratna, M., Worsnop, D. R., and Demerjian, K. L.: Measurement of ambient aerosol composition during the PMTACS-NY 2001 using an aerosol mass spectrometer. Part I: Mass concentrations, Aerosol. Sci. Tech., 38, 92–103, suppl. 1, 2004b.
Duplissy, J., Gysel, M., Alfarra, M. R., Dommen, J., Metzger, A., Prevot, A. S. H., Weingartner, E., Laaksonen, A., Raatikainen, T., Good, N., Turner, S. F., McFiggans, G., and Baltensperger, U.: Cloud forming potential of secondary organic aerosol under near atmospheric conditions, Geophys. Res. Lett., 35, L03818, doi:10.1029/2007GL031075, 2008.
Gasso, S., Hegg, D. A., Covert, D. S., Collins, D., Noone, K. J., Os-trom, E., Schmid, B., Russell, P. B., Livingston, J. M., Durkee, P. A., and Jonsson, H.: Influence of humidity on the aerosol scat-tering coefficient and its effect on the upwelling radiance during ACE-2, Tellus B, 52(2), 546–567, 2000.
Gysel, M., Crosier, J., Topping, D. O., Whitehead, J. D., Bower, K. N., Cubison, M. J., Williams, P. I., Flynn, M. J., McFiggans, G. B., and Coe, H.: Closure study between chemical composition and hygroscopic growth of aerosol particles during TORCH2, Atmos. Chem. Phys., 7, 6131–6144, 2007,
http://www.atmos-chem-phys.net/7/6131/2007/.
AIChE J., 48, 1309–1316, 2002.
Hegg, D. A., Covert, D. S., Rood, M. J., and Hobbs, P. V.: Mea-surements of aerosol optical properties in marine air, J. Geophys. Res., 101, 12 893–12 903, 1996.
Hegg, D. A., Covert, D. S., Crahan, K., and Jonssen, H.: The depen-dence of aerosol light-scattering on RH over the Pacific Ocean, Geophys. Res. Lett., 29, 60–4, 2002.
Hegg, D. A., Covert, D. S., Crahan, K. K., Jonsson, H. H., and Liu, Y.: Measurements of aerosol size-resolved hygroscopicity at sub and supermicron sizes, Geophys. Res. Lett., 33, L21808, doi:10.1029/2006GL026747, 2006.
Huffman, J., Jayne, J., Drewnick, F., Aiken, A., Onasch, T., Worsnop, D., and Jimenez, J.: Design, modeling, optimization, and experimental tests of a particle beam width probe for the aerodyne aerosol mass spectrometer, J. Aerosol Sci., 38, 1143– 1163, 2005.
IPCC: Climate Change 2007: The Physical Science Basis. Con-tribution of Working Group I to the Fourth Assessment Report of the Intergovernmental Panel on Climate Change, Cambridge University Press, Cambridge, United Kingdom and New York, NY, USA, 153–180, 2007.
Kaku, K. C., Hegg, D. A., Covert, D. S., Santarpia, J. L., Jonsson, H., Buzorius, G., and Collins, D. R.: Organics in the Northeast-ern Pacific and their impacts on aerosol hygroscopicity in the subsaturated and supersaturated regimes, Atmos. Chem. Phys., 6, 4101–4115, 2006,
http://www.atmos-chem-phys.net/6/4101/2006/.
Kasten, F.: Visibility forecast in phase of pre-condensation, Tellus, 21(5), 631–635, 1969.
Kim, J., Yoon, S. C., Jefferson, A., and Kim, S. W.: Aerosol hy-groscopic properties during Asian dust, pollution, and biomass burning episodes at Gosan, Korea in April 2001, Atmos. Envi-ron., 40, 1550–1560, 2006.
Kondo, Y., Miyazaki, Y., Takegawa, N., Miyakawa, T., Weber, R. J., Jimenez, J. L., Zhang, Q., and Worsnop, D. R.: Oxygenated and water-soluble organic aerosols in Tokyo, J. Geophys. Res., 112, D01203, doi:10.1029/2006JD007056, 2007.
Kreisberg, N. M., Stolzenburg, M. R., Hering, S. V., Dick, W. D., and McMurry, P. H.: A new method for measuring the depen-dence of particle size distributions on relative humidity, with application to the Southeastern Aerosol and Visibility Study, J. Geophys. Res., 106, 14 935–14 949, 2001.
Lu, M. L., Conant, W. C., Jonsson, H. H., Varutbangkul, V., Flagan, R. C., and Seinfeld, J. H.: The Marine Stra-tus/Stratocumulus Experiment (MASE): Aerosol-cloud relation-ships in marine stratocumulus, J. Geophys. Res., 112, D10209, doi:10.1029/2006JD007985, 2007.
Magi, B. I. and Hobbs, P. V.: Effects of humidity on aerosols in southern Africa during the biomass burning season, J. Geophys. Res., 108, 8495, doi:10.1029/2002JD002144, 2003.
Malm, W. C., Day, D. E., Kreidenweis, S. M., Collett, J. L., Carrico, C., McMeeking, G., and Lee, T.: Hygroscopic properties of an organic-laden aerosol, Atmos. Environ., 39, 4969–4982, 2005. Massling, A., Leinert, S., Wiedensohler, A., and Covert, D.:
Hy-groscopic growth of sub-micrometer and one-micrometer aerosol particles measured during ACE-Asia, Atmos. Chem. Phys., 7, 3249–3259, 2007,
http://www.atmos-chem-phys.net/7/3249/2007/.
Massling, A., Wiedensohler, A., Busch, B., Neus¨uß, C., Quinn, P., Bates, T., and Covert, D.: Hygroscopic properties of different aerosol types over the Atlantic and Indian Oceans, Atmos. Chem. Phys., 3, 1377–1397, 2003,
http://www.atmos-chem-phys.net/3/1377/2003/.
McFiggans, G., Alfarra, M. R., Allan, J., Bower, K., Coe, H., Cu-bison, M., Topping, D., Williams, P., Decesari, S., Facchini, C., and Fuzzi, S.: Simplification of the representation of the organic component of atmospheric particulates, Faraday Discuss., 130, 341–362, 2005.
Moore, R. H. and Raymond, T. M.: HTDMA analysis of multicomponent dicarboxylic acid aerosols with comparison to UNIFAC and ZSR, J. Geophys. Res., 113, D04206, doi:10.1029/2007JD008660, 2008.
Murphy, S., Agrawal, H., Sorooshian, A., Padaro, L., Gates, H., Hersey, S., Welch, W., Jung, H., Miller, J., Cocker, D., Nenes, A., Jonsson, H., Flagan, R., and Seinfeld, J.: Comprehensive Si-multaneous Shipboard and Airborne Characterization of Exhaust from a Modern Container Ship at Sea, Environmen. Sci. Tech-nol., doi:10.1021/es802413j, published online: http://pubs.acs. org/doi/abs/10.1021/es802413j, 2009
Peng, C., Chan, M. N., and Chan, C. K.: The hygroscopic properties of dicarboxylic and multifunctional acids: Measurements and UNIFAC predictions, Environ. Sci. Technol., 35, 4495–4501, 2001.
Peng, C. G. and Chan, C. K.: The water cycles of water-soluble organic salts of atmospheric importance, Atmos. Environ., 35, 1183–1192, 2001.
Petters, M. D., Kreidenweis, S. M., Snider, J. R., Koehler, K. A., Wang, Q., Prenni, A. J., and Demott, P. J.: Cloud droplet acti-vation of polymerized organic aerosol, Tellus B, 58, 196–205, 2006.
Prenni, A. J., DeMott, P. J., Kreidenweis, S. M., Sherman, D. E., Russell, L. M., and Ming, Y.: The effects of low molecular weight dicarboxylic acids on cloud formation, J. Phys. Chem. A, 105, 11 240–11 248, 2001.
Prenni, A. J., De Mott, P. J., and Kreidenweis, S. M.: Water uptake of internally mixed particles containing ammonium sulfate and dicarboxylic acids, Atmos. Environ., 37, 4243–4251, 2003. Prenni, A. J., Petters, M. D., Kreidenweis, S. M., DeMott,
P. J., and Ziemann, P. J.: Cloud droplet activation of sec-ondary organic aerosol, J. Geophys. Res., 112, D10223, doi:10.1029/2006JD007963, 2007.
Rood, M. J., Larson, T. V., Covert, D. S., and Ahlquist, N. C.: Measurement of laboratory and ambient aerosols with temper-ature and humidity controlled nephlometry, Atmos. Environ., 19, 1181–1190, 1985.
Saathoff, H., Naumann, K. H., Schnaiter, M., Schock, W., Mohler, O., Schurath, U., Weingartner, E., Gysel, M., and Baltensperger, U.: Coating of soot and (NH4)2SO4 particles by ozonolysis
products of alpha-pinene, J. Aerosol Sci., 34, 1297–1321, 2003. Seinfeld, J. and Pandis, S.: Atmospheric Chemistry and Physics,
Wiley-Interscience, New York, NY, USA, 2nd edn., 2006. Sjogren, S., Gysel, M., Weingartner, E., Baltensperger, U., Cubison,
Sorooshian, A., Hersey, S., Brechtel, F., Corless, A., Flagan, R., and Seinfeld, J.: Rapid, Size-Resolved Aerosol Hygroscopic Growth Measurements: Differential Aerosol Sizing and Hygroscopicity Spectrometer Probe (DASH-SP), Aerosol. Sci. Tech., 42, 445– 464, 2008a.
Sorooshian, A., Murphy, S. M., Hersey, S., Gates, H., Padro, L. T., Nenes, A., Brechtel, F. J., Jonsson, H., Flagan, R. C., and Sein-feld, J. H.: Comprehensive airborne characterization of aerosol from a major bovine source, Atmos. Chem. Phys., 8, 5489–5520, 2008b.
Swietlicki, E., Zhou, J. C., Covert, D. S., Hameri, K., Busch, B., Vakeva, M., Dusek, U., Berg, O. H., Wiedensohler, A., Aalto, P., Makela, J., Martinsson, B. G., Papaspiropoulos, G., Mentes, B., Frank, G., and Stratmann, F.: Hygroscopic properties of aerosol particles in the northeastern Atlantic during ACE-2, Tellus B, 52, 201–227, 2000.
Tomlinson, J. M., Li, R. J., and Collins, D. R.: Physical and chem-ical properties of the aerosol within the southeastern Pacific ma-rine boundary layer, J. Geophys. Res., 112, 1–13, 2007. Topping, D. O., McFiggans, G. B., and Coe, H.: A curved
multi-component aerosol hygroscopicity model framework: Part 1 - In-organic compounds, Atmos. Chem. Phys., 5, 1205–1222, 2005a.
Topping, D. O., McFiggans, G. B., and Coe, H.: A curved multicomponent aerosol hygroscopicity model framework: Part 2 -Including organic compounds, Atmos. Chem. Phys., 5, 1223– 1242, 2005b.
Vakeva, M., Hameri, K., and Aalto, P. P.: Hygroscopic properties of nucleation mode and Aitken mode particles during nucleation bursts and in background air, J. Geophys. Res., 107(D19), PAR9-1-11, 2002.
Varutbangkul, V., Brechtel, F. J., Bahreini, R., Ng, N. L., Keywood, M. D., Kroll, J. H., Flagan, R. C., Seinfeld, J. H., Lee, A., and Goldstein, A. H.: Hygroscopicity of secondary organic aerosols formed by oxidation of cycloalkenes, monoterpenes, sesquiter-penes, and related compounds, Atmos. Chem. Phys., 6, 2367– 2388, 2006, http://www.atmos-chem-phys.net/6/2367/2006/. Virkkula, A., Van Dingenen, R., Raes, F., and Hjorth, J.:
Hygro-scopic properties of aerosol formed by oxidation of limonene, alpha-pinene, and beta-pinene, J. Geophys. Res., 104, 3569– 3579, 1999.