ACPD
8, 10531–10560, 2008Measurements of size-resolved hygroscopicity
D. A. Hegg et al.
Title Page
Abstract Introduction
Conclusions References
Tables Figures
◭ ◮
◭ ◮
Back Close
Full Screen / Esc
Printer-friendly Version
Interactive Discussion
Atmos. Chem. Phys. Discuss., 8, 10531–10560, 2008 www.atmos-chem-phys-discuss.net/8/10531/2008/ © Author(s) 2008. This work is distributed under the Creative Commons Attribution 3.0 License.
Atmospheric Chemistry and Physics Discussions
Measurements of size-resolved
hygroscopicity in the California coastal
zone
D. A. Hegg1, D. S. Covert1, and H. H. Jonsson2
1
Department of Atmospheric Sciences, University of Washington, Seattle, WA, USA
2
Meteorology Department, Naval Post Graduate School, Monterey, CA, USA Received: 26 February 2008 – Accepted: 7 May 2008 – Published: 3 June 2008 Correspondence to: D. A. Hegg (deanhegg@atmos.washington.edu)
ACPD
8, 10531–10560, 2008Measurements of size-resolved hygroscopicity
D. A. Hegg et al.
Title Page
Abstract Introduction
Conclusions References
Tables Figures
◭ ◮
◭ ◮
Back Close
Full Screen / Esc
Printer-friendly Version
Interactive Discussion Abstract
Aircraft – based measurements of aerosol hygroscopicity, both in the form of size-resolved, diameter growth factors and in the dependence of particle light scattering on relative humidity, are presented for the marine boundary layer of the southern California coastal zone. The chemical composition of the aerosol is collated with the hygroscop-5
icity data, both to examine the nature of aerosol aging and as input for receptor type modeling. The data suggest an increase in aerosol hygroscopicity with altitude, possi-bly associated with oxidation of organic films. The receptor modeling suggests three distinct aerosol types/sources for this venue: marine, biomass burning and pollution. Model output is used in regression analyses to derive a prognostic mixing rule for the 10
hygroscopicity of aerosol with these three sources.
1 Introduction
The facility with which atmospheric aerosols absorb water as a function of ambient rel-ative humidity (RH), called the aerosol hygroscopicity, is a very important aerosol char-acteristic, impacting the chemical reactivity of the aerosol, its ability to act as cloud con-15
densation nuclei (CCN) and direct aerosol radiative forcing in the atmosphere (Rossi, 2003; Rudich, 2003; Poschl et al., 2007; Gasparini et al., 2006; Charlson et al., 1992; Hegg et al., 1997). The well-known size dependence of aerosol composition, coupled with the dependence of hygroscopicity on composition, leads to a clear hygroscopicity size dependence in atmospheric aerosols, a dependence well documented at sub-20
micron sizes (cf., Swietlicki et al., 2000; Santarpia et al., 2004) but significantly less so at larger sizes (e.g., Hitzenberger et al., 1997; Kreisberg et al., 2001; Hegg et al., 2006).
Given this importance, it is scarcely surprising that a substantial research effort has been devoted to measuring and understanding the hygroscopicity of atmospheric 25
ACPD
8, 10531–10560, 2008Measurements of size-resolved hygroscopicity
D. A. Hegg et al.
Title Page
Abstract Introduction
Conclusions References
Tables Figures
◭ ◮
◭ ◮
Back Close
Full Screen / Esc
Printer-friendly Version
Interactive Discussion
above, the hygroscopicity of ambient aerosols larger than 1µm is poorly documented. Changes in aerosol hygroscopicity with aging, due primarily to chemical reaction, are far from well understood. More inclusively, understanding (in a prognostic sense) the manner in which different aerosol types, from different sources, combine to produce the overall hygroscopicity of the typically internally-mixed atmospheric aerosol is poorly un-5
derstood (i.e., a source budget for aerosol hygroscopicity is not yet in hand).
To address parts of this issue we have performed an aircraft-based experiment with the goals of better documenting the aerosol hygroscopicity, both in the form of diameter growth factors and the dependence of particle light scattering on RH, and of relating these properties to aerosol chemical composition. We present new data on aerosol hy-10
groscopicity, including size-resolved hygroscopicity up to a particle diameter of 3µm, in an important aerosol venue. We also analyze the sources of aerosol hygroscopic-ity using receptor modeling, and evaluate a particular methodology for combining the hygroscopicity of different aerosol types/sources to produce the overall aerosol hygro-scopicity.
15
2 Methodology
The central measurement in the analysis presented here is that of aerosol hygroscop-icity. This aerosol characteristic is measured via two techniques, utilizing two different instruments. The first such technique measures the size-resolved change in aerosol diameter with relative humidity using the Aerosol Hydration Spectrometer (AHS) de-20
scribed in Hegg et al. (2007). This instrument is essentially two optical particle coun-ters maintained at two distinct relative humidities (normally a nominal 45 and 85% RH). The measurements are converted to hygroscopic growth factors using the Descriptive Hygroscopic Growth Factor methodology of Nowak (2006) as described in Hegg et al. (2006, 2007). Since the AHS has a lower size limit of about 0.3µm diameter, it does 25
hygro-ACPD
8, 10531–10560, 2008Measurements of size-resolved hygroscopicity
D. A. Hegg et al.
Title Page
Abstract Introduction
Conclusions References
Tables Figures
◭ ◮
◭ ◮
Back Close
Full Screen / Esc
Printer-friendly Version
Interactive Discussion
scopicity on aerosol light scattering, we have therefore utilized a second technique and associated instrument to measure the RH dependent light scattering of the ambient aerosol. This instrument, a light-scattering humidigraph, uses three nephelometers to measure the light-scattering coefficient at three humidities, nominally 30, 60 and 85% RH (cf., Gasso et al., 2000; Hegg et al., 2003).
5
To characterize the chemical composition of the aerosol, filter sampling was em-ployed. By far the most prevalent technique was with 47 mm Teflo membrane filters with a 2µm pore size. On a few occasions, sufficient sampling time was available to collect size-resolved filter samples via 5 stage Micro Orifice Impactors (MOI) followed by a filter backup. The substrates for this type of sampling were Zefluor Teflon filters 10
(1µm pore size). All substrates were analyzed gravimetrically and then extracted in 10 ml of HPLC water. The extracts were then analyzed by standard IC for anions (both organic and inorganic), LC MS for carbohydrates, and ICP-OES for a suite of trace ele-ments (cf., Gao et al., 2002). Additionally, in order to quantify the concentration of black carbon present (important both optically and as an aerosol source tracer), we used a 15
three wavelength Particle Soot Absorption Photometer (PSAP) to measure the aerosol absorption coefficient (Virkula et al., 2005). We then employed a specific black car-bon absorption coefficient of 7 m2g−1 to convert the absorption to black carbon mass concentration (cf. Bond and Bergstrom, 2006).
The instruments described above were deployed from an airborne platform, the Cen-20
ter for Interdisciplinary Remotely Piloted Aircraft Studies (CIRPAS) Twin Otter research aircraft. This platform, and its associated facility instruments, has been described in a number of publications (e.g., Wang et al., 2002; Schmid et al., 2003; Hegg et al., 2005). More specific information will be related, as necessary, in the discussion.
The aerosol chemical composition can, of course, be used to evaluate possible 25
al-ACPD
8, 10531–10560, 2008Measurements of size-resolved hygroscopicity
D. A. Hegg et al.
Title Page
Abstract Introduction
Conclusions References
Tables Figures
◭ ◮
◭ ◮
Back Close
Full Screen / Esc
Printer-friendly Version
Interactive Discussion
ternative ANOVA techniques, namely, various forms of factor analysis. Specifically, we have used, in addition to the standard factor analysis with principal component ex-traction (cf., Gao et al., 2003), the EPA PMF 1.1 and UNMIX 2.3 models. These are operational, regulatory, receptor models used precisely to deconvolute aerosol sources when good source profiles are not available. Numerous examples of their application 5
to such issues are in the literature (e.g., Kim et al., 2004; Willis et al., 2001).
3 Venue
The measurements reported here were acquired during the CARMA-IV field campaign. The CARMA (Cloud-Aerosol Research in the Marine Atmosphere) Project has been an ongoing effort to elucidate both the direct and indirect effects of aerosols on marine 10
boundary layer structure and the radiative balance of the marine atmosphere. Our current specific goals (as per the above discussion) thus fit comfortably into the CARMA framework.
The venue for the CARMA measurements is the California coastal zone, extend-ing from 37.2 N Latitude to 34 N latitude and from the coastline to∼300 km offshore.
15
This location is well suited to the study goals for a number of reasons. It is one of the three most intensive stratocumulus areas in the world (Warren et al., 1988) and the clouds have been shown susceptible to both microphysical and radiative perturba-tion by aerosols (cf. Platnick and Twomey, 1994; Durkee et al., 2000 and references therein). Most relevant to the present study, it is also an area in which the aerosol is 20
impacted by a number of different sources, including biomass burning, pollution and the ocean surface. This leads to a wide range in both aerosol composition and other derivative properties, most relevantly for this study, the aerosol hygroscopicity. Airborne sampling was done throughout this region in the course of 15 flights conducted during August, 2007. Horizontal traverses of the MBL, typically at 30 m MSL and also 100– 25
ACPD
8, 10531–10560, 2008Measurements of size-resolved hygroscopicity
D. A. Hegg et al.
Title Page
Abstract Introduction
Conclusions References
Tables Figures
◭ ◮
◭ ◮
Back Close
Full Screen / Esc
Printer-friendly Version
Interactive Discussion 4 Results and discussion
4.1 Observed marine DHGF spectra
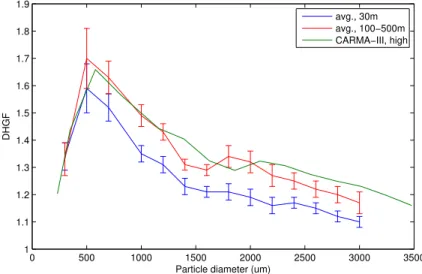
The DHGF spectra observed in the course of this study were, in general, quite similar to those we observed in this same venue during the CARMA-III measurement cam-paign in August of 2005 (Hegg et al., 2007). The average of marine spectra sampled 5
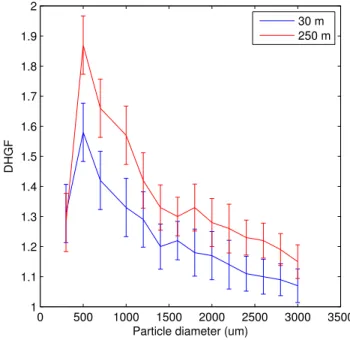
at 30 m MSL and in the range 100–500 m MSL from CARMA-IV are shown in Fig. 1. The higher-level average spectrum from CARMA-III is also shown for comparison. The magnitudes of the DHGF values are very similar for the two campaigns and, in both campaigns, the higher altitude spectra show more hygroscopicity, though the difference is significant over a broader range in the current data set. In particular, the super-10
micron hygroscopicity changes much more substantially with altitude in the CARMA-IV campaign. In assessing the CARMA-III data, we suggested two possible explanations for the increase in aerosol hygroscopicity with altitude, namely, oxidation of insoluble or-ganics or secondary production of soluble inoror-ganics. In the current data set, we have, in addition to the DHGF spectra themselves, some concurrent chemical composition 15
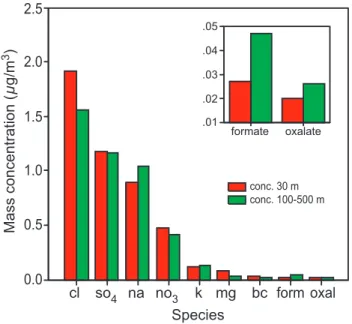
data to allow us to make at least a preliminary evaluation of these two possibilities. For the high and low altitude mean DHGF spectra shown in Fig. 1, concurrently sam-pled chemical composition data for soluble inorganics, formate and oxalate (black car-bon is also shown because of its optical significance) are shown in Fig. 2. The species shown are those with the highest measured concentrations, the residual species being 20
unlikely to influence the hygroscopicity significantly due to their relatively low concen-tration. While there are in fact some significant differences between the concentrations of the various species at the two altitudes, they are neither large nor systematic across species. Certainly the concentrations do not systematically increase with altitude. In accord with this, the mean soluble fraction of the aerosol, defined as the sum of all 25
measured soluble species divided by the gravimetric mass, actually undergoes a slight (and insignificant) decrease with altitude (i.e., 0.40±0.06 at the higher altitudes and
ACPD
8, 10531–10560, 2008Measurements of size-resolved hygroscopicity
D. A. Hegg et al.
Title Page
Abstract Introduction
Conclusions References
Tables Figures
◭ ◮
◭ ◮
Back Close
Full Screen / Esc
Printer-friendly Version
Interactive Discussion
associated with an increase in soluble inorganic salts such as sulfates receives little support here.
The alternative hypothesis, that of an oxidation of insoluble organics, perhaps in-cluding surface films, has no unequivocal supporting data either but there are some suggestive elements in the available data. As can be seen in the insert in Fig. 2, the 5
formate and oxalate concentrations at the higher altitudes are 75 and 20% higher than at 30 m MSL, respectively. Both species are breakdown products of the oxidation of or-ganics and oxalate, in particular, has been attributed to the breakdown of fatty acids in marine aerosol (e.g., Kawamura and Sakaguichi, 1999; Eliason et al., 2003; Turekian et al., 2003). Such fatty acids are known to coat marine aerosols (cf., Cini and Loglio, 10
1997; Mochida et al., 2002; Tervahattu et al., 2002) and have long been considered likely candidates to inhibit hygroscopic growth (cf., Gill et al., 1983; Ellison et al., 1999). Further support for this possible scenario is provided by the few instances in which con-ditions were favorable for sampling by MOI’s to acquire sized resolved chemical data congruent with the variation of DHGF’s with altitude in homogeneous marine boundary 15
layer air. Three such cases are available, all with winds uniformly from the Northwest with surface winds from 6–12 m s−1.
The first such case, flight 811 (flight numbers consist of the month and day of month, e.g., 811 would the flight on 11th August), shows a modest, relatively uniform increase in hygroscopicity over the entire size range at higher altitude but the accompanying 20
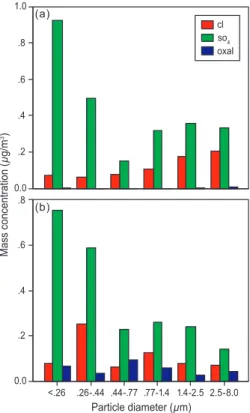
chemical change is dominated by the diminution of the super-micron salt mass with altitude accompanied by a relative increase in sub-micron sulfate (not shown). Flight 817 shows a more substantial increase in hygroscopicity, again uniform over most of the size range (DHGF spectra shown in Fig. 3) but now accompanied by a more in-teresting chemical change. The MOI-derived chemical size distributions for the two 25
ACPD
8, 10531–10560, 2008Measurements of size-resolved hygroscopicity
D. A. Hegg et al.
Title Page
Abstract Introduction
Conclusions References
Tables Figures
◭ ◮
◭ ◮
Back Close
Full Screen / Esc
Printer-friendly Version
Interactive Discussion
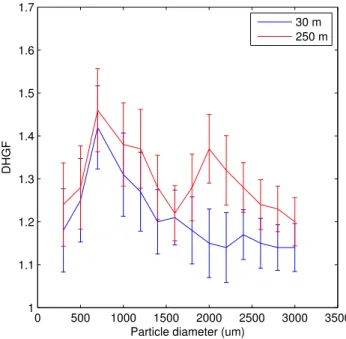
indeed, in the only portion of the size range for which the hygroscopicity change ex-ceeds the measurement uncertainty. The last case, flight 815, displays a somewhat more complex phenomenology. The DHGF spectra for this case are shown in Fig. 5. The hygroscopicity change is no longer uniform but shows a maximum peak in hygro-scopicity gain at 2µm. Overall, the change in hygroscopicity is most marked for the 5
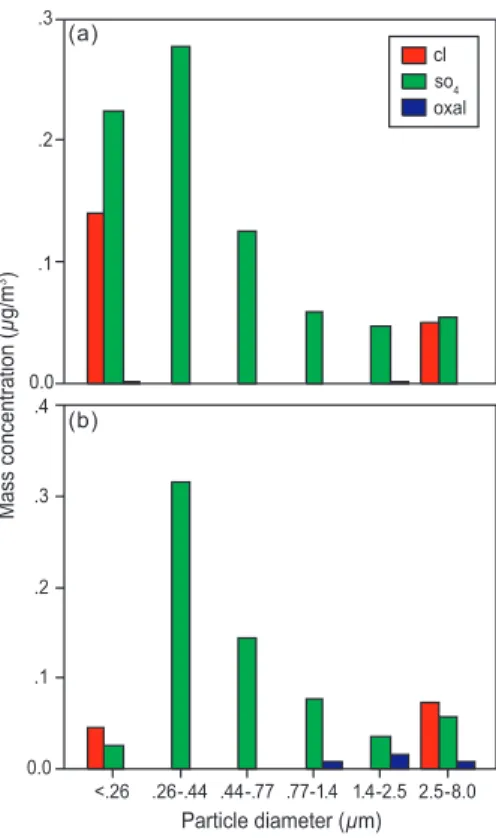
super-micron particles. Turning to the chemistry associated with these DHGF’s (shown in Fig. 6), there is again an increase in oxalate with altitude and again it is maximized in the size range where the hygroscopicity gain is the greatest (and once again where it is clearly significant), now the super-micron size range. It is important to note, when con-sidering this hypothesis, that very little oxalate, in an absolute sense, must be present 10
for it to be viable. Thin organic films require very little actual mass to coat the marine size distribution, less than 1% being typically necessary to achieve a significant impact (cf. Mochida et al., 2002) and the products of thin film oxidation need therefore only be present in similar abundances. While certainly not the only process occurring, these results do support the hypothesis that a significant portion of the increase in hygro-15
scopicity with altitude is associated with the oxidation of organic surface films on the marine aerosol.
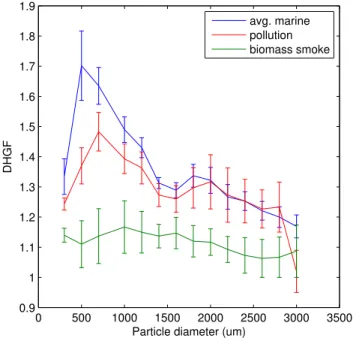
4.2 Observed pollution and biomass fire DHGF spectra
While low levels of pollution are commonplace in the study area, on several occasions more substantial pollution was observed, mostly associated with “Southern Surges”, 20
i.e., in-shore southerly flow extending up the California coast and advecting pollution from the urbanized Los Angeles basin. Furthermore, a very large and long-lived forest fire (the second largest in California history) took place during the study period and on a number of occasions the fire smoke haze was advected into our operational area. Mean DHGF spectra for clearly pollution and clearly biomass fire smoke cases (based 25
ACPD
8, 10531–10560, 2008Measurements of size-resolved hygroscopicity
D. A. Hegg et al.
Title Page
Abstract Introduction
Conclusions References
Tables Figures
◭ ◮
◭ ◮
Back Close
Full Screen / Esc
Printer-friendly Version
Interactive Discussion
different aerosol types is similar to that reported in Hegg et al. (2006) for CARMA-III but based on single examples. The pollution aerosol is somewhat less hygroscopic than the marine aerosol though now not significantly so above∼1µm. The fire smoke is
significantly lower in hygroscopicity than either polluted or marine aerosol over virtually all sizes but with notably less size dependence in the DHGF’s than the example in 5
Hegg et al. (2006) suggested.
Chemically, as expected, the biomass samples contained far more carbon than did either of the other categories. They also contained much more nitrate. The pollution samples, on the other hand, were distinguished by relatively high soluble lead levels. However, more detailed discussion of differing chemistries is addressed below within 10
the context of a broader issue: given that differing aerosol types are present, is it possible to predict how the hygroscopicities of these aerosol types would combine to produce an overall hygroscopicity of the aerosol at any particular locale? To address this issue, we first need a more quantitative assessment of aerosol sources.
4.3 Aerosol sources from receptor modeling 15
By far the longest established and most used technique for source attribution of at-mospheric constituents is the chemical mass balance model (e.g., Friedlander, 1973; Cheng and Hopke, 1989; Fujita et al., 1994; Hidy and Venkataraman, 1996). So long as one has good source profiles (i.e., the chemical composition of all possible sources is well known), this technique is indeed preferred to most others since it is a well-posed 20
mathematical problem with deterministic solution. However, quite commonly detailed source information is not available and one must then rely on various ANOVA tech-niques which utilize the internal variance of chemical compositions within a sample set to extract statistical source profiles which can then be used for source attribution. Perhaps the oldest such technique is factor analysis, generally with Principal Compo-25
ACPD
8, 10531–10560, 2008Measurements of size-resolved hygroscopicity
D. A. Hegg et al.
Title Page
Abstract Introduction
Conclusions References
Tables Figures
◭ ◮
◭ ◮
Back Close
Full Screen / Esc
Printer-friendly Version
Interactive Discussion
matrix inversion to yield more physically plausible solutions, and the UNMIX model of Henry and his colleagues (cf., Henry, 2005), which uses geometric-based tools to de-tect “edges” or sources in the multi-dimensional spatial distribution of species. For the data presented here, there are no true source profiles available and we therefore turn to the factorization methodologies just discussed. These approaches are sometimes 5
referred to as receptor modeling. Specifically, we use the operational EPA receptor models PMF 1.1 and UNMIX 2.3 to determine the source profiles and source contri-butions to each aerosol sample. Because the UNMIX model is better at objectively assessing the number of sources truly present, we rely on it most heavily.
The available data set consists of the concentrations of 18 chemical species ana-10
lyzed in each of 24 filter samples measured concurrently with a DHGF spectrum and a measure of the impact of RH on aerosol light scattering (the Kasten “gamma” pa-rameter; cf., Gasso et al., 2000). From these, several derivative variables such as non sea salt (NSS) sulfate and potassium, and water of hydration were calculated. On the other hand, several species were eliminated from use a priori due to a low incidence of 15
above detection limit concentrations – which led to a poor signal-to-noise ratio. Unfor-tunately, one such set of species was the carbohydrates, including levoglucosan. This species has been widely used as an excellent biomass burning tracer (cf., Simoneit et al., 1999; Gao et al., 2003) but was only present in seven of the samples in the data set. However, a correlation analysis between this species and several other plausible 20
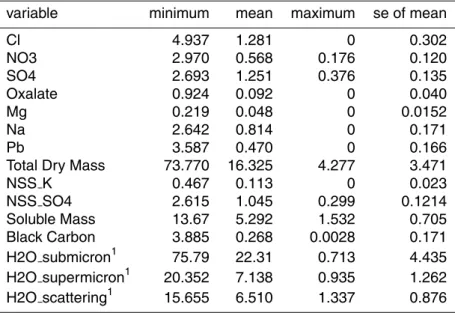
biomass burning tracers revealed excellent correlations (R2 for NSS K=0.97, for ox-alate=0.96, black carbon=0.98) that we utilize in interpreting the source profiles. The set of variables actually used in the variance analysis, together with descriptive statis-tics, is shown in Table 1. While both the PMF and UNMIX models were used on the data set, they gave essentially the same results and, in the interest of brevity, we will 25
deal solely with the UNMIX results from this point on.
ACPD
8, 10531–10560, 2008Measurements of size-resolved hygroscopicity
D. A. Hegg et al.
Title Page
Abstract Introduction
Conclusions References
Tables Figures
◭ ◮
◭ ◮
Back Close
Full Screen / Esc
Printer-friendly Version
Interactive Discussion
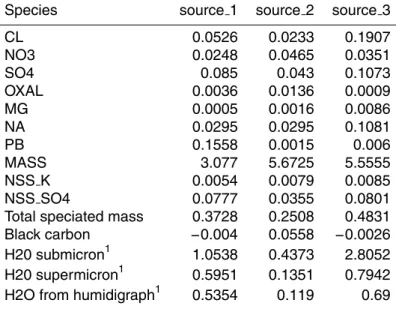
The source profiles derived by the model are shown in Table 2. We first note that the small negative loadings – which are of course not realistic – are well within the uncer-tainties in the loading variables (based on bootstrapping). Interpretation of the source profiles, i.e., source identification, can be problematic at times but in this instance is fairly straightforward. Source three is perhaps the easiest to identify. It contains the 5
highest loadings by far of both Cl and Na. These species are present, furthermore, in almost exactly the mass ratio found in sea water (Cl/Na=1.8). Hence, interpreta-tion of the factor or source as sea-salt aerosol is reasonably firm. The second source has a slightly less secure but nevertheless very credible interpretation. The loadings of both oxalate and black carbon are, again, by far the highest in this source and, as 10
discussed above, both are plausible biomass tracers. Surprisingly, the NSS K is not decisively partitioned into this source, as would be expected. On the other hand, nitrate is preferentially loaded, which is consistent with a biomass burning source. The most uncertain source to interpret is source one. The only truly distinguishing characteristic of this source profile is the overwhelming loading of soluble Pb. Since this is highly 15
characteristic of pollution aerosol, we feel justified in identifying this source as anthro-pogenic pollution. This source inventory is entirely consistent with what was known a priori about the potential sources for this operational area, as discussed above.
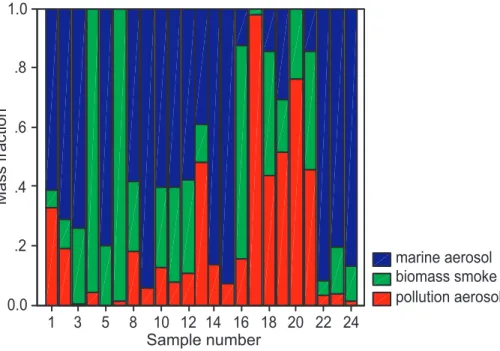
Having a plausible source inventory in hand, the next step in the receptor modeling exercise is to quantify the contribution of each source to each of the 24 samples in the 20
data base. This, of course, is done automatically by the UNMIX model and the model predicted source contributions are shown in Fig. 8. To facilitate later calculations, the contributions are shown as mass fractions of the total aerosol mass present. It can be seen that in about a third of the cases the aerosol is dominated by sea salt (i.e.,∼75%
of the mass is associated with the sea salt source). The two cases shown for which 25
ACPD
8, 10531–10560, 2008Measurements of size-resolved hygroscopicity
D. A. Hegg et al.
Title Page
Abstract Introduction
Conclusions References
Tables Figures
◭ ◮
◭ ◮
Back Close
Full Screen / Esc
Printer-friendly Version
Interactive Discussion
the fire column. Hence, the source attribution is broadly consistent with meteorological data for the fire source. Similarly, pollution aerosol was most evident for cases 17–21, corresponding to the samples taken offshore during 25th and 26th August, days during which southerly flow along the coast was present, advecting air from the polluted South Coast Air Basin.
5
4.4 Hygroscopicity mixing rule
Various approaches have been implemented to combine the contributions of different aerosol types into the overall aerosol hygroscopicity. For example, Gao et al. (2003) used tracers for several types and estimates of the growth factors associated with each type based on a literature survey. The type growth factors were then combined as a 10
weighted sum, the weighting being the tracer concentrations. A less ad hoc approach has been to use the well known Zdanovskii, Stokes and Robinson (ZSR) relationship, which essentially assumes that the water mass of hydration of a mixed aerosol particle is the linear sum of the water masses that would be associated with the masses of each chemical component of it, i.e., there are no interaction terms between different 15
solutes that impact the water activity (cf., Stokes and Robinson, 1966). This can be shown to lead to the following mixing rule for aerosol hygroscopic growth factors:
GFtot =
n
X
i
εiGFi(RH)3
!13
(1)
whereεi is the volume fraction of the ith component of the aerosol and GFi is the hy-groscopic growth factor for a given RH (or DHGF in our case) that would be associated 20
with a particle composed of the ith species alone (cf. Chen et al., 1973; Gysel et al., 2004).
ACPD
8, 10531–10560, 2008Measurements of size-resolved hygroscopicity
D. A. Hegg et al.
Title Page
Abstract Introduction
Conclusions References
Tables Figures
◭ ◮
◭ ◮
Back Close
Full Screen / Esc
Printer-friendly Version
Interactive Discussion
ology here but now using DHGF’s characteristic of the three aerosol types derived from our receptor model. To quantify these, we have averaged the measured values for cases that the receptor analysis itself has suggested were dominated by one of the aerosol types. Another simplification, to render comparison of predictions with mea-surements less unwieldy, has been to collapse the size dependent DHGF’s into two 5
values, one characteristic of the sub and one of the super-micron size range. For the sub-micron range, we have used the average of DHGF values from 0.3 to 0.7µm and for the super-micron range, DHGF’s over the range 1.8 to 2.2µm. We have, addition-ally, calculated a DHGF for particles in the effective light-scattering range based on the RH dependence of the aerosol light scattering as measured by the humidigraph. This 10
DHGF, while certainly related to the sub-micron DHGF measured by the AHS, is not identical to it and will vary with changes in the aerosol size distribution in the submicron range as well as with the corresponding chemistry. For the aerosol size distributions measured during this study, which have a significant portion below the 0.3µm lower limit of the AHS, differences in the two DHGF’s should be expected. Finally, the recep-15
tor modeling output for the contribution of the various sources to individual samples is in units of mass per unit volume of air. From this, mass fractions of the components were easily calculable (cf., Fig. 8). We have assumed that the density differences be-tween the different aerosol types are relatively slight and that the mass fractions can be used as volume fractions in Eq. (1).
20
With these assumptions, prognostic values for super and sub-micron DHGF’s, and for a “scattering” DHGF have been calculated and compared with the measurements. The regression analysis for the sub-micron range is shown in Fig. 9. The agreement, while not truly impressive, is quite reasonable, with an R2 value of 0.64, significant at>99.9% level. Similarly, the predicted and measured “scattering” DHGF’s have a 25
reasonableR2 value of 0.56. These values are quite comparable to those found for the use of the ZSR mixing rule with laboratory derived values of growth factors for pure species (Aklilu et al., 2006; Gysel et al., 2006). On the other hand, the regressionR2
ACPD
8, 10531–10560, 2008Measurements of size-resolved hygroscopicity
D. A. Hegg et al.
Title Page
Abstract Introduction
Conclusions References
Tables Figures
◭ ◮
◭ ◮
Back Close
Full Screen / Esc
Printer-friendly Version
Interactive Discussion
the ZSR mixing rule. A rationalization for this discrepancy is not difficult to find. The mass size distribution for the data set we have employed (based on the MOI samples collected), peaks in the 0.26 to 0.44µm size range. Since the filter data used for the chemical composition of course yield bulk composition, that data is most characteristic of this size range – the size range for the sub-micron DHGF’s. The scattering by the 5
particles will also be heavily influenced by particles in this size range, which falls in the effective Mie scattering range (cf., Yuen et al., 1994). On the other hand, the super-micron composition can, in general, be poorly represented by the bulk composition data and the source attribution for the bulk mass therefore not representative of that for the super-micron aerosol.
10
5 Conclusions
Measurements of the hygroscopic growth of ambient aerosols offthe central California coast are broadly consistent with previous measurements in the same area, both with respect to the most common marine aerosol and to that of the other aerosol types that commonly are present here, pollution and biomass smoke. The measured DHGF spec-15
tra in a well-mixed, marine MBL consistently exhibited more hygroscopicity at higher altitudes. Concurrent measurements of the aerosol chemical composition suggest that is unlikely to be due to secondary production of soluble inorganic mass (e.g., sulfate) but could plausibly be attributed to the oxidation of organic surface films as per the hypothesis of Ellison et al. (1999).
20
A receptor modeling exercise was carried out in order to quantitatively assess the im-pact of different aerosol types/sources on the aerosol hygroscopicity in the study area. Both the EPA PMF 1.1 and UNMIX 2.3 models were utilized. The results indicated, as expected, that the composition of the aerosol was dominated by three aerosol types, marine, biomass smoke and pollution. Model predictions of the contribution of these 25
ACPD
8, 10531–10560, 2008Measurements of size-resolved hygroscopicity
D. A. Hegg et al.
Title Page
Abstract Introduction
Conclusions References
Tables Figures
◭ ◮
◭ ◮
Back Close
Full Screen / Esc
Printer-friendly Version
Interactive Discussion
and “scattering” hygroscopicity, considerable prognostic power was demonstrated but not for the super-micron hygroscopicity. This can be attributed to the bulk chemistry used in the analysis, which would not, in general, be representative of the larger parti-cle composition. To address this flaw, size resolved chemical composition data would be necessary.
5
Acknowledgements. This research was supported by ONR grant N00014-07-1-0277. The
au-thors wish to thank Prof. Tim Larson for many valuable discussions. Back trajectories used in this study were calculated with HYSPLIT4 (HYbrid Single-Particle Lagrangian Integrated Trajectory) Model,1997. Web address: http://www.arl.noaa.gov/ready/hysplit4.html, NOAA Air Resources Laboratory, Silver Spring, MD.
10
References
Aklilu, Y., Mozurkewich, M., Prenni, A. J., Kreidenweis, S. M., Alfarra, M. R., Allan, J. D., Anlauf, K., Brook, J., Leaitch, W. R., Sharma, S., Boudries, H., and Worsnop, D. R.: Hygroscopicity of particles at two rural, urban influenced sites during Pacific 2001: comparison with estimates of water uptake from particle composition, Atmos. Environ., 40, 2650–2661, 2006.
15
Bond, T. C. and Bergstrom, R. W.: Light absorption by carbonaceous particles: an investigative review, Aerosol Sci. Technol., 40, 1–41, 2006.
Charlson, R. J., Schwartz, S. E., Hales, J. M., Cess, R. D., Coakley, J. A., Jr., Hansen, J. E., and Hoffmann, D. J. : Climate Forcing by Anthropogenic Aerosols, Science, 255, 423–430, 1992.
20
Chen, H., Sangster, J., Teng, T. T., and Lenzi, F.: General method of predicting water activity of ternary aqueous-solutions from binary data, Can. J. Chem. Eng., 51, 234–241, 1973. Cheng, M. D. and Hopke, P. K.: Identification of markers for chemical mass balance receptor
model, Atmos. Environ., 23, 1373–1384, 1989.
Cini, R. and Loglio, G.: Adsorption and pollutant transport by marine aerosol, Mar. Pollut. Bull., 25
34, 501–504, 1997.
ACPD
8, 10531–10560, 2008Measurements of size-resolved hygroscopicity
D. A. Hegg et al.
Title Page
Abstract Introduction
Conclusions References
Tables Figures
◭ ◮
◭ ◮
Back Close
Full Screen / Esc
Printer-friendly Version
Interactive Discussion
R., Flagan, R. C., Seinfeld, J. H., and Rand, H.: The Impact of Ship-Produced Aerosols on the Microstructure and Albedo of Warm Marine Stratocumulus Clouds. A Test of the MAST Hypothesis Li and Lii, J. Atmos. Sci., 57, 2554–2569, 2000.
Eliason, T. L., Gilman, J. B., and Vaida, V.: Oxidation of organic films relevant to atmospheric aerosols, Atmos. Environ., 38, 1367–1378, 2003.
5
Ellison, G. B., Tuck, A. F., and Vaida, V.: Atmospheric processing of organic aerosols, J. Geo-phys. Res., 104, 11 633–11 641, 1999.
Friedlander, S. K.: Chemical mass balances and identification of air pollution sources, Environ. Sci. Technol., 7, 235–240, 1973.
Fujita, E. M., Watson, J. C., Chow, J. C., and Lu, Z.: Validation of the chemical mass balance 10
receptor model applied to hydrocarbon source apportionment in the Southern California Air Quality Study, Environ. Sci. Technol., 28, 1633–1649, 1994.
Gao, S., Hegg, D. A., Covert, D. S., and Jonsson, H.: Aerosol chemistry, and light-scattering and hygroscopicity budgets during ACE-Asia, J. Geophys. Res., 46, 55–88, 2003.
Gasparini, R., Collins, D. R., Andrews, E., Sheridan, P. J., Ogren, J. A., and Hudson, J. 15
G.: Coupling aerosol size distributions and size-resolved hygroscopicity to predict humidity-dependent optical properties and cloud condensation nuclei spectra, J. Geophys. Res., 111, D05S13, doi:10.1029/2005JD006092, 2006.
Gass’o, S., Hegg, D. A., Covert, D. S., Collins, D., Noone, K. J., Ostron, E., Schmid, B., Russell, P. B., Livingston, J. M., Durkee, P. A., and Jonsson, H.: Influence of humidity on the aerosol 20
scattering coefficient and its effect on the upwelling radiance during ACE-2, Tellus, 52B, 546–567, 2000.
Gill, P. S., Graedel, T. E., and Weschler, C. J: Organic Films on Atmospheric Aerosol-Particles, Fog Droplets, Cloud Droplets, Raindrops, and Snowflakes, Rev. Geophys., 21, 903–920, 1983.
25
Gysel, M., Crosier, J., Topping, D. O., Whitehead, J. D., Bower, K. N., Cubison, M. J., Williams, P. I., Flynn, M. J., McFiggans, G. B. and Coe, H.: Closure between measured and mod-eled particle hygroscopic growth during TORCH2 implies ammonium nitrate artefact in the HTDMA measurements, Atmos. Chem. Phys. Discuss., 6, 12 503–12 548, 2006.
Gysel, M., Weingartner, E., Nyeki, S., Paulsen, D., Baltensperger, U., Galambos, I., and Kiss, 30
G.: Hygroscopic properties of water-soluble matter and humic-like organics in atmospheric fine aerosol, Atmos. Chem. Phys., 4, 35–50, 2004,
ACPD
8, 10531–10560, 2008Measurements of size-resolved hygroscopicity
D. A. Hegg et al.
Title Page
Abstract Introduction
Conclusions References
Tables Figures
◭ ◮
◭ ◮
Back Close
Full Screen / Esc
Printer-friendly Version
Interactive Discussion
Hegg, D. A., Covert, D. S., and Crahan, K.: The dependence of aerosol light-scattering on RH over the Pacific Ocean, Geophys. Res. Lett., 29, 1219, doi:10.1029/2001GL014495, 2002. Hegg, D. A., Covert, D. S., Crahan, K. K., Jonsson, H. H., and Liu, Y.: Measurements of the
Aerosol Size-Resolved Hygroscopicity at Sub and Supermicron Sizes, Geophys. Res. Lett., 33, L21808, doi:10.1029/2006GL026747, 2006.
5
Hegg, D. A., Covert, D. S., Jonsson, H., and Covert, P. A.: Determination of the transmission efficiency of an aircraft aerosol inlet, Aerosol Sci. Technol., 39, 966–971, 2005.
Hegg, D. A., Covert, D. S., Jonsson, H., and Covert, P. A.: An instrument for measuring size-resolved hygroscopicity at both sub- and super-micron sizes, Aerosol Sci. Technol., 41, 873– 883, 2007.
10
Hegg, D. A., Livingston, J., Hobbs, P., Novakov, T., and Russell, P.: Chemical apportionment of aerosol column optical depth offthe mid-Atlantic coast of the United States, J. Geophys. Res., 102, 25 293–25 303, 1997.
Henry, R. C.: Duality in multivariate receptor models, Chemom. Intell. Lab. Syst., 77, 59–63, 2005.
15
Hidy, G. M. and Venkataraman, C.: The chemical mass balance method for estimating atmo-spheric particle sources in Southern California, Chem. Eng. Comm., 151, 187–209, 1996. Hitzenberger, R., Berner, A, Dusek, U., and Alabashi, R.: Humidity-dependent growth of
size-segregated aerosol samples, Aerosol Sci. Technol., 27, 116–130, 1997.
Kawamura, K. and Sakaguchi, F.: Molecular distribution of water soluble dicarboxylic acids in 20
marine aerosols over the Pacific Ocean including the tropics, J. Geophys. Res., 104, 3501– 3509, 1999.
Kim, E., Hopke, P. K., Larson, T. V., and Covert, D. S.: Analysis of ambient particle size dis-tributions using unmix and positive matrix factorization, Environ. Sci Technol., 38, 202–209, 2004.
25
Kreisberg, N. M., Stolzenberg, M. R., Hering, S. V., Dick, W. D., and McMurry, P. H.: A New Method for Measuring the Dependence of Particle Size Distributions on Relative Humidity, with Application to Southeastern Aerosol and Visibility Study, J. Geophys. Res. D14, 14 935– 14 949, 2001.
Mochida, M., Kitamori, Y., and Kawamura, K.: Fatty acids in the marine atmosphere: factors 30
governing their concentrations and evaluation of organic films on sea-salt particles, J. Geo-phys. Res., 107, 4325, doi:10.1029/2001JD001278, 2002.
Bestim-ACPD
8, 10531–10560, 2008Measurements of size-resolved hygroscopicity
D. A. Hegg et al.
Title Page
Abstract Introduction
Conclusions References
Tables Figures
◭ ◮
◭ ◮
Back Close
Full Screen / Esc
Printer-friendly Version
Interactive Discussion
mung Von Partikelgroessenverteilung (<1µm) und Groessenaufgeloesten Hygroskopischen Wachsumsfaktoren Bei Definierten Luftfeuchten, Doctoral Thesis, Leibnitz Institute for Tro-pospheric Research, Permoserstr. 15, 04303, Leipzig, Germany, 2005.
Paatero, P. and Tapper, U.: Positive matrix factorization: a non-negative factor model with optimal utilization of error estimates of data values, Environmetrics, 5, 111–126, 1994. 5
Platnick, S., and Twomey, S.: Determining the Susceptibility of Cloud Albedo to Changes in Droplet Concentration with the Advanced very High- Resolution Radiometer, J. Appl. Meteor. 33, 334–347, 1994.
Poschl, U., Rudich, Y., and Ammann, M.: Kinetic model framework for aerosol and cloud sur-face chemistry and gas-particle interactions – Part I: General equations, parameters, and 10
terminology: Atmos. Chem. Phys., 7, 5989–6023, 2007,
http://www.atmos-chem-phys.net/7/5989/2007/.
Rossi, M. J.: Heterogeneous Reactions on Salts, Chem. Rev. 103, 4823–4882, 2003.
Rudich, Y.: Laboratory Perspectives on the Chemical Transformations of Organic Matter in Atmospheric Particles, Chem. Rev., 103, 5097–5124, 2003.
15
Santarpia, J. L., Runjun, L., and Collins, D. R.: Direct Measurement of the Hydration State of Ambient Aerosol Populations, J. Geophys. Res. 109, D18209, 2003.
Schmid, B., Hegg, D. A., Wang, J., Bates, D., Redemann, J., Russell, P. B., Livingston, J. M., Honsson, H. H., Welton, E. J., Seonfeld, J. H., Flagan, R. C., Covert, D. S., Dubovik, O., and Jefferson, A.: Column Closure Studies of the Lower Tropospheric Aerosol and Water Va-20
por during ACEAsia Using Airborne Sunphotometer, Airborne In-Situ and Ship-Based Lidar Measurements, J. Geophys. Res., 108, 8656, doi:10.1029/2002JD003361, 2003.
Simoneit, B. R. T., Schaur, J. J., Nolte, C. G., Oros, D. R., Elias, V. O., Naser, M. P., Rogge, W. J. and Cass, G. R.: Levoglucsan: a tracer for cellulose in biomass burning and atmospheric particles, Atmos. Environ., 33, 173–182, 1999.
25
Stokes, R. H. and Robinson, R. A.: Interactions in aqueous nonelectrolyte solutions. I. Solute-solvent equilibria, J. Phys. Chem., 70, 2126–2131, 1966.
Swietlicki, E., Zhou, J., Covert, D. S., Hameri, K., Busch, B.,Vakeva,M., Dusek, U., Berg, O. H., Widensohler, A., Aalto, P., Makela, J., Martinsson, B. G., Papaspiropoulos, G., Mentes, B., Frank, G., and Stratmann, F.: Hygroscopic Properties of Aerosol Particles in the Northeast-30
ern Atlantic during ACE-2, Tellus 52B, 201–227, 2000.
ACPD
8, 10531–10560, 2008Measurements of size-resolved hygroscopicity
D. A. Hegg et al.
Title Page
Abstract Introduction
Conclusions References
Tables Figures
◭ ◮
◭ ◮
Back Close
Full Screen / Esc
Printer-friendly Version
Interactive Discussion
Turekian, V. C., Macko, S. A., and Keene, W. C.: Concnetrations, isotopic compositions, and sources of size-resolved, particulate organic carbon and oxalate in near-surface marine air at Bermuda during spring, J. Geophy. Res., 108, 4157, doi:10.1029/2002JD002053, 2003. Virkkula, A., Ahlquist, N. N., Covert, D. S., Arnott, W. P., Sheridan, P. J., Quinn, P. K., and
Coffman, D. J.: Modification, calibration and a field test of an instrument for measuring light 5
absorption by particles, Aerosol Sci. Technol., 39, 68–83, 2005.
Wang, J., Flagan, R. C., Seinfeld, J. H., Jonsson, H. H., Collins, D. R., Russell, P. B., Schmid, B., Redemeann, J., Livingston, J. M., Gao, S., Hegg, D. A., Welton, E. J., and Bates, D.: Clear-Column Radiative Closure during ACE-Asia: Comparison of Multiwavelength Extinc-tion Derived from Particle size and ComposiExtinc-tion with Results from Sunphotometry, J. Geo-10
phys. Res., 107 (D23), 4688, doi:10.1029/2002JD002465, 2002.
Warren, S. G., Hahn, C. J., London, J., Chervin, R. M., and Jenne, R. L.: Global Distribu-tion of Total Cloud Cover and Cloud type Amounts Over the Ocean, NCAR Technical Note NCAR/TN-317+STR, 1988.
Willis, R. D., Ellenson, W. D., and Conner, T. L.: Monitoring and source apportionment of 15
particulate matter near a large phosphorous production facility, J. Air Waste Manage. Assoc., 51, 1142–1166, 2001.
ACPD
8, 10531–10560, 2008Measurements of size-resolved hygroscopicity
D. A. Hegg et al.
Title Page
Abstract Introduction
Conclusions References
Tables Figures
◭ ◮
◭ ◮
Back Close
Full Screen / Esc
Printer-friendly Version
Interactive Discussion
Table 1.The variables used in the receptor modeling analysis.
variable minimum mean maximum se of mean
Cl 4.937 1.281 0 0.302
NO3 2.970 0.568 0.176 0.120
SO4 2.693 1.251 0.376 0.135
Oxalate 0.924 0.092 0 0.040
Mg 0.219 0.048 0 0.0152
Na 2.642 0.814 0 0.171
Pb 3.587 0.470 0 0.166
Total Dry Mass 73.770 16.325 4.277 3.471
NSS K 0.467 0.113 0 0.023
NSS SO4 2.615 1.045 0.299 0.1214
Soluble Mass 13.67 5.292 1.532 0.705 Black Carbon 3.885 0.268 0.0028 0.171 H2O submicron1 75.79 22.31 0.713 4.435 H2O supermicron1 20.352 7.138 0.935 1.262 H2O scattering1 15.655 6.510 1.337 0.876
1
ACPD
8, 10531–10560, 2008Measurements of size-resolved hygroscopicity
D. A. Hegg et al.
Title Page
Abstract Introduction
Conclusions References
Tables Figures
◭ ◮
◭ ◮
Back Close
Full Screen / Esc
Printer-friendly Version
Interactive Discussion
Table 2. The source profiles (component loadings) derived from the UNMIX model. With the
exception of the mass normalization and hydration variable(s), the units are mass fractions.
Species source 1 source 2 source 3
CL 0.0526 0.0233 0.1907
NO3 0.0248 0.0465 0.0351
SO4 0.085 0.043 0.1073
OXAL 0.0036 0.0136 0.0009
MG 0.0005 0.0016 0.0086
NA 0.0295 0.0295 0.1081
PB 0.1558 0.0015 0.006
MASS 3.077 5.6725 5.5555
NSS K 0.0054 0.0079 0.0085
NSS SO4 0.0777 0.0355 0.0801
Total speciated mass 0.3728 0.2508 0.4831 Black carbon −0.004 0.0558 −0.0026 H20 submicron1 1.0538 0.4373 2.8052 H20 supermicron1 0.5951 0.1351 0.7942 H2O from humidigraph1 0.5354 0.119 0.69
1
ACPD
8, 10531–10560, 2008Measurements of size-resolved hygroscopicity
D. A. Hegg et al.
Title Page
Abstract Introduction
Conclusions References
Tables Figures
◭ ◮
◭ ◮
Back Close
Full Screen / Esc
Printer-friendly Version
Interactive Discussion
0 500 1000 1500 2000 2500 3000 3500
1 1.1 1.2 1.3 1.4 1.5 1.6 1.7 1.8 1.9
Particle diameter (um)
DHGF
avg., 30m avg., 100−500m CARMA−III, high
ACPD
8, 10531–10560, 2008Measurements of size-resolved hygroscopicity
D. A. Hegg et al.
Title Page
Abstract Introduction
Conclusions References
Tables Figures
◭ ◮
◭ ◮
Back Close
Full Screen / Esc
Printer-friendly Version
Interactive Discussion
Species
oxal form bc mg k no3 na so4 cl
Mass concentration (
µ
g/m
3)
2.5
2.0
1.5
1.0
0.5
0.0
oxalate formate
.05
.04
.03
.02
.01
conc. 30 m conc. 100-500 m
Fig. 2. Comparison of the mean chemical concentration of the dominant soluble chemical
ACPD
8, 10531–10560, 2008Measurements of size-resolved hygroscopicity
D. A. Hegg et al.
Title Page
Abstract Introduction
Conclusions References
Tables Figures
◭ ◮
◭ ◮
Back Close
Full Screen / Esc
Printer-friendly Version
Interactive Discussion 0 500 1000 1500 2000 2500 3000 3500
1 1.1 1.2 1.3 1.4 1.5 1.6 1.7 1.8 1.9 2
Particle diameter (um)
DHGF
30 m 250 m
ACPD
8, 10531–10560, 2008Measurements of size-resolved hygroscopicity
D. A. Hegg et al.
Title Page
Abstract Introduction
Conclusions References
Tables Figures
◭ ◮
◭ ◮
Back Close
Full Screen / Esc
Printer-friendly Version
Interactive Discussion
2.5-8.0 1.4-2.5 .77-1.4 .44-.77 .26-.44 <.26
Mass concentration (
µ
g/m
3) 1.0
.8
.6
.4
.2
0.0 .8
.6
.4
.2
0.0
Particle diameter (µm)
(b)
oxal
so4
cl
(a)
Fig. 4. (a)The chemical size distribution for 30 m altitude on Flt 817(b). The chemical size
ACPD
8, 10531–10560, 2008Measurements of size-resolved hygroscopicity
D. A. Hegg et al.
Title Page
Abstract Introduction
Conclusions References
Tables Figures
◭ ◮
◭ ◮
Back Close
Full Screen / Esc
Printer-friendly Version
Interactive Discussion 0 500 1000 1500 2000 2500 3000 3500
1 1.1 1.2 1.3 1.4 1.5 1.6 1.7
Particle diameter (um)
DHGF
30 m 250 m
ACPD
8, 10531–10560, 2008Measurements of size-resolved hygroscopicity
D. A. Hegg et al.
Title Page
Abstract Introduction
Conclusions References
Tables Figures
◭ ◮
◭ ◮
Back Close
Full Screen / Esc
Printer-friendly Version
Interactive Discussion
2.5-8.0 1.4-2.5 .77-1.4 .44-.77 .26-.44 <.26 .4
.3
.2
.1
0.0
Particle diameter (µm)
(b)
oxal
so4
cl
(a)
Mass concentration (
µ
g/m
3) .3
.2
.1
0.0
Fig. 6. (a)The chemical size distribution for an altitude of 30 m on Flight 815.(b)The chemical
ACPD
8, 10531–10560, 2008Measurements of size-resolved hygroscopicity
D. A. Hegg et al.
Title Page
Abstract Introduction
Conclusions References
Tables Figures
◭ ◮
◭ ◮
Back Close
Full Screen / Esc
Printer-friendly Version
Interactive Discussion 0 500 1000 1500 2000 2500 3000 3500
0.9 1 1.1 1.2 1.3 1.4 1.5 1.6 1.7 1.8 1.9
Particle diameter (um)
DHGF
avg. marine pollution biomass smoke
ACPD
8, 10531–10560, 2008Measurements of size-resolved hygroscopicity
D. A. Hegg et al.
Title Page
Abstract Introduction
Conclusions References
Tables Figures
◭ ◮
◭ ◮
Back Close
Full Screen / Esc
Printer-friendly Version
Interactive Discussion
Sample number
24 22 20 18 16 14 12 10 8 5 3 1
Mass fraction
1.0
.8
.6
.4
.2
0.0
marine aerosol biomass smoke pollution aerosol
Fig. 8. Mass fractions of each of the three aerosol types in the study area for each of the
ACPD
8, 10531–10560, 2008Measurements of size-resolved hygroscopicity
D. A. Hegg et al.
Title Page
Abstract Introduction
Conclusions References
Tables Figures
◭ ◮
◭ ◮
Back Close
Full Screen / Esc
Printer-friendly Version
Interactive Discussion
Predicted sub-micron DHGF
1.7 1.6 1.5 1.4 1.3 1.2 1.1 1.0
Measured sub-micron DHGF
2.0
1.8
1.6
1.4
1.2
1.0 Rsq = 0.6445
Fig. 9. Regression analysis of the predicted and measured sub-micron DHGF’s during the