BGD
9, 13627–13684, 2012
Climate, permafrost and land cover, Lena River Delta, Siberia
J. Boike et al.
Title Page
Abstract Introduction
Conclusions References
Tables Figures
◭ ◮
◭ ◮
Back Close
Full Screen / Esc
Printer-friendly Version Interactive Discussion
Discussion
P
a
per
|
Dis
cussion
P
a
per
|
Discussion
P
a
per
|
Discussio
n
P
a
per
|
Biogeosciences Discuss., 9, 13627–13684, 2012 www.biogeosciences-discuss.net/9/13627/2012/ doi:10.5194/bgd-9-13627-2012
© Author(s) 2012. CC Attribution 3.0 License.
Biogeosciences Discussions
This discussion paper is/has been under review for the journal Biogeosciences (BG). Please refer to the corresponding final paper in BG if available.
Baseline characteristics of climate,
permafrost, and land cover from a new
permafrost observatory in the Lena River
Delta, Siberia (1998–2011)
J. Boike1, B. Kattenstroth1, K. Abramova2, N. Bornemann1, A. Chetverova3,4, I. Fedorova3,4, K. Fr ¨ob1, M. Grigoriev5, M. Gr ¨uber1, L. Kutzbach6, M. Langer1, M. Minke7, S. Muster1, K. Piel1, E.-M. Pfeiffer6, G. Stoof1, S. Westermann8, K. Wischnewski1, C. Wille6, and H.-W. Hubberten1
1
Alfred Wegener Institute for Polar and Marine Research, Telegrafenberg A43, 14473 Potsdam, Germany
2
Lena Delta Nature Reserve, Tiksi, 678400, Yakutia, Russia
3
Arctic and Antarctic Research Institute, 38, Beringa str., St. Petersburg, 199397, Russia
4
Saint Petersburg State University, 33-35, 10 line, V.O., St. Petersburg, 199178, Russia
5
Melnikov Permafrost Institute, Siberian Branch, Russian Academy of Sciences, Yakutsk, Russia
6
University of Hamburg, KlimaCampus, Institute of Soil Science, Hamburg, Germany
7
BGD
9, 13627–13684, 2012
Climate, permafrost and land cover, Lena River Delta, Siberia
J. Boike et al.
Title Page
Abstract Introduction
Conclusions References
Tables Figures
◭ ◮
◭ ◮
Back Close
Full Screen / Esc
Printer-friendly Version Interactive Discussion
Discussion
P
a
per
|
Dis
cussion
P
a
per
|
Discussion
P
a
per
|
Discussio
n
P
a
per
8
Department of Geosciences, University of Oslo, Oslo, Norway
Received: 4 September 2012 – Accepted: 10 September 2012 – Published: 8 October 2012
Correspondence to: J. Boike (julia.boike@awi.de)
BGD
9, 13627–13684, 2012
Climate, permafrost and land cover, Lena River Delta, Siberia
J. Boike et al.
Title Page
Abstract Introduction
Conclusions References
Tables Figures
◭ ◮
◭ ◮
Back Close
Full Screen / Esc
Printer-friendly Version Interactive Discussion
Discussion
P
a
per
|
Dis
cussion
P
a
per
|
Discussion
P
a
per
|
Discussio
n
P
a
per
|
Abstract
Samoylov Island is centrally located within the Lena River Delta at 72◦N, 126◦E and lies
within the Siberian zone of continuous permafrost. The landscape on Samoylov Island consists mainly of late Holocene river terraces with polygonal tundra, ponds and lakes, and an active floodplain. The island has been the focus of numerous multidisciplinary 5
studies since 1993, which have focused on climate, land cover, ecology, hydrology, permafrost, and limnology. This paper aims to provide a framework for future studies by describing the characteristics of the island’s meteorological parameters (tempera-ture, radiation, and snow cover), soil tempera(tempera-ture, and soil moisture. The land surface characteristics have been described using high resolution aerial images in combination 10
with data from ground-based observations. Of note is that deeper permafrost
temper-atures have increased between 0.5 to 1◦C over the last five years. However, no clear
warming of air and active layer temperatures is detected since 1998, though winter air temperatures during recent years have not been as cold as in earlier years.
1 Introduction 15
Arctic regions present a number of unique features whose influences on ecological pro-cesses remain inadequately understood. These features include continuously frozen ground (permafrost), extensive wetlands with shallow lakes and ponds, large seasonal variations in solar input, and a short growing season. Over the last century the average
surface temperature in the Arctic has increased by about 0.09◦C per decade, a rate
20
50 % greater than that observed over the Northern Hemisphere as a whole (ACIA, 2005; AMAP, 2011).
Arctic soils and peatlands act as large carbon stores but our understanding of
feed-back mechanisms provoked by rising temperatures and their effects on trace gases
remains limited. One current hypothesis is that a warming climate will result in hydro-25
BGD
9, 13627–13684, 2012
Climate, permafrost and land cover, Lena River Delta, Siberia
J. Boike et al.
Title Page
Abstract Introduction
Conclusions References
Tables Figures
◭ ◮
◭ ◮
Back Close
Full Screen / Esc
Printer-friendly Version Interactive Discussion
Discussion
P
a
per
|
Dis
cussion
P
a
per
|
Discussion
P
a
per
|
Discussio
n
P
a
per
more water, resulting in higher precipitation and increased runoff in rivers (Rawlins
et al., 2009a).
The thickness and areal distribution of permafrost are directly affected by snow and
vegetation cover, topography, bodies of water, the geothermal heat flux, and the air temperature. Predicting the sensitivity of permafrost to a warming climate is compli-5
cated by the complex interactions between the hydrology, the thermal regimes of the soil, and the vegetation, which can lead to both positive and negative feedbacks on permafrost. Shrub cover has been observed to reduce the mean annual permafrost
temperature by several degrees (Blok et al., 2010). This effect can be offset by an
increase in snow cover associated with increased shrub cover (Sturm et al., 2001) 10
that insulates the permafrost from cold winter temperatures (Blok et al., 2010). Overall changes in land cover, such as in the vegetation type and distribution or the areal extent
of water bodies and drainage systems, will affect the vertical and horizontal fluxes of
water, energy, and matter. Wetlands, ponds, and lakes are typical features of northern ecosystems and play an important role in both local and regional climate and hydrology 15
by regulating heat and water fluxes, as well as affecting the carbon cycle.
The area of investigation was on Samoylov Island, in the Lena River Delta of North-ern Siberia. The objective of this study was to outline the characteristics of this area over a period from 1998 to 2011, with respect to its climate, permafrost, active layer, land cover, and hydrology, using measurements recorded on site. The intention is to 20
provide a framework for current and future field studies and experimental research, aiming to monitor and predict future changes. Research in this area has been in progress since 1993, but initially only as a part of on-going Arctic research networks.
A large new research station offering a variety of facilities for the continuation of existing
research projects, as well as for new research projects, is currently being established 25
BGD
9, 13627–13684, 2012
Climate, permafrost and land cover, Lena River Delta, Siberia
J. Boike et al.
Title Page
Abstract Introduction
Conclusions References
Tables Figures
◭ ◮
◭ ◮
Back Close
Full Screen / Esc
Printer-friendly Version Interactive Discussion
Discussion
P
a
per
|
Dis
cussion
P
a
per
|
Discussion
P
a
per
|
Discussio
n
P
a
per
|
2 Site description and data collection facilities at the new Samoylov observatory
The Lena River Delta in Northern Yakutia is one of the largest deltas in the Arctic and its
catchment area (2 430 000 km2) is one of the largest in the whole of Eurasia (Costard
and Gautier, 2007). The Lena River distributes water and sediment in the four main 5
channels (Olenekskaya, Tumatskaya, Bykovskaya, Trofimovskaya) before discharging
in total about 30 km3 of water through the delta into the Arctic Ocean every year
(Fe-dorova et al., 2012), and its discharge has been observed to be increasing (Rawlins et al., 2009b).
The study area is located on Samoylov Island, one of the 1500 islands that make up 10
the Lena River Delta (Fig. 1). The island is located within one of the main river channels,
in the southern part of the delta (72◦22′N, 126◦28′E). Continuous permafrost underlies
the area to between about 400 and 600 m below surface (Yershov et al., 1991). The main features of the annual energy balance are low net radiation in the summer, higher atmospheric latent heat flux than sensible heat flux, and a large proportion of soil heat 15
flux (Boike et al., 2008; Kutzbach, 2006; Langer et al., 2011a, b). Previous research has focused on energy and carbon cycling (Abnizova et al., 2012; Knoblauch et al., 2008; Kutzbach et al., 2004, 2007; Liebner et al., 2011; Runkle et al., 2012; Sachs et al., 2008, 2010; Wille et al., 2008), ecosystem C modeling (Zhang et al., 2012), land cover classification (Muster et al., 2012; Schneider et al., 2009), spatial heterogeneity and 20
upscaling of land surface temperature (Langer et al., 2010), biological and paleoenvi-ronmental reconstruction (Wetterich et al., 2008), and the characteristics of microbial communities (Wagner et al., 2007, 2009).
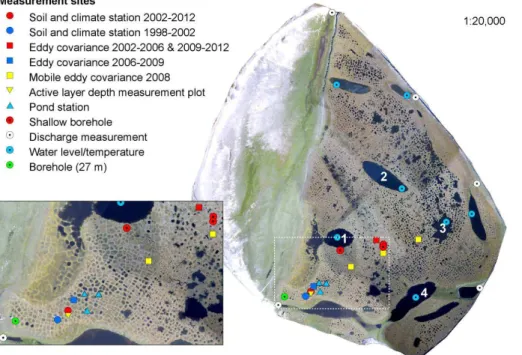
A photo-mosaic of Samoylov Island showing the locations of observation instruments is presented in Fig. 2. The climate data record (air temperature, radiation, humidity, 25
BGD
9, 13627–13684, 2012
Climate, permafrost and land cover, Lena River Delta, Siberia
J. Boike et al.
Title Page
Abstract Introduction
Conclusions References
Tables Figures
◭ ◮
◭ ◮
Back Close
Full Screen / Esc
Printer-friendly Version Interactive Discussion
Discussion
P
a
per
|
Dis
cussion
P
a
per
|
Discussion
P
a
per
|
Discussio
n
P
a
per
possible, been filled with data from temporary climate and eddy covariance stations located in close proximity of the weather station (Langer et al., 2011a, b).
The spatial distribution of snow cover was recorded with an automated camera and the snow depth recorded from measurements in the field. Manual data col-lection has included vegetation, snow, and soil surveys, as well as sampling, geo-5
morphological mapping, and aerial photography using balloons or blimps (Scheritz et al., 2008; Muster et al., 2012). Active layer thaw depth has been measured since 2002 on a 150 point grid, using a steel rod pushed vertically into the soil to the depth at which ice-bonded soil provides firm resistance (CALM Active Layer Protocol: http://www.udel.edu/Geography/calm/research/active layer.html).
10
A deep borehole was drilled into the permafrost during the spring of 2006 and a tem-perature sensor chain installed in August 2006, with 23 temtem-perature sensors down to a depth of 26.75 m (Fig. 2). The temperature sensor chain was inserted into a close-fitting PVC tube to allow reinstallation and recalibration of sensors. The absolute
accu-racy of the temperature sensors is (RBR Ltd.,±0.005◦C across the range from
−40◦C
15
to 35◦C). A second 5 cm (outside diameter) PVC tube was inserted into the borehole to
permit additional (geophysical) measurements to be made in the future. The remaining air space in the borehole was backfilled with dry sand.
An automated weather station (Campbell Scientific) measuring air temperature and net radiation was installed in 2006 within a 90 cm deep polygonal pond, together with 20
PT100 temperature sensors in the water and in the sediment.
In July 2009, water level and temperature sensors (HOBO Temp Pro v2, HOBO U20,
Onset, ±0.2◦C across a temp. range of 0◦C to 70◦C, and ±0.4◦C across a temp.
range of −40◦C to 0◦C) were installed within the water columns of several of the
thermokarst lakes on Samoylov Island. Temperature sensors were placed directly 25
BGD
9, 13627–13684, 2012
Climate, permafrost and land cover, Lena River Delta, Siberia
J. Boike et al.
Title Page
Abstract Introduction
Conclusions References
Tables Figures
◭ ◮
◭ ◮
Back Close
Full Screen / Esc
Printer-friendly Version Interactive Discussion
Discussion
P
a
per
|
Dis
cussion
P
a
per
|
Discussion
P
a
per
|
Discussio
n
P
a
per
|
3 Biosphere surface characteristics (vegetation and soil)
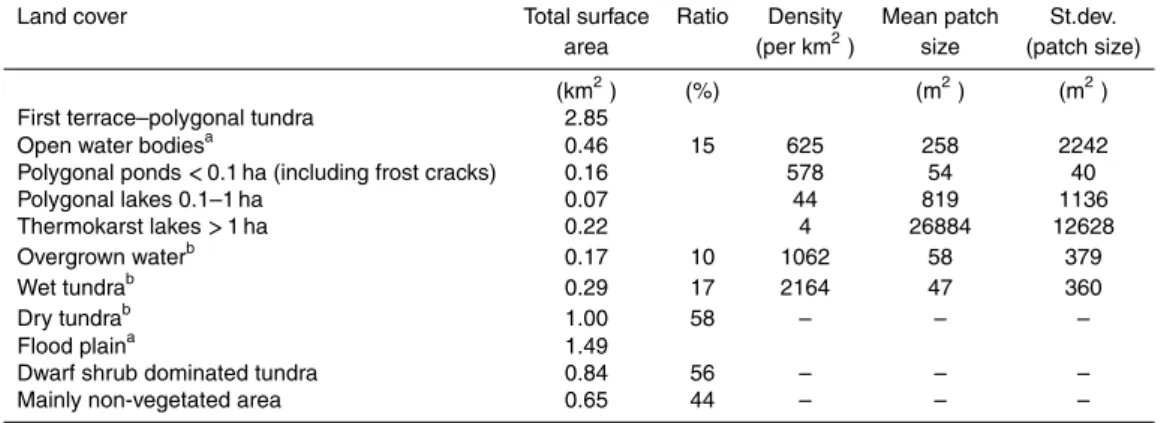
3.1 Land cover spatial statistics
Samoylov Island consists of a flood plain in the west, and an elevated river terrace in the east that is characterized by polygonal tundra. The polygonal tundra on Samoylov Island forms a highly fragmented land cover pattern consisting of dry polygonal ridges 5
with wet depressed centers to the polygons, as well as numerous larger water bodies (Fig. 3 and Table 1; Muster et al., 2012). We distinguish locally between “wet” and “dry”
tundra on the basis of differences in surface wetness (Muster et al., 2012). “Dry”
tun-dra conforms to the moist-herbaceous plant communities identified on the Circumpolar Arctic Vegetation Map (CAVM Team, 2003) and occurs on polygon ridges, well drained 10
plateaus, and elevated polygon centers, while “wet” tundra is found in depressed poly-gon centers, in water channels, and on collapsed ridges.
The patterned terrain consists predominantly of ice-wedge polygonal networks with depressed centers and thermokarst lakes (Fig. 3). The polygonal surface structure is due to the formation of ice-wedges below the soil’s surface. Because of the extreme 15
cold in winter months the frozen soil undergoes thermal contraction and, if the horizon-tal tension becomes too great, develops vertical cracks in a more or less regular pen-tagonal, hexagonal, or orthogonal network (Lachenbruch, 1962, 1966). These cracks broaden out to widths of several millimeters and range in depth from a few decimeters to several meters. Sublimating water vapor or infiltrating meltwater and rainwater can 20
lead to ice formation within the permafrost soil. During summer warming the frozen soil body tends to expand again, but the ice-wedges prevent horizontal expansion, result-ing in compression and plastic deformation (Mackay, 2000). The soil then bulges up next to the ice-wedges and the edges of the polygon are thus built up to form elevated rims. Cracks may again develop during subsequent winters in the vicinity of the original 25
BGD
9, 13627–13684, 2012
Climate, permafrost and land cover, Lena River Delta, Siberia
J. Boike et al.
Title Page
Abstract Introduction
Conclusions References
Tables Figures
◭ ◮
◭ ◮
Back Close
Full Screen / Esc
Printer-friendly Version Interactive Discussion
Discussion
P
a
per
|
Dis
cussion
P
a
per
|
Discussion
P
a
per
|
Discussio
n
P
a
per
Water surfaces are classified as either overgrown water, or open water with no veg-etation. Overgrown water is found in troughs above ice-wedges, in polygon centers with fluctuating water levels, and in the shallow parts of ponds and lakes. Water bodies are dominated numerically by the polygonal ponds, but dominated in area by the rel-atively few thermokarst lakes. Polygonal ponds (defined here as water bodies smaller 5
than 0.1 ha, including frost cracks) with a surface area between 0.003 and 0.1 ha are abundant in the ice-wedge polygonal tundra on Samoylov Island. Polygonal ponds con-tribute 35 % to the total water surface area. On average, there are 748 polygonal ponds per square kilometer in the study area (Table 1). Thermokarst lakes (defined here as larger than 1 ha) contribute about 49 % to the total water surface area. The polygonal 10
lakes (0.1–1 ha), including frost cracks, contributes only about 15 % to the total mapped water surface area and form less than 1 % of the total number of water bodies; they represent a transitional state between ponds and thermokarst lakes.
3.2 Vegetation
Between ten and twenty sampling points were selected for each of the ten land cover 15
classes on Samoylov Island, based on the land cover map of the Lena River Delta (Schneider et al., 2009), and located on the ground by GPS. The vegetation was mapped in June 2006 into coverage classes (after Braun-Blanquet, 1964), on
homoge-nous relev ´es of 25 to 100 m2. The nomenclature used follows Cherepanov (1995) for
vascular plants, Abramov and Volkova (1998) for mosses, Frahm and Frey (1992) for 20
liverwort, and Wirth (1995) for lichens. Non-hierarchical clustering of the relev ´es ac-cording to species cover was used to derive vegetation types, using the “K-means2” K-means partitioning program of Legendre (2001) and including the Hellinger transfor-mation (Legendre and Gallagher, 2001). This resulted in four main vegetation types: three on the first terrace and one on the flood plain.
25
Large parts of the flood plain are devoid of vegetation. The overgrown parts of
the flood plain are characterized by theSalix-Equisetum-Alopecurus alpinus
BGD
9, 13627–13684, 2012
Climate, permafrost and land cover, Lena River Delta, Siberia
J. Boike et al.
Title Page
Abstract Introduction
Conclusions References
Tables Figures
◭ ◮
◭ ◮
Back Close
Full Screen / Esc
Printer-friendly Version Interactive Discussion
Discussion
P
a
per
|
Dis
cussion
P
a
per
|
Discussion
P
a
per
|
Discussio
n
P
a
per
|
(Equisetum), Poaceae (Alopecurus alpinus, Festuca rubra, Deschampsia borealis) and
Tanacetum bipinnatum.While mosses are very rare on the floodplain, they form areas
of dense cover on the first terrace.
The dry tundra is dominated by the moss speciesHylocomium splendens, together
with Dryas punctata, Polygonum viviparum, Astragalus frigidus, with willow shrubs
5
(Salix glauca, S. lanataandS. reptans, S. reticulata), and lichens (Peltigera) belonging
to theHylocomium splendens-Dryas punctata-lichen community.
The vegetation of the wet tundra is made up of theDrepanocladus revolvens-Meesia
triquetra-Carex chordorrhiza community (i.e. the hydrophilic mosses Drepanocladus
revolvens,Meesia triquetra, andCalliergon giganteum), the sedgeCarex chordorrhiza,
10
marsh cinquefoil (Comarum palustre), sudetic lousewort (Pedicularis sudetica), and
others.
Carex concolor, together with the moss species Tomentypnum nitens,
Aulacom-nium palustre, and Aulacomnium turgidum, are very common in both the
Drepan-ocladus revolvens-Meesia triquetra-Carex chordorrhiza community of the wet tundra
15
and the Hylocomium splendens-Dryas punctata-lichen community of the dry tundra.
WhileCarex concolor is very tolerant with respect to water supply and has a high
pres-ence both in wet polygon depressions (97 %) and on dry polygon ridges (90 %), with coverage levels of 12 % and 4.4 % respectively, the previously mentioned moss species
(Tomentypnum nitens,Aulacomnium palustre, andAulacomnium turgidum)prefer
inter-20
mediate moisture conditions such as those found on hummocks in depressed polygon centers, or on the lower parts of ridge slopes. Minke et al. (2009) classified this inter-mediate zone as a separate vegetation community on the basis of micro-scale mapping
of low-centered polygons, but such differentiation would require much smaller relev ´es
of about 1 m2.
25
The fourth vegetation community on Samoylov consists almost entirely ofArctophila
BGD
9, 13627–13684, 2012
Climate, permafrost and land cover, Lena River Delta, Siberia
J. Boike et al.
Title Page
Abstract Introduction
Conclusions References
Tables Figures
◭ ◮
◭ ◮
Back Close
Full Screen / Esc
Printer-friendly Version Interactive Discussion
Discussion
P
a
per
|
Dis
cussion
P
a
per
|
Discussion
P
a
per
|
Discussio
n
P
a
per
3.3 Permafrost-affected soils
Most of the land surface area of Samoylov Island is covered by soils – as they are
defined under US Soil Taxonomy (Soil Survey Staff, 2010). Only the bare sediments
on the banks of the Lena River are considered to be non-soil, because spring flooding and erosion by water, ice, and wind prevent the formation of any soil or the establish-5
ment of vegetation. The soils of Samoylov Island are generally affected by the
subja-cent permafrost (as are probably most of the soils in the Lena River Delta), and are
therefore classified as Gelisols according to the US Soil Taxonomy. The soils on the
late-Holocene river terrace in the eastern part of the island and the modern floodplain
in the western part of the island have been affected by sustained fluvial and/or
aeo-10
lian sedimentation processes, which have led to a stratified soil structure that consists of alternating layers of sands and silts, with varying contents of autochthonous and heterochthonous organic matter.
Fluvial sedimentation is, of course, currently much more pronounced on the modern floodplain, while aeolian sedimentation occurs on both geomorphological units. The 15
grain size distribution of the sediments is dominated by sand and silt particle sizes, and the gravimetric clay content is typically below 15 % except in backswamp sedi-mentation situations. The floodplain is characterized by a variety of non-cryoturbated
permafrost-affected soils (Orthels) that differ in soil texture, water saturation, and the
amount of accumulated organic matter, depending on their situation within the flood-20
plain relief. Typic Psammorthels, which are Orthels with a high sand contents, low
organic matter contents, and low water tables, are found on natural levees formed by high-flood fluvial processes and have a covering of wind-blown sand (Sanders et al.,
2010).Orthels with finer textures, higher water tables, and different degrees of organic
matter accumulation, such asTypic AquorthelsandRuptic-Histic Aquorthels, are found
25
in lower-lying areas behind the levees.
The late-Holocene river terrace in the eastern part of Samoylov Island is, to a major
BGD
9, 13627–13684, 2012
Climate, permafrost and land cover, Lena River Delta, Siberia
J. Boike et al.
Title Page
Abstract Introduction
Conclusions References
Tables Figures
◭ ◮
◭ ◮
Back Close
Full Screen / Esc
Printer-friendly Version Interactive Discussion
Discussion
P
a
per
|
Dis
cussion
P
a
per
|
Discussion
P
a
per
|
Discussio
n
P
a
per
|
of this soil complex, which is very typical of polygonal tundra, have been described in detail by Becker et al. (1999), Fiedler et al. (2004), Kutzbach et al. (2004), Kutzbach
(2006), Sanders et al. (2010), and Zubrzycki et al. (2012a). The Glacic Aquiturbels
occur above the ice-wedges that develop below the elevated polygon rims. They are cryoturbated, mainly due to the on-going ice-wedge polygon morphodynamics. These 5
soils are characterized by oxidative conditions in the top 15–20 cm, and by high water contents and reductive conditions below. There is substantial peat accumulation on the slopes of the elevated polygon rims, but only a minor amount on the top of the rims. The
Typic Historthelsare located in the depressed polygon centers and are characterized
by water tables that fluctuate around the soil surface (roughly between 10 cm below and 10
above the soil surface), soil conditions that are already reductive in the uppermost soil horizons, and substantial peat accumulation. In some areas the relief of the low-center polygons is inverted due to erosion and thawing of the ice-wedges, forming high-center
polygons that are characterized by a soil complex ofTypic Aquiturbels (on the edges
of elevated polygon centers) andTypic Aquorthels (on the elevated polygon centers).
15
These soils still show redoximorphic features below 15–20 cm, but water levels are too
low for active peat accumulation.Typic Psammorthels and sand-richTypic Aquorthels
can also be found in areas of enhanced aeolian sand sedimentation near the scarps of the late-Holocene terrace (Sanders et al., 2010).
Typical soil profiles and selected properties of the active layer components of the 20
dominant soil types on Samoylov Island are compiled in Table 3, from previously pub-lished work. New detailed information on the bulk density, ice content, carbon content, and nitrogen content of the active-layer, and also of the upper part of the permanently frozen ground (from 29 soil cores from Samoylov Island), is presented in Zubrzycki et al. (2012b). The characteristics of the deeper sediments of the first terrace have 25
BGD
9, 13627–13684, 2012
Climate, permafrost and land cover, Lena River Delta, Siberia
J. Boike et al.
Title Page
Abstract Introduction
Conclusions References
Tables Figures
◭ ◮
◭ ◮
Back Close
Full Screen / Esc
Printer-friendly Version Interactive Discussion
Discussion
P
a
per
|
Dis
cussion
P
a
per
|
Discussion
P
a
per
|
Discussio
n
P
a
per
The composition of the soil determines its thermo-physical characteristics such as
its heat capacity (Ch) and thermal conductivity (Kh), which can vary markedly between
frozen and unfrozen conditions. The heat capacity was calculated from the mineral, or-ganic, and ice contents of the soil core, while the thermal conductivity was inferred from numerical heat transfer modeling and soil temperature records. Detailed descriptions 5
of the applied methods are given in Westermann et al. (2009), Langer et al. (2011a, b). Under thawed conditions, the active layer, tundra soils in wet polygonal
cen-tres had heat capacities of 3.4±0.5 MJ m−3K−1 and thermal conductivities of
0.60±0.17 W m−1K−1 (Langer et al., 2011a). Much lower values for C
h were found
on the dry ridges, which had heat capacities of 0.9±0.5 MJ m−3K−1under and thermal
10
conductivities of 0.14±0.08 W m−1K−1. For frozen conditions in the active layer, the
re-spective values were Ch=1.8±0.3 MJ m−3K−1and K
h=0.95±0.23 W m−
1
K−1 in wet
polygonal centers and Ch=0.7±0.3 MJ m−3K−1and K
h=0.46±0.25 W m−1K−1in the
dry ridges (Langer et al., 2011b). For perennially frozen permafrost soils, we obtained thermophysical properties from the soil composition of the 4 m core (Fig. 4) and the soil 15
temperature record of the 27 m borehole. The average heat capacity was found to be
2.9±0.05 MJ m−3K−1 and the average thermal conductivity was 1.9±0.4 W m−1K−1.
Both values are significantly higher than in the active layer which is explained by the higher mineral content.
4 Near-surface: climate and permafrost 20
4.1 Precipitation
4.1.1 Rainfall
BGD
9, 13627–13684, 2012
Climate, permafrost and land cover, Lena River Delta, Siberia
J. Boike et al.
Title Page
Abstract Introduction
Conclusions References
Tables Figures
◭ ◮
◭ ◮
Back Close
Full Screen / Esc
Printer-friendly Version Interactive Discussion
Discussion
P
a
per
|
Dis
cussion
P
a
per
|
Discussion
P
a
per
|
Discussio
n
P
a
per
|
2003 (Table 4), with a mean of about 125 mm. Seventy percent of the total rainfall events were light, with less than 1 mm of precipitation (a rainfall event comprises the
total precipitation during consecutive hours with rainfall>0; if there are less than three
hours without rain between two of these events, then these two events are treated as a single event). Only 1 % of the rainfall events recorded more than 16 mm, these 5
being classed as heavy precipitation events. These heavy precipitation events and their relative contributions to the total annual rainfall are presented in Table 4. In 2006 nearly one third of the total precipitation was contributed by just two individual events. In 2003 and 2004 three events contributed nearly half of the total rainfall.
10
4.1.2 Snow cover
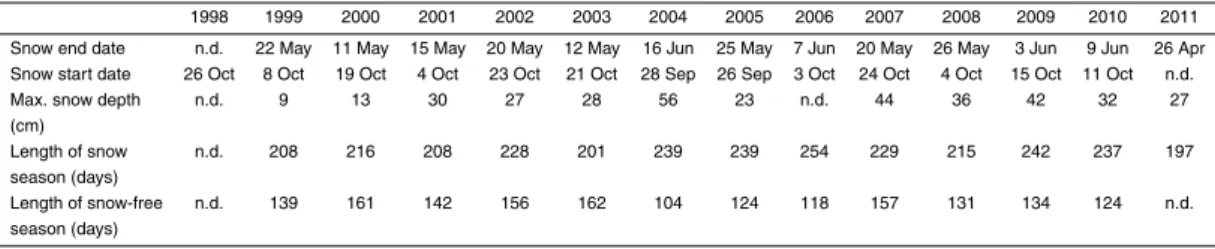
The snow depth shows a high degree of spatial variability. Strong winds redistribute the snow on the island, resulting in bare surfaces on the polygonal rims and polygonal centers filled with snow. The snow consists mainly of very loose, large-grained depth 15
hoar and hardened, sediment-rich layers (Boike et al., 2003). The polygonal micro-topography thus combines with the wind to redistribute the snow from the polygon rims towards their centers. During the period between August 1998 and August 2002, snow depth was measured on a polygon rim, after which the station was moved and the snow depth measured in a polygon center, where it was significantly greater (Table 5 20
and Fig. 5). During the spring 2008, the snow physical characteristics were examined at 216 sites (8 polygon) on the island (Fig. 5). The mean snow depth on the polygon rims was about 17 cm, and in the centers about 46 cm. The average snow density
was 195 kg m−3, ranging from 175 kg m−3to 225 kg m−3between rims and centers. The
total average Snow Water Equivalent (SWE) for the island was thus estimated to be 25
65 (±35) mm. Snow melt usually started in the second half of May and the snow cover
BGD
9, 13627–13684, 2012
Climate, permafrost and land cover, Lena River Delta, Siberia
J. Boike et al.
Title Page
Abstract Introduction
Conclusions References
Tables Figures
◭ ◮
◭ ◮
Back Close
Full Screen / Esc
Printer-friendly Version Interactive Discussion
Discussion
P
a
per
|
Dis
cussion
P
a
per
|
Discussion
P
a
per
|
Discussio
n
P
a
per
reached 56 cm, which was the greatest snow depth recorded. The snow-free period usually lasted until sometime in September. The dates for the disappearance of snow and for the renewal of snow accumulation are given in Table 5. The snow-free period was then calculated from these dates, as snow-free days.
In 2008, rainfall contributed 70 % to the total precipitation input and SWE less than 5
30 %.
4.2 Air temperature and radiation
The annual mean air temperature on Samoylov Island from 1998–2011 was−12.5◦C.
An analysis of the Samoylov Island air temperature data showed that January and
February were generally the coldest months, with mean temperatures of −30.3◦C
10
and−33.1◦C, respectively. The highest mean monthly temperatures occurred in July
(10.1◦C) and August (8.5◦C). Figure 6 illustrates the average yearly temperature
cy-cle, with monthly means and their standard deviations. Positive mean monthly temper-atures were recorded from June to August. Mean monthly tempertemper-atures for September were generally close to zero degrees, but were positive on average. With standard de-15
viations of about 3◦C from January to May, the air temperature variations were about
1◦C greater than from June to September (Fig. 6).
The mean annual net radiation was 18 W m−2, with positive mean monthly net
radi-ations recorded from May to September. June showed the highest net radiation, with
an average of about 120 W m−2. Figure 6 shows the high interannual variability in the
20
net radiation for May and June, which is due to variations in the timing of snow melt (Table 5).
The temporal record of air temperature and net radiation is shown in Fig. 7. No clear warming trend is visible, although winter temperatures during recent years have not been as cold as in earlier years. Of note is the very warm summer of 2010, where 25
mean air temperatures in July reached 15.4◦C concomitant with high net radiation
BGD
9, 13627–13684, 2012
Climate, permafrost and land cover, Lena River Delta, Siberia
J. Boike et al.
Title Page
Abstract Introduction
Conclusions References
Tables Figures
◭ ◮
◭ ◮
Back Close
Full Screen / Esc
Printer-friendly Version Interactive Discussion
Discussion
P
a
per
|
Dis
cussion
P
a
per
|
Discussion
P
a
per
|
Discussio
n
P
a
per
|
4.3 Thermal state of the permafrost and the active layer
The temperature of the permafrost has been recorded from a 27 m deep borehole since 2006. The annual average temperature of the active layer of the permafrost (0.03 m)
is−8.4◦C (Fig. 8a), which is about 3◦C warmer than the average air temperature over
the same period (−11.6◦C). At a depth of 1.7 m, (well below the active layer, which is
5
generally about 0.6 m deep), the average soil temperature is slightly higher (−7.8◦C),
but then decreases with depth to −8.6◦C at 10.7 m depth and −8.9◦C at depths of
20.7 m and 27 m (Fig. 8a).
The temperature of the uppermost soil layer ranged from about 20◦C to −35◦C in
2007. This fluctuation diminished rapidly with depth to only a few degrees at 10 m, and 10
was barely detectable below a depth of 20 m, where the annual temperature variation
was less than 0.1◦C.
Figure 8b shows the average, maximum, and minimum monthly soil temperatures at a depth of 0.21 m. The time series contains measurements from August 2002 to September 2011, obtained from a dry ridge site. February usually showed the lowest 15
soil temperatures, with a mean of−24.4◦C. The highest mean soil temperatures were
usually recorded in August, averaging 4.1◦C. The year to year variations in the mean
temperatures were within a range of 3.5◦C for the months of June through to October.
The variations were greater during the rest of the year, particularly during the cooling
of the soil in November and December, when variations of up to 10◦C have been
20
recorded.
Figure 9 illustrates the mean monthly temperatures in the subsurface (dry tundra site, polygon rim), measured from August 1998 to August 2011 close to the surface and at the active layer thaw depth of around 50 cm. The range between the highest summer
temperatures and the lowest winter temperatures can be more than 30◦C close to the
25
surface and more than 20◦C at a depth of around 50 cm.
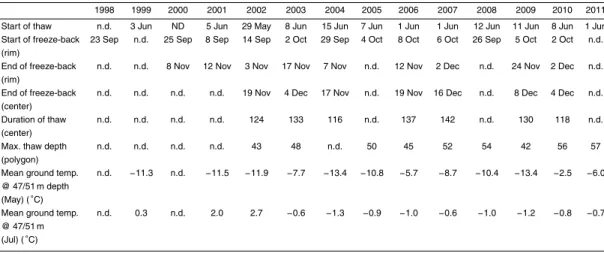
Table 6 provides an overview of thaw depths from 1998–2011. Autumnal isothermal
BGD
9, 13627–13684, 2012
Climate, permafrost and land cover, Lena River Delta, Siberia
J. Boike et al.
Title Page
Abstract Introduction
Conclusions References
Tables Figures
◭ ◮
◭ ◮
Back Close
Full Screen / Esc
Printer-friendly Version Interactive Discussion
Discussion
P
a
per
|
Dis
cussion
P
a
per
|
Discussion
P
a
per
|
Discussio
n
P
a
per
October and it usually took more than a month for the active layer to refreeze (end of freeze-back: Table 6), an exception being in 2002 when the freeze-back was very early. Due to the large latent heat content of the water-saturated wet tundra, the freeze-back takes up to 14 days longer in those areas than in the drier areas (Table 6).
Figure 10 shows the temperatures measured in the deep borehole since 2006, at 5
depths of 10.7 and 20.7 m. Since 2006, a warming has been detected of about 0.5◦C
at 20.7 m and almost 1◦C at 10.7 m.
4.4 Spatial variability of active layer thickness
The active layer, which is characterized by seasonal freezing and thawing, exhibits a large amount of spatial and temporal variability. The soil moisture characteristics at 10
the 150 sites from which measurements of the thaw depth have been taken (Sect. 2), have been qualitatively evaluated by Muster et al. (2012), resulting in 103 of the sites being classified as “dry tundra” and 47 as “wet tundra” (Fig. 11a, b).
Thawing of the soil usually started in early to mid-June. The wet tundra areas had a slightly greater mean thaw depth (19 cm) than the dry areas (15 cm) in June, but this 15
small difference was further reduced in the remaining months from July to September.
Maximum thaw depth was normally reached by August (Fig. 11c). The mean thaw depth was about 49 cm, with a maximum of 75 cm (dry) and 79 cm (wet). The highest thaw rates occurred in June and July when the net radiation input was at its greatest (Fig. 6), with only limited further thawing in August and early to mid-September. The 20
averaged values are generally very similar, but a high variability in thaw depth can be seen when the range of minimum and maximum values is considered. The statistics are, however, much the same for both dry and wet tundra, with similar means, similar thaw depths at the 25 and 75 % quantiles, and a large spread between minimum and maximum values.
BGD
9, 13627–13684, 2012
Climate, permafrost and land cover, Lena River Delta, Siberia
J. Boike et al.
Title Page
Abstract Introduction
Conclusions References
Tables Figures
◭ ◮
◭ ◮
Back Close
Full Screen / Esc
Printer-friendly Version Interactive Discussion
Discussion
P
a
per
|
Dis
cussion
P
a
per
|
Discussion
P
a
per
|
Discussio
n
P
a
per
|
5 Hydrosphere
5.1 Characteristics of water bodies
The thermal dynamics of those polygonal ponds and thermokarst lakes that are not flooded annually were evaluated for periods covering (i) the start of ice cover
formation (for ponds this is when the sensor’s temperature falls below 0◦C, and for
5
thermokarst lakes, where the uppermost sensor is usually well below the surface, the date chosen is the inferred start of stratification), (ii) frozen winter conditions (the date from which the lowermost sensor, which is generally at or close to the bottom,
records temperatures below 0◦C), (iii) ice break-up (from first ice melt to the complete
disappearance of ice, defined as starting when the uppermost sensor’s temperature 10
rises above 0◦C and sensors at depth show pronounced warming trends), and (iv)
stratification (when thermal layering is detectable from the temperature profile). Details are provided below over the 2010–2011 annual cycle for three polygonal ponds (“pond stations”; Fig. 2) and for four thermokarst lakes (Fig. 2).
15
Ponds
The shorelines of polygonal ponds are defined by ice-wedge structures and their profiles are u-shaped, with steep flanks and a flat bottom. The depths of the 103 ponds surveyed ranged from a few centimeters to 1.3 m. The surface of the ponds started to
freeze at the end of September (∼29 September in 2010; Fig. 12). During the winter
20
there was a clear temperature gradient from the surface to the bottom. In all three ponds the ice cover started to break up at the end of April, but they subsequently refroze as air temperatures again dropped below zero during May.
In general, all three ponds were well mixed during the summer months (June, July, and August). However, on a daily time scale (not shown) the lowermost sensors in the 25
shallower ponds (ponds 1 and 3) indicated a degree of stratification, i.e. they showed slightly colder temperatures than the sensors above. Maximum water temperatures
BGD
9, 13627–13684, 2012
Climate, permafrost and land cover, Lena River Delta, Siberia
J. Boike et al.
Title Page
Abstract Introduction
Conclusions References
Tables Figures
◭ ◮
◭ ◮
Back Close
Full Screen / Esc
Printer-friendly Version Interactive Discussion
Discussion
P
a
per
|
Dis
cussion
P
a
per
|
Discussion
P
a
per
|
Discussio
n
P
a
per
very quickly to subsequent cooling and were frozen to the bottom by mid-November
(by ∼15 November in 2010). Pond 2 took two months longer (until ∼20 January,
2011) for bottom temperatures to fall below zero. Differences between the ponds are
not only detectable during freeze-up of the ponds, but also during ice break-up. On 29 May, water temperatures in ponds 1 and 3 started to rise over the entire profile; 5
this occurred 7 days later in pond 2. The different dates could be due to bathymetric
differences between the ponds (ponds 1 and 3 have shallower and more irregular
profiles than pond 2), or to variations in the amount of vegetation present.
Thermokarst lakes 10
The shorelines of the shallow parts of thermokarst lakes (0–3 m depth) are very
irregular and feature protrusions of different shapes and sizes. When deeper sections
(>3 m) occur close to the shore, the shorelines are smooth and the lakes have an
oval shape. In contrast to ponds the bottoms of thermokarst lakes are not flat and the profiles are more v-shaped. The thermokarst lakes were up to 6.1 m deep.
15
Figure 13 summarizes the thermal records for three thermokarst lakes (lakes 1–3, Fig. 2) between August 2010 and August 2011. Lake 4 in Fig. 2 was excluded from the analysis since it is subject to annual flooding by the Lena River during the spring melt (Abramova et al., 2012). At the end of September, when the ice cover started to build up, the water columns in the three lakes were isothermal and cooled down to zero 20
degrees. Within the space of just a few days the water temperatures in the deeper parts of the lakes then started to increase and the water columns changed from isothermal to fully stratified. None of the three lakes froze to the bottom in winter. Stratification in lakes 1 and 2 was not restricted to the winter period, but also occurred in summer. While this only occurred for short periods in July in lake 2, it was the normal situation in lake 1, 25
which had only brief periods of full mixing. During the winter months the temperatures
were fairly stable, with a gradual cooling of 1◦C at all depths from October to
BGD
9, 13627–13684, 2012
Climate, permafrost and land cover, Lena River Delta, Siberia
J. Boike et al.
Title Page
Abstract Introduction
Conclusions References
Tables Figures
◭ ◮
◭ ◮
Back Close
Full Screen / Esc
Printer-friendly Version Interactive Discussion
Discussion
P
a
per
|
Dis
cussion
P
a
per
|
Discussion
P
a
per
|
Discussio
n
P
a
per
|
order approximation the ice was considered to have melted completely by the earliest date of complete mixing, which occurred in all three of the thermokarst lakes by mid to late June. Lake 3 did not develop any stratification during the summer because it is shallower than the other two lakes. Maximum water temperatures in the lakes during
summer 2011 ranged from about 16◦C to 19◦C (Table 7).
5
5.2 Water budget of the polygonal tundra
The water budget for the polygonal tundra of Samoylov Island consists of vertical inputs and outputs (precipitation and evapotranspiration), the storage of water in water bodies (lakes and ponds) and in the active layer of soils, and horizontal fluxes (surface and
subsurface runoff). Long-term moisture measurements for the active layer have been
10
recorded at a soil and climate station (Fig. 2) since 1998. The micro-topography of
the polygons had a strong effect on the spatial distribution pattern of soil moisture: the
polygon center was typically water saturated throughout the seasonal thaw period of the active layer, while the polygon rim was generally unsaturated to a depth of between 5 and 15 cm below the surface (further details available in Boike et al., 2008, 2012). 15
Measurements of water levels and horizontal fluxes were initiated in 2008. However, in this subsection we consider the water balance of the site within a longer term perspec-tive (1958 to 2011), using the understanding of processes obtained from detailed field investigations. In addition to micrometeorological measurements of evapotranspiration and precipitation (both liquid and solid), water budget measurements (including dis-20
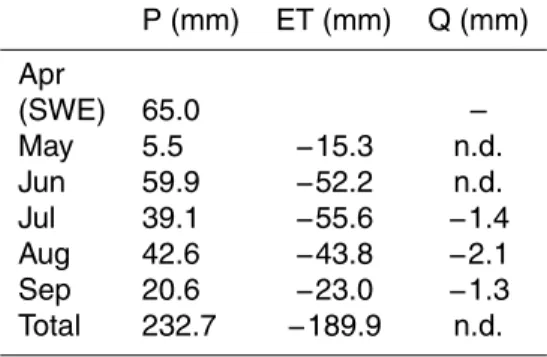
charge rates and water levels) were collected during 2008 (see Fig. 2 for measurement locations). The seasonal water budget estimate for Samoylov Island for 2008 showed
that losses through evapotranspiration (ET) were offset by similar inputs from
precipi-tation (P), resulting in a state of approximate equilibrium in the investigated water bod-ies (ponds and lakes) prior to freeze-back (Table 8). The evapotranspiration rates from 25
July to mid-September averaged about 1.3 mm day−1, with a maximum of 3.7 mm day−1
BGD
9, 13627–13684, 2012
Climate, permafrost and land cover, Lena River Delta, Siberia
J. Boike et al.
Title Page
Abstract Introduction
Conclusions References
Tables Figures
◭ ◮
◭ ◮
Back Close
Full Screen / Esc
Printer-friendly Version Interactive Discussion
Discussion
P
a
per
|
Dis
cussion
P
a
per
|
Discussion
P
a
per
|
Discussio
n
P
a
per
input of about 233 mm (65 mm SWE+168 mm rain) being greater than the losses due
to evapotranspiration (∼190 mm). The total snow water equivalent recorded in April
was about 65 mm and only 15 mm of this input was lost to evaporation in May
(Ta-ble 8). The summer rainfall (June–September) totaled ∼162 mm, the wettest month
being June (∼60 mm). The total runoff from the island during the summer was
negli-5
gible relative to the vertical fluxes (precipitation and evapotranspiration). However, it is
not possible to close the water balance since no runoffmeasurements exist from the
snow-melt period. The water balance is nevertheless dominated by precipitation and evapotranspiration, while lateral fluxes are less important.
The long-term water budget, i.e. precipitation minus evapotranspiration (P-ET), mod-10
elled for the Samoylov Island site since 1958, on the basis of ERA reanalysis data (ECMWF, http://www.ecmwf.int/), is shown in Fig. 14. Evapotranspiration was calcu-lated for the summer months (June to the end of September) using the Thornthwaite model (Thornthwaite, 1948). Since this model was originally designed for temperate climates and uses day length and air temperature as inputs, it potentially overesti-15
mates evapotranspiration since the length of a polar day is not taken into account. For Samoylov Island the model was calibrated over several years (2003–2009) using eddy covariance data obtained from the sites shown in Fig. 2, resulting in a Thornthwaite evapotranspiration correction factor of 0.35. The long-term water budget was roughly
balanced, tending towards positive values (P>ET, Fig. 14), which is in agreement with
20
the more detailed analysis from 2008. Furthermore, there is an agreement between the qualitative indicators of the water balance determined from aerial images (visualized qualitatively as the “fill” status of the ponds and lakes), and the modelled (P-ET) water balance.
The CORONA satellite image from 1968 indicates a drier tundra landscape with 25
BGD
9, 13627–13684, 2012
Climate, permafrost and land cover, Lena River Delta, Siberia
J. Boike et al.
Title Page
Abstract Introduction
Conclusions References
Tables Figures
◭ ◮
◭ ◮
Back Close
Full Screen / Esc
Printer-friendly Version Interactive Discussion
Discussion
P
a
per
|
Dis
cussion
P
a
per
|
Discussion
P
a
per
|
Discussio
n
P
a
per
|
represent normal years with positive water balances (P>ET), whereas the dry year
in 1968 (P<ET) is atypical (Fig. 14). This is in agreement with the modelled negative
water balance, and is a consequence of reduced precipitation. Field observations from 1999 also indicated a dry tundra during that year. From June to August 1999, the water level in the center of the monitored polygon center fell by total of 15 cm (from 10 cm 5
above the ground surface to 5 cm below the ground surface) due to the negative water balance that resulted from only 56 mm of rainfall input and a loss of 170 mm through evapotranspiration (Boike et al., 2008). Rainfall of about 22 mm in September at least partly refilled the active layer storage prior to freeze-back.
6 Discussion: how does this site compare with other continuous permafrost 10
sites in the Arctic tundra?
6.1 Land cover classification, vegetation, and soils
The polygonal tundra on Samoylov Island lies in ice-rich permafrost terrain that is characterized by ubiquitous water bodies. Similar wetland landscapes cover large areas in the Arctic coastal plains of Alaska, the Canadian Mackenzie delta, and the 15
low-lying wetlands of Northern Siberia (Mackay, 1972, 2002; Washburn, 1979; Gersper et al., 1980; Ping et al., 2004; Tarnocai and Zoltai, 1988; Naumov, 2004; Minke et al., 2007; Webber, 1978; Webber and Walker, 1975; Webber et al., 1980). The soils of Samoylov Island can be considered to be typical of Arctic fluvial landscapes. The variety of floodplain soils found in the western part of Samoylov Island can therefore 20
also be expected to be present on other active floodplains in the Arctic region. Similarly, polygonal tundra and soils similar to those investigated in the eastern part of Samoylov Island can be expected to form on other Arctic river terraces that are no longer flooded on a regular basis. However, at polygonal tundra sites in which fluvial and aeolian sedimentation processes are less active than in the Lena River Delta, the 25
BGD
9, 13627–13684, 2012
Climate, permafrost and land cover, Lena River Delta, Siberia
J. Boike et al.
Title Page
Abstract Introduction
Conclusions References
Tables Figures
◭ ◮
◭ ◮
Back Close
Full Screen / Esc
Printer-friendly Version Interactive Discussion
Discussion
P
a
per
|
Dis
cussion
P
a
per
|
Discussion
P
a
per
|
Discussio
n
P
a
per
et al., 2007, 2009). The Soil Organic Carbon Content (SOCC) was 28 kg m−2 for the
upper 100 cm and 73 kg m−2 for the upper 300 cm of one core on Samoylov Island,
which is comparable to the average SOCC figure for turbel soils (turbel soils contain
on average 32.2 kg m−2in first the 100 cm, with a range from 1 to 126 kg m−2, Tarnocai
et al., 2009). 5
6.2 Climate and permafrost
According to the K ¨oppen-Geiger classification, this polar tundra climate is representa-tive of the climate found around the northern edges of the North American and Eurasian 10
land masses, and on nearby islands (Peel et al., 2007). The Samoylov Island site is
characterized by a large temperature range of 44◦C between the mean temperatures
of the coolest and warmest months. The temperature ranges reported from other
Arc-tic sites with intensive investigations are generally lower, with 29◦C in the Kevo area of
Northern Finland (Harding et al., 2002), 26◦C in Nome, Alaska (Beringer et al., 2005),
15
31.8◦C in Barrow, Alaska, and 37.8◦C in Resolute, Canada (Eugster et al., 2000).
The mean total summer rainfall of 125 mm on Samoylov Island is comparable to the 86 mm at Barrow, Alaska (Liljedahl et al., 2011). The percentage of rainfall contributing to total precipitation (in 2008, rainfall contributed 70 % to the total precipitation input and SWE less than 30 %) is also similar to Barrow, where rainfall comprises from 20 % 20
to 60 % of the total precipitation (Liljedahl et al., 2011). In Alaska and Canada north
of 50◦N, snowfall contributes between 40 and 80 % of the total precipitation (Eugster
et al., 2000).
The mean net radiation from June to August showed a variability ranging from a low
of 73 W m−2 in 2004 to a high of 101 W m−2 in 1999. This is mostly due to the high
25
variability in June net radiation caused by variations in the timing of snow melt. The
BGD
9, 13627–13684, 2012
Climate, permafrost and land cover, Lena River Delta, Siberia
J. Boike et al.
Title Page
Abstract Introduction
Conclusions References
Tables Figures
◭ ◮
◭ ◮
Back Close
Full Screen / Esc
Printer-friendly Version Interactive Discussion
Discussion
P
a
per
|
Dis
cussion
P
a
per
|
Discussion
P
a
per
|
Discussio
n
P
a
per
|
other Arctic sites. Examples from other areas include 102 W m−2for the entire growing
season at a coastal fen in Greenland (Soegaard et al., 2001), 109 W m−2 for June to
August at a coastal wetland complex near Prudhoe Bay, North Slope of Alaska (Lynch
et al., 1999), and 114 W m−2for the period from 9 June to 29 August at Kaamanen in
Northern Finland (Lloyd et al., 2001). Only at Ny- ˚Alesund, Spitsbergen, have similar
5
net radiation values of 86 W m−2been recorded (Lloyd et al., 2001).
In contrast to net radiation, the timing of snow melt is comparable to that in other Arctic sites. There is, however, a large variability in the end of snow melt between the
different years examined. A high variability in the annual end of snow melt has also
been reported from Barrow, Alaska, where the dates varied from 22 May to 22 June 10
between 1940 and 2003 (Hinzman et al., 2005). Typical dates for end of snow melt reported from other Arctic and sub-Arctic sites are also within this range, for example early June at Churchill, Manitoba (Eaton and Rouse, 2001) and the end of May at Kaamanen, Northern Finland (Lloyd et al., 2001). Later snow melt (at the end of June)
has been reported from Zackenberg, Greenland, and from Ny- ˚Alesund, Spitsbergen
15
(Lloyd et al., 2001).
With a mean annual permafrost temperature of −8.6◦C at 10.7 m depth, the study
site is one of the coldest permafrost regions on earth (Romanovsky et al., 2010a). Brown and Romanovsky (2008) have presented records of permafrost temperatures from 27 circumpolar sites in the Northern Hemisphere. Comparable temperatures have 20
been reported from West Dock in Northern Alaska (near Prudhoe Bay), and from Tiksi, which is 110 km southeast of Samoylov Island. The annual range of daily mean surface
temperatures on Samoylov Island is nearly 39.3◦C, which is higher than the range
of 35.4◦C reported by Hinkel et al. (2001) from Barrow, Alaska. The difference can
perhaps be explained by the greater air temperature amplitudes and thinner snow cover 25
on Samoylov Island.
BGD
9, 13627–13684, 2012
Climate, permafrost and land cover, Lena River Delta, Siberia
J. Boike et al.
Title Page
Abstract Introduction
Conclusions References
Tables Figures
◭ ◮
◭ ◮
Back Close
Full Screen / Esc
Printer-friendly Version Interactive Discussion
Discussion
P
a
per
|
Dis
cussion
P
a
per
|
Discussion
P
a
per
|
Discussio
n
P
a
per
2010b). A general increase in permafrost temperatures has also been observed over the last few decades in Alaska (Romanovsky et al., 2007, 2010b; Osterkamp, 2008; Romanovsky et al., 2010b; Smith et al., 2010), Northwest Canada (Smith et al., 2010), and Siberia (Oberman, 2008; Romanovsky et al., 2010a).
5
6.3 Hydrosphere: thermal characteristics of ponds and thermokarst lakes, and their water budgets
Ponds are generally well mixed and experience high water temperatures during the
summer, and are therefore hotspots for biological activity and CO2emission (Abnizova
10
et al., 2012; Abramova et al., 2012). The ponds in the study area freeze completely in winter, but the timing of freeze-back can vary by up to 2 months depending on the surface energy balance (Langer et al., 2011b). The deep thermokarst lakes do not freeze to the bottom during the winter and are therefore underlain by a zone of thawed material. These deep thermokarst lakes are thermally stratified during winter, which is 15
also typical of Arctic lakes in the Toolik area, Alaska (Hobbie, 1984), but the lakes on Samoylov Island also experience stratification during summer, alternating with phases
of complete mixing of the entire water body. In contrast, Duffet al. (1999) found that,
in the Taimyr and Pechora River regions, the degree of stratification was mainly re-lated to the water depth and the vegetation zone, and no stratification was observed 20
in the tundra lakes (although this observation was based on individual measurements,
rather than time series). The difference between surface and bottom temperatures in
the tundra lakes in the Taimyr and Pechora River regions was always<2◦C, even in
two relatively deep (>5 m) lakes.
The long-term summer water budget calculated from precipitation minus evapotran-25
BGD
9, 13627–13684, 2012
Climate, permafrost and land cover, Lena River Delta, Siberia
J. Boike et al.
Title Page
Abstract Introduction
Conclusions References
Tables Figures
◭ ◮
◭ ◮
Back Close
Full Screen / Esc
Printer-friendly Version Interactive Discussion
Discussion
P
a
per
|
Dis
cussion
P
a
per
|
Discussion
P
a
per
|
Discussio
n
P
a
per
|
evapotranspiration). The extent of the wetland and the way that it is likely to change with future variations in the climate depend mainly on the water balance, i.e. the dif-ference between precipitation and evaporation (Boike et al., 2008; Woo et al., 2008). Thus, water bodies can serve as sentinels of environmental change (Smol et al., 2007) especially when remote sensing observations are available.
5
There are few long-term water balance studies available for the Arctic. Hinzman et al. (2005) and Riordan et al. (2006) have presented estimates of long-term simplified P-ET water balances for Northern Alaska. Their calculations of evaporation were based on the “uncorrected” Thornthwaite approach, i.e. they found significant reductions in the water balance despite no significant decrease in precipitation. These trends can 10
be assumed to be an artifact caused by overestimations of evapotranspiration by the uncorrected Thornthwaite approach, as both derived annual evaporation totals that are 4 to 7 times higher than the measured evaporation rates reported from these regions (Rouse et al., 1992; Vourlitis and Oechel, 1999).
Both the current wetland extent and its controlling mechanisms have, to date, been 15
only crudely simulated in earth system models (for example, using HadGEM2-ES). Model biases exist regarding regional and local surface water balances (Kattsov et al., 2007). Moreover, these models do not take into account subscale patterns and pro-cesses such as the spatio-temporal dynamics of low-centered ice-wedge polygons (de Klerk et al., 2011), or present-day land surface changes such as thermokarst lake 20
formation (Jorgenson and Shur, 2007), increases in shrub cover (Sturm et al., 2001; Hinzman et al., 2005), prolongation of the snow-free season (Chapin et al., 2005), and changes in the surface water balance (Hinzman et al., 2005).
7 Summary and conclusions
We have presented high resolution land surface properties that regulate surface radia-25
BGD
9, 13627–13684, 2012
Climate, permafrost and land cover, Lena River Delta, Siberia
J. Boike et al.
Title Page
Abstract Introduction
Conclusions References
Tables Figures
◭ ◮
◭ ◮
Back Close
Full Screen / Esc
Printer-friendly Version Interactive Discussion
Discussion
P
a
per
|
Dis
cussion
P
a
per
|
Discussion
P
a
per
|
Discussio
n
P
a
per
with similar wetland polygonal tundra landscape. The characteristics are: (i) a fine scale variability with roughly half of the land surface dominated by wet surfaces; (ii) a large
annual air temperature range of about 44◦C; (iii) very cold annual permafrost
temper-atures of about−8.6◦C at 11 m depth; (iv) a high variability of annual end of snowmelt;
(v) a high spatial and interannual variability of timing of complete freeze back of tundra 5
and ponds, ranging from a month to several months; (vi) non frozen conditions below the ice cover of thermokarst lakes during winter; (vii) a roughly balanced water budget,
i.e. precipitation balances evapotranspiration (runoffnegligible).
No clear warming of air and active layer temperatures in the upper meter is detected since 1998, though winter air temperatures during recent years have not been as cold 10
as in earlier years. The warming of permafrost of about 1◦C at 10.7 m depth since 2006
is most likely related to changes in winter air temperature, radiation and snow cover.
8 Outlook: Samoylov Island – a new Arctic observatory
The establishment of the Samoylov Island observatory, provides a unique opportunity to obtain coherent, reliable, long-term data sets for the polygonal tundra of Northern 15
Siberia. It is currently Its aim is to focus, streamline, and integrate the existing measure-ment campaigns and long-term monitoring programs that have been conducted in the region over the past 15 yr. The Samoylov observatory will serve as a benchmark and validation site for earth system models, remote sensing, and in situ change detection. In addition to the polygonal tundra landscape of Samoylov Island, the nearby islands 20
(such as Kurungnah) feature different, homogeneous landscape units that are
excel-lently suited for validation of multi-scale remote sensing techniques. Permafrost moni-toring based on remote sensing using multiple sensors (surface temperature, surface soil moisture, albedo, surface subsidence, and snow cover properties), and numerical heat transfer modelling, have considerable potential when they can be related to field 25
BGD
9, 13627–13684, 2012
Climate, permafrost and land cover, Lena River Delta, Siberia
J. Boike et al.
Title Page
Abstract Introduction
Conclusions References
Tables Figures
◭ ◮
◭ ◮
Back Close
Full Screen / Esc
Printer-friendly Version Interactive Discussion
Discussion
P
a
per
|
Dis
cussion
P
a
per
|
Discussion
P
a
per
|
Discussio
n
P
a
per
|
It is important to note that all modeling strategies require a field-based understanding of the surface characteristics and key processes involved, as well as monitoring data for a number of key parameters. The vision of a pan-Arctic state-of-the-art network of
“Arctic Observatories” in support of modeling efforts is therefore one that is well worth
pursuing. 5
Acknowledgements. We would like to thank Waldemar Schneider for logistical support, Max
Heikenfeld for data analysis, Paul Overduin for discussions, Soloviev Grigoriy for assistance with field work and Ed Manning for proof reading. This work was supported by the Helmholtz Association through a grant (VH-NG 203) awarded to Julia Boike.
References 10
Abnizova, A., Siemens, J., Langer, M., and Boike, J.: Small ponds with major impact: the rel-evance of ponds and lakes in permafrost landscapes to carbon dioxide emissions, Global Biogeochem. Cy., 26, 2041, doi:10.1029/2011gb004237, 2012.
Abramov, I. I. and Volkova, L. A.: Handbook of Mosses of Karelia, KMK Scientific Press Delphos, Moscow, 390 pp., 1998.
15
Abramova, I., Vishnyakova, I., Boike, J., Chetverova, A., Abramova, A., and Soloviev, G.: Longterm zooplankton community investigations of the different tundra lakes in the Lena Delta, Russian Arctic, 2012 – this issue.
ACIA: Impacts of a Warming Arctic: Arctic Climate Impacts Assessment, Cambridge, 1042, 2005.
20
AMAP: Snow, Water, Ice and Permafrost in the Arctic (SWIPA): Climate Change and the Cryosphere, Arctic Monitoring and Assessment Programme (AMAP), Oslo, Norway, xii+538 pp., 2011.
Becker, H., Akhmadeeva, I., Wagner, D., Pfeiffer, E.-M., and Quass, W.: Soils of Samoylov Island, Reports on Polar and Marine Research, 315, 21–27, 1999.
25