FREE THEMES
1 Programa de Pós-Graduação em Ciência da Nutrição, Departamento de Nutrição e Saúde, Universidade Federal de Viçosa. Av. P.H. Rolfs s/n, Campus Universitário. 36571-000 Viçosa MG Brasil. [email protected] 2 Departamento de Saúde Pública, Centro de Ciências Biológicas e da Saúde, Universidade Federal do Maranhão.
3 Departamento de Nutrição, Universidade Estadual do Ceará.
The association between cardiovascular risk factors
and anthropometric obesity indicators in university students
in São Luís in the State of Maranhão, Brazil
Abstract The article aims to evaluate the rela-tion between cardiovascular risk factors (CVRF) and anthropometric indicators in a sample of university students from São Luís-MA, Brazil. It is a cross-sectional study conducted with 968 university students, with median age of 22. Gly-cemia, triglycerides, HDL-c, smoking, alcohol consumption, physical inactivity, metabolic syn-drome (Joint Interim Statement criteria) and insulin resistance (IR), were associated and cor-related with anthropometric indicators such as BMI, WC, WHR and WHtR. Associations were found between TGL, SH, SM and higher values of all anthropometric variables. The RI was asso-ciated with higher BMI values and WHtR in men and women. The low HDL-c was associated with higher values of all anthropometric variables in women. Consumption of alcohol was associated with higher values of BMI and WC in women and WHR in men and WHtR. Smoking was associated with higher values of WHtR in both sexes. Physi-cal inactivity was associated with higher values of WHR in men only. The highest correlations were established for women between TGL and BMI CC, WHR and WHtR. The indicators most asso-ciated with CVRF were BMI, WC and WHtR in females and WHR and WHtR in men.
Key words Cardiovascular risk factors, Obesity,
Abdominal obesity
Carolina Abreu de Carvalho 1
Poliana Cristina de Almeida Fonseca 1
José Bonifácio Barbosa 2
Soraia Pinheiro Machado 3
Alcione Miranda dos Santos 2
C
ar
v
alho CA
Introduction
Cardiovascular diseases are the leading cause of morbidity and mortality in Brazil and in the
world1,2. This epidemiological trend is of concern
because it implies reduced quality of life for pop-ulations, in addition to high and increasing costs for the government, society, families and individ-uals3.
The relationships between the development of cardiovascular diseases and risk factors such as dyslipidemia, smoking, physical inactivity and obesity, particularly central fat distribution are
well established1,4. For a long time these
cardio-vascular risk factors were considered important only in advanced age groups within populations. However, recent studies have shown that risk fac-tors exist among young adults, and even among
children and adolescent5-7.
The use of anthropometric indicators has grown as a simple and effective way of evaluating cardiovascular risk. The main indicator used for the detection of general obesity is the body mass index (BMI) and for abdominal obesity, waist circumference (WC), the waist-hip ratio (WHR)
and waist-to-height ratio (WHtR)8,9.
Although not the most accurate methods for assessing body composition, anthropometric in-dicators show good reliability and are the most cost effective as well as being enforceable on a
large scale9,10. Studies have demonstrated the
ca-pacity of some anthropometric indicators in the prediction of cardiovascular risk. According to
the study by Haun et al.8, anthropometric
indi-cators BMI, WC, WHR, WHtR and the conicity index show good predictive ability of high
cor-onary risk. A study by Oliveira et al.4 with adults
from Florianópolis, Santa Catarina State, found a high correlation between BMI, WHR and cardio-vascular risk factors, particularly dyslipidemia.
Insulin resistance is one of the leading cardio-vascular risk factors and is associated with viscer-al fat, hypertension, diabetes, dyslipidemia, and
other metabolic disorders11. Nevertheless, the
diagnosis of insulin resistance is not yet part of routine medical examinations in Brazil, because diagnostic methods have high costs. Insulin re-sistance appears to be associated with anthropo-metric indicators of obesity, especially of central distribution11,12.
College students represent a section of the public whose lifestyle within an academic en-vironment can result in missed meals and high consumption of fast foods that are nutritionally
inadequate13. Other cardiovascular risk factors
are high in this group, including high rates of physical inactivity and being overweight. In Bra-zil there are reports of a high prevalence of these risk factors in the university population. Moreira
et al.7 observed a prevalence of 38.1% of
over-weight, 34.8% of sedentary lifestyles, 27.5% of hypercholesterolemia, 14.6% of cigarette smok-ing and 8.4% of hypertension in the college pop-ulation.
Identifying cardiovascular risk factors al-lows the development of preventative planning against cardiovascular disease, in addition to supporting public health programs against these diseases. Considering that the onset of cardiovas-cular disease has manifested itself increasingly early, it has become important to study how the correlation happens between these diseases and anthropometric indicators in young individuals. Therefore, this article looked to evaluate the as-sociation between cardiovascular risk factors and anthropometric indicators in a number of uni-versity students in the city of São Luís, in Maran-hão State, Brazil.
Methods
This is a transversal study conducted in São Luís, with students from public and private univer-sities. Data collection was performed between August 2011 and October 2012 by a group of students who were selected and introduced to protocols.
Overall samples consisted of students taken from nine universities in São Luís which together accounted for 95% of university students in the city. Sampling was carried out in clusters in two stages. In the first stage subjects were selected and in the second stage students were selected. The sample was divided into public and private universities. Each university provided a list of all subjects offered and based on the lists provided by all universities, a simple random sampling of the subjects was carried out. This sampling con-sidered the proportional probability to the num-ber of students in each university, in relation to the total number of students from all the univer-sities. 12 students were randomly selected in each subject drawn. We calculated the correction by multiplicity, considering the number of subjects studied by each student because each student generally attends more than one subject and this alters the probabilities of selection.
e C
ole
tiv
a,
20(2):479-490,
2015
of approximately 50% with a margin of error of 3% and a confidence interval of 95%. It was still possible to detect an 8% difference in the preva-lence of metabolic syndrome (estimated at 10%) between the exposed and unexposed groups, as-suming a probability of type I error of 5% and settling at 80% the power of the study and with a design effect of 2. The final sample was of 968 students, with 25.3% of losses occurring due to refusal or absence of the student in the classroom on the day of the interview. The attendance rate of students for performing laboratory tests was 45.5%.
Each participant underwent an interview, swering a questionnaire and having his/her an-thropometric measurements and blood pressure measured. On this occasion, the participant was instructed to perform a free blood test in regis-tered laboratories in order to obtain their met-abolic variables. The questionnaire consisted of questions regarding socioeconomic data, alcohol consumption, smoking, food consumption and physical activity levels.
Anthropometric variables used in this study were: BMI, WC, WHR, and WHtR. The BMI was calculated by the formula BMI = weight (kg) /
height2 (m), and classified according to the values
established for adults by the World Health
Orga-nization (WHO)14. Weight was measured using
the Tanita portable scale BC533® (Brazil), with the individual standing and barefoot. Height was measured using the Alturaexata® stadiometer (Brazil), with the individual standing barefoot, with heels together, back straight and arms
out-stretched beside the body15.
The WC was obtained using non-elastic tape, positioned immediately above the umbilicus, and the reading made immediately after
expira-tion15. For classification cut off points were used
as proposed by the National Cholesterol Educa-tion Program (NCEP), pointing to
cardiovascu-lar risk values ≥ 102 cm for men and for women
≥ 88 cm16.
Hip circumference (HC) was measured in the region of largest circumference between the
waist and the thigh15. The WHR was calculated
by the ratio between WC and the hip circumfer-ence (HC) and classified according to the cut off
points as proposed by the WHO 14.
WHtR was found by the ratio between WC
and height, both in centimetres, and values of ≥
0.52 for men and ≥ 0.53 for women were
consid-ered of risk17.
As cardiovascular risk factors the following variables were considered: glycemia, elevated
tri-glycerides, reduced HDL-C, smoking, excessive alcohol consumption, physical inactivity, meta-bolic syndrome and insulin resistance.
Laboratory tests of fasting glycemia, insulin-emia and lipid profile (Triglycerides, HDL-C) were carried out using the ADVIA 1650 equip-ment (Bayer Co, USA). Glycemia was considered
high when ≥ 100mg/dl18. Lipid profile changes
were considered for the following values:
tri-glycerides ≥ 150mg/dl; HDL-C < 50mg/dl in
women and < 40mg/dl in men16.
Insulin resistance was measured by the Ho-meostasis Model Assessment-Insulin Resistance (HOMA-IR) using the formula: HOMA-IR =
In-sulin (µU/mL) x (glycemia mg/dL ≤ 18) ≤ 22.519.
Insulin resistance diagnosis was made when HO-MA-IR > 2.720.
Blood pressure was measured twice within an interval of five minutes; the measurement with the lowest value was used, using digital automatic devices Omron® (Japan) with different cuff sizes. Hypertension was considered for blood pressure
values of ≥ 130x85mmHg16.
Smoking was considered when there was the consumption of at least one cigarette in the last month. The excessive consumption of alcohol was considered when there was a consumption of more than five doses in a single occasion.
The instrument used to assess the level of physical activity was the short version of the International Physical Activity Questionnaire (IPAQ - International Physical Activity Ques-tionnaire - Short Form). Participants in this study were classified as sedentary, active and
sufficiently active21. For the association analysis,
active and sufficiently active participants were categorized together. Below are the criteria used for each group:
.
Active: Individuals who underwent intense physical activity for at least three days, reaching at least 1,500 METs (Metabolic Equivalent of Task); or performed seven days or more of combined activities (walking, moderate activity or intense activity), reaching at least 3,000 METs..
Sufficiently active:Individuals who under-went intense physical activity at least 20 minutes daily for three days or more; or five or more days of moderate activity and / or walking at least 30 minutes per day; or five or more days of com-bined activities, reaching at least 600 METs..
Sedentary:Those who do not fit in any of the previous groups.For the classification of Metabolic Syndrome
(MS) criteria of the Joint Interim Statement (JIS)
C
ar
v
alho CA
the presence of three of the following criteria: 1)
fasting glucose ≥ 110mg/dL; 2) systolic
arteri-al pressure ≥ 130mmHg and/or diastolic blood
pressure ≥ 85 mmHg; 3) HDL-C ≤ 40mg/dL in
men and ≤ 50mg/dL in women; 4) triglycerides
≥ 150 mg/dL; 5) waist circumference > 90 cm in
men and > 80 cm in women.
Data was entered into Microsoft Excel® soft-ware then processed and analyzed using Stata 10.0® statistical software. To test the normality of distribution of variables the Shapiro-Wilk test was used. Quantitative variables were expressed using medians and the 25th and 75th percen-tiles, and qualitative variables were presented as frequency and percentage. To investigate the as-sociation between anthropometric variables and cardiovascular risk factors the chi-square test was used. For the analysis of the correlation between anthropometric indicators, metabolic indicators and blood pressure, the Pearson correlation co-efficient with inclusion of sample weights was used. Although all variables have not presented normal distribution, in Stata® it is not possible to perform an estimate of the correlation using the Spearman coefficient, correcting for the complex delineation of sampling or considering the sam-ple weights. The calculation of the Spearman cor-relation without correction for the design of the study produces lower estimates of correlations and underestimates sampling errors. To obtain the p-value of the correlations, linear regression was used considering the complex delineation of sampling. In all tests the significance level was set at 0.05. To classify the correlation coefficients a correlation was considered weak when r < 0.4,
moderate when r ≥ 0.4 and r < 0.5 and strong
when r ≥ 0.522.
The probability of selection for each student was calculated for the two stages. In the first stage the ratio between the number of subjects drawn and the number of subjects offered in each uni-versity was used. In the second stage the number of students interviewed was divided by the num-ber of students in each discipline. The probabili-ties obtained at each stage were multiplied among themselves and finally, by the number of subjects that the student was studying. For the statisticalt analysis, data was weighted by the inverse of the probability of selection, considering also the di-vision by university (public and private) and the effect of conglomerate, through the svy com-mand in Stata®. As the losses of performing the exams in the laboratory were high, there was no response by weighting through the inverse of the selection probability of each individual.
This study was approved by the Ethics Com-mittee in Research of the Presidente Dutra Uni-versity Hospital at the Federal UniUni-versity of Ma-ranhão. All participants signed and received a copy of the Free and Clarified Consent Term.
Results
968 university students were studied, with a pre-dominance of females (62% vs. 38%) and a me-dian age of 22 years for men and 23 for women.
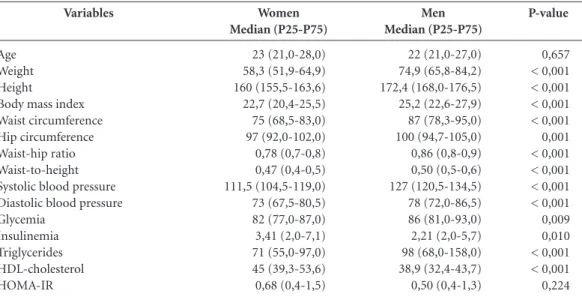
Table 1 presents the descriptive measures of the metabolic variables, blood pressure and an-thropometric indicators.
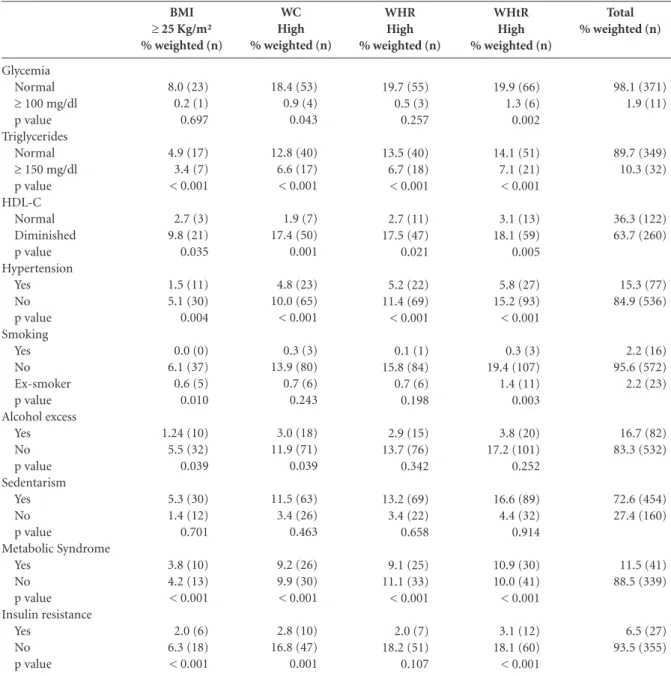
Alteration in the lipid profile showed high results in both genders. Triglycerides were
sig-nificantly higher in men (27.5% vs. 10.3%, p =
0.004) and in both genders showed significant association with higher values for all anthropo-metric variables. The decrease in HDL-C was
significantly higher in women (63.7% vs. 55.7%,
p = 0.001). In females decreased HDL-C was as-sociated with higher BMI (p = 0.035), WC (p = 0.001), WHR (p = 0.021) and WHtR (p = 0.005). For men association was observed only with higher values of WC. (p = 0.035).
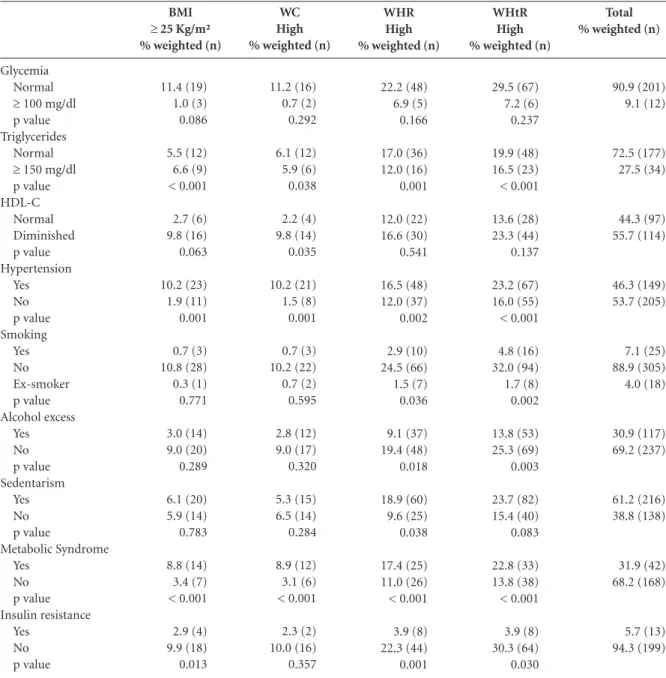
The prevalence of hypertension was
signifi-cantly higher in men (57.0% vs. 13.1%, p < 0.001),
however, was associated with higher values for all anthropometric variables in both genders.
Positively, the frequency of smoking was low
for both sexes, but men smoked more (7.1% vs.
2.2, p = 0.002) than women. Smoking was asso-ciated with higher BMI (p = 0.010) and WHtR (p = 0.003) in women, and WHR (p = 0.036) and WHtR (p = 0.002) in men. Excessive
alco-hol consumption was higher in men (30.9% vs.
16.7%, p < 0.001) and was related to higher val-ues of WHR (p = 0.018) and WHtR (p = 0.003) in this gender. Women who reported excessive al-cohol consumption had higher BMI (p = 0.039) and WC (p = 0.039). Sedentary lifestyle was quite high in both genders, being higher in women (73.9%). Although showing highest prevalence in women no significant relationship with any anthropometric variable for this gender was ob-served. On the other hand, sedentary men had higher values of WHR (p = 0.038).
The prevalence of MS was high, especially in
men (31.9% vs. 11.5%, p = 0.002). There was an
sig-e C
ole
tiv
a,
20(2):479-490,
2015
nificant association was observed between this variable and higher values of WC (p = 0.001) in women, and WHR (p = 0.001) in men. Insulin resistance was related to higher BMI and WHtR in both genders (Table 2 and 3).
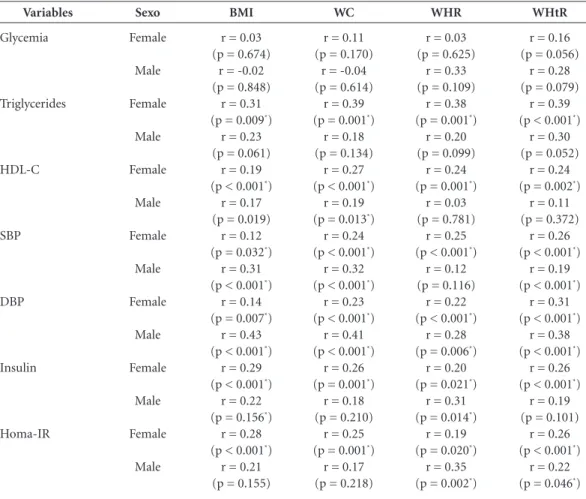
The results obtained in the analysis of cor-relation between metabolic parameters and blood pressure and anthropometric indicators showed a weak correlation between them, al-though it was significant in many cases. The highest correlations were established for females between triglycerides and BMI (r = 0.31), WC (r = 0.39), WHR (r = 0.38) and WHtR (r = 0.39); and between DBP and BMI (r = 0.43), WC (r = 0.41) and WHtR (r = 0.38), Insulin and WHR (r = 0.31), HOMA-IR and WHR (r = 0.35), for men (Table 4).
Discussion
The prevalence of cardiovascular risk factors found in this population of students was high, especially for being a young audience, with a me-dian age of 22 years. Anthropometric indicators of obesity used in this study were, in general, associated with cardiovascular risk factors,
indi-cating its potential performance in tracking this risk, even in younger individuals.
The medians of all anthropometric indica-tors of obesity, triglycerides, HDL-C, SBP, DBP and glycemia were higher in men. Insulin and HOMA-IR were higher in women. Other studies have also found similar results with higher serum lipids, blood pressure and anthropometric mea-surements in males, and are higher in adults than
for younger people23-25.
An altered lipid profile is an important car-diovascular risk factor, which has been
increas-ingly observed in young individuals9. The main
dyslipidemia associated with cardiovascular risk are increased serum triglycerides and decreased HDL-C. We found a high rate of low HDL-C in both genders, which is probably due to high frequency of overweight, physical inactivity and alcohol consumption.
For triglycerides, significant associations with higher values of all anthropometric variables for both genders were observed. On the other hand, more associations between HDL-C and anthro-pometric variables in females were found. In
women in Curitiba, Paraná State, Krause et al.26
found a direct relationship between changes in triglyceride and HDL-C and anthropometric
Variables
Age Weight Height
Body mass index Waist circumference Hip circumference Waist-hip ratio Waist-to-height Systolic blood pressure Diastolic blood pressure Glycemia
Insulinemia Triglycerides HDL-cholesterol HOMA-IR
Women Median (P25-P75)
23 (21,0-28,0) 58,3 (51,9-64,9) 160 (155,5-163,6) 22,7 (20,4-25,5) 75 (68,5-83,0) 97 (92,0-102,0) 0,78 (0,7-0,8) 0,47 (0,4-0,5) 111,5 (104,5-119,0) 73 (67,5-80,5) 82 (77,0-87,0) 3,41 (2,0-7,1) 71 (55,0-97,0) 45 (39,3-53,6) 0,68 (0,4-1,5)
Table 1. Descriptive characteristics of students according to gender, São Luís, Maranhão State, Brazil, 2011-12.
Men Median (P25-P75)
22 (21,0-27,0) 74,9 (65,8-84,2) 172,4 (168,0-176,5) 25,2 (22,6-27,9) 87 (78,3-95,0) 100 (94,7-105,0) 0,86 (0,8-0,9) 0,50 (0,5-0,6) 127 (120,5-134,5) 78 (72,0-86,5) 86 (81,0-93,0) 2,21 (2,0-5,7) 98 (68,0-158,0) 38,9 (32,4-43,7) 0,50 (0,4-1,3)
P-value
0,657 < 0,001 < 0,001 < 0,001 < 0,001 0,001 < 0,001 < 0,001 < 0,001 < 0,001 0,009 0,010 < 0,001 < 0,001 0,224
C ar v alho CA Glycemia Normal
≥ 100 mg/dl p value Triglycerides
Normal
≥ 150 mg/dl p value HDL-C Normal Diminished p value Hypertension Yes No p value Smoking Yes No Ex-smoker p value Alcohol excess Yes No p value Sedentarism Yes No p value Metabolic Syndrome Yes No p value Insulin resistance Yes No p value BMI
≥ 25 Kg/m² % weighted (n)
8.0 (23) 0.2 (1) 0.697 4.9 (17) 3.4 (7) < 0.001 2.7 (3) 9.8 (21) 0.035 1.5 (11) 5.1 (30) 0.004 0.0 (0) 6.1 (37) 0.6 (5) 0.010 1.24 (10) 5.5 (32) 0.039 5.3 (30) 1.4 (12) 0.701 3.8 (10) 4.2 (13) < 0.001 2.0 (6) 6.3 (18) < 0.001
Table 2. Association between anthropometric indicators of obesity and cardiovascular risk factors in college women of São Luís. São Luís, Maranhão State, Brazil, 2011-12.
WC High % weighted (n)
18.4 (53) 0.9 (4) 0.043 12.8 (40) 6.6 (17) < 0.001 1.9 (7) 17.4 (50) 0.001 4.8 (23) 10.0 (65) < 0.001 0.3 (3) 13.9 (80) 0.7 (6) 0.243 3.0 (18) 11.9 (71) 0.039 11.5 (63) 3.4 (26) 0.463 9.2 (26) 9.9 (30) < 0.001 2.8 (10) 16.8 (47) 0.001 WHR High % weighted (n)
19.7 (55) 0.5 (3) 0.257 13.5 (40) 6.7 (18) < 0.001 2.7 (11) 17.5 (47) 0.021 5.2 (22) 11.4 (69) < 0.001 0.1 (1) 15.8 (84) 0.7 (6) 0.198 2.9 (15) 13.7 (76) 0.342 13.2 (69) 3.4 (22) 0.658 9.1 (25) 11.1 (33) < 0.001 2.0 (7) 18.2 (51) 0.107
BMI = Body mass index; WC = Waist circumference; WHR = Waist-hip ratio; HtR = Waist-to-height; HDL-C = High density lipoprotein cholesterol.
WHtR High % weighted (n)
19.9 (66) 1.3 (6) 0.002 14.1 (51) 7.1 (21) < 0.001 3.1 (13) 18.1 (59) 0.005 5.8 (27) 15.2 (93) < 0.001 0.3 (3) 19.4 (107) 1.4 (11) 0.003 3.8 (20) 17.2 (101) 0.252 16.6 (89) 4.4 (32) 0.914 10.9 (30) 10.0 (41) < 0.001 3.1 (12) 18.1 (60) < 0.001 Total % weighted (n)
98.1 (371) 1.9 (11) 89.7 (349) 10.3 (32) 36.3 (122) 63.7 (260) 15.3 (77) 84.9 (536) 2.2 (16) 95.6 (572) 2.2 (23) 16.7 (82) 83.3 (532) 72.6 (454) 27.4 (160) 11.5 (41) 88.5 (339) 6.5 (27) 93.5 (355)
variables BMI, WC and WHR, with higher levels of significance being observed for WC and WHR. These results suggest that the increase in body fat, particularly in the abdominal level tends to cause changes in serum lipid parameters.
Prevalence of SAH was found to be signifi-cantly higher in men. It is known that excessive weight is related to other cardiovascular risk
factors such as decreased HDL-C and hypertri-glyceridemia, which have a great impact on high
blood pressure23. Therefore, the high prevalence
e C ole tiv a, 20(2):479-490, 2015
to anthropometric measures of obesity5. SAH
was significantly associated with higher values for all anthropometric variables in both men
and women. Mascena et al.27, found an
associa-tion (p<0.001) between SAH and obesity (mea-sured by BMI and the WC) in college students in Campina Grande, Paraíba State. Nascente et
al.24, in a study of adults in Goiás, found a higher
prevalence of SAH in men, while the obese had a 2.3 times higher risk of SAH and those with high WC, a 3.2 times greater risk. Anthropometric in-dicators of abdominal obesity, especially WC and WHtR, appear to have better performance in
pre-dicting high blood pressure9.
A low frequency of smoking in the sample (4.3%) was a positive finding. This practice was
Glycemia Normal
≥ 100 mg/dl p value Triglycerides
Normal
≥ 150 mg/dl p value HDL-C Normal Diminished p value Hypertension Yes No p value Smoking Yes No Ex-smoker p value Alcohol excess Yes No p value Sedentarism Yes No p value Metabolic Syndrome Yes No p value Insulin resistance Yes No p value BMI
≥ 25 Kg/m² % weighted (n)
11.4 (19) 1.0 (3) 0.086 5.5 (12) 6.6 (9) < 0.001 2.7 (6) 9.8 (16) 0.063 10.2 (23) 1.9 (11) 0.001 0.7 (3) 10.8 (28) 0.3 (1) 0.771 3.0 (14) 9.0 (20) 0.289 6.1 (20) 5.9 (14) 0.783 8.8 (14) 3.4 (7) < 0.001 2.9 (4) 9.9 (18) 0.013
Table 3. Association between anthropometric indicators of obesity and cardiovascular risk factors in college men of São Luís. São Luís, Maranhão State, Brazil, 2011-12.
WC High % weighted (n)
11.2 (16) 0.7 (2) 0.292 6.1 (12) 5.9 (6) 0.038 2.2 (4) 9.8 (14) 0.035 10.2 (21) 1.5 (8) 0.001 0.7 (3) 10.2 (22) 0.7 (2) 0.595 2.8 (12) 9.0 (17) 0.320 5.3 (15) 6.5 (14) 0.284 8.9 (12) 3.1 (6) < 0.001 2.3 (2) 10.0 (16) 0.357 WHR High % weighted (n)
22.2 (48) 6.9 (5) 0.166 17.0 (36) 12.0 (16) 0.001 12.0 (22) 16.6 (30) 0.541 16.5 (48) 12.0 (37) 0.002 2.9 (10) 24.5 (66) 1.5 (7) 0.036 9.1 (37) 19.4 (48) 0.018 18.9 (60) 9.6 (25) 0.038 17.4 (25) 11.0 (26) < 0.001 3.9 (8) 22.3 (44) 0.001
BMI = Body mass index; WC = Waist circumference; WHR = Waist-hip ratio; HtR = Waist-to-height; HDL-C = High density lipoprotein cholesterol.
WHtR High % weighted (n)
29.5 (67) 7.2 (6) 0.237 19.9 (48) 16.5 (23) < 0.001 13.6 (28) 23.3 (44) 0.137 23.2 (67) 16.0 (55) < 0.001 4.8 (16) 32.0 (94) 1.7 (8) 0.002 13.8 (53) 25.3 (69) 0.003 23.7 (82) 15.4 (40) 0.083 22.8 (33) 13.8 (38) < 0.001 3.9 (8) 30.3 (64) 0.030 Total % weighted (n)
C
ar
v
alho CA
more common in men and those who mentioned smoking had higher WHR and WHtR. Smoking seems to be a predictor of abdominal obesity in men, which is consistent with the relationship
found in our study28.
Excessive alcohol consumption was high, es-pecially in men. There are not many studies about the association between alcohol consumption and anthropometric variables, making it difficult to compare the results of this study. Consump-tion of alcohol whether excessive or not, seems to be associated with adiposity and abdominal
obe-sity in young adults29. In our study, this finding
was also confirmed, since women drinkers had higher BMI and WC, while men had higher val-ues of WHR and WHtR.
Alcohol consumption favours the develop-ment of obesity because generally the energy that alcohol provides is added to the daily energy value of individuals. Furthermore, alcohol con-sumption increases the appetite and is associated with consumption of other foods
simultaneous-ly, which also contributes to the weight gain30. By
being prioritized in metabolism, alcohol can alter lipid oxidation, contributing to fat accumulation,
especially in the abdominal region30. This may
explain the fact that we found significant associ-ation of excessive alcohol consumption with the variables of abdominal obesity.
The increased use of computers and the great-er occupation of time by students in activities related to the university interferes negatively in
Variables
Glycemia
Triglycerides
HDL-C
SBP
DBP
Insulin
Homa-IR
Sexo
Female
Male
Female
Male
Female
Male
Female
Male
Female
Male
Female
Male
Female
Male
Table 4. Correlation between metabolic indicators and blood pressure and anthropometric indicators of obesity in college students of São Luís. São Luís, Maranhão State, Brazil, 2011-12.
BMI
r = 0.03 (p = 0.674)
r = -0.02 (p = 0.848)
r = 0.31 (p = 0.009*)
r = 0.23 (p = 0.061)
r = 0.19 (p < 0.001*)
r = 0.17 (p = 0.019)
r = 0.12 (p = 0.032*)
r = 0.31 (p < 0.001*)
r = 0.14 (p = 0.007*)
r = 0.43 (p < 0.001*)
r = 0.29 (p < 0.001*)
r = 0.22 (p = 0.156*)
r = 0.28 (p < 0.001*)
r = 0.21 (p = 0.155)
WC
r = 0.11 (p = 0.170)
r = -0.04 (p = 0.614)
r = 0.39 (p = 0.001*)
r = 0.18 (p = 0.134)
r = 0.27 (p < 0.001*)
r = 0.19 (p = 0.013*)
r = 0.24 (p < 0.001*)
r = 0.32 (p < 0.001*)
r = 0.23 (p < 0.001*)
r = 0.41 (p < 0.001*)
r = 0.26 (p = 0.001*)
r = 0.18 (p = 0.210)
r = 0.25 (p = 0.001*)
r = 0.17 (p = 0.218)
HOMA-IR = Homeostasis Model Assessment - Insulin Resistance; BMI = Body mass index; WC = Waist circumference; WHR = Waist-hip ratio; WHtR = Waist-to-height; HDL-C = High density lipoprotein cholesterol; SBP Systolic blood pressure; DBP = Diastolic blood pressure. r = correlation coefficient, * p < 0.05.
WHR
r = 0.03 (p = 0.625)
r = 0.33 (p = 0.109)
r = 0.38 (p = 0.001*)
r = 0.20 (p = 0.099)
r = 0.24 (p = 0.001*)
r = 0.03 (p = 0.781)
r = 0.25 (p < 0.001*)
r = 0.12 (p = 0.116)
r = 0.22 (p < 0.001*)
r = 0.28 (p = 0.006*)
r = 0.20 (p = 0.021*)
r = 0.31 (p = 0.014*)
r = 0.19 (p = 0.020*)
r = 0.35 (p = 0.002*)
WHtR
r = 0.16 (p = 0.056)
r = 0.28 (p = 0.079)
r = 0.39 (p < 0.001*)
r = 0.30 (p = 0.052)
r = 0.24 (p = 0.002*)
r = 0.11 (p = 0.372)
r = 0.26 (p < 0.001*)
r = 0.19 (p < 0.001*)
r = 0.31 (p < 0.001*)
r = 0.38 (p < 0.001*)
r = 0.26 (p < 0.001*)
r = 0.19 (p = 0.101)
r = 0.26 (p < 0.001*)
e C
ole
tiv
a,
20(2):479-490,
2015
the practice of physical activities27,31. The rate of
sedentary lifestyle in this sample was high, being higher in women. Nevertheless, this variable was significantly higher only for the anthropometric indicator WHR in males. The higher prevalence of abdominal obesity in sedentary men was also
found by Pinho et al.29. This result is exected,
since there seems to be an inverse relationship between body fat and energy expenditure, and a
better distribution of fat in active individuals32.
MS was higher in men, which may be linked to the fact that most of the variables that make the diagnosis of the syndrome were more prevalent in males. Additionally, the high consumption of alcohol and smoking more observed among men may also be related to the development of MS. Similarly to this study, other studies have shown a significant association of anthropometric
indi-cators with MS33,34. Rocha et al.33, by studying the
relationship between MS and the variables BMI, WC, HC, WHR, WHtR and lean mass, concluded that they are all able to identify carriers of MS.
Insulin resistance was present in 6.2% of col-lege students and there was no difference in prev-alence between genders. Significant association of insulin resistance with WHtR and BMI for both sexes was observed. Higher values of WC were associated only in females, while higher values of WHR in men only. In a São Paulo study, Matos
et al.12 observed that BMI, WC and WHtR were
the anthropometric indicators most associated with insulin resistance. Increased body adiposity contributes to decreased insulin sensitivity, so in-dividuals with obesity, especially central, tend to
have a higher prevalence of insulin resistance11,33.
In our study, this finding was confirmed. Among the lipid profile variables, the highest correlations were observed between triglycerides and anthropometric indicators of abdominal
obesity. In the study by Gharakhanlou et al.25,
with the urban population of Iran, the variables of abdominal obesity were best correlated with hypertriglyceridemia and low HDL-C, but the opposite was observed in our study, these cor-relations were more pronounced in men.
The components of blood pressure (SBP and DBP) also showed significant correlations with anthropometric indicators of obesity. In the
study by Rezende et al.23 mild to moderate
cor-relations between BMI and SBP were observed. (r = 0.36), DBP (r = 0.41); and WC and SBP (r = 0.46), DBP (r = 0.50).
In general, the correlation between fasting in-sulin and HOMA-IR were slight but significant. The highest correlations for these measures were
established with WHR in men. Rocha et al.33,
found mild to moderate correlations between HOMA-IR and BMI (r = 0.50), WC (r = 0.49), WHR (r = 0.26) e WHtR (r = 0.51).
Abdominal obesity is directly linked to viscer-al fat which is indicative of a series of metabolic changes observed in this study such as decreased
HDL-C, hypertension and insulin resistance26. In
general the variables of abdominal obesity had a higher correlation with the factors of cardio-vascular risk than BMI, indicating that this type of obesity may be more related to cardiovascular
risk than general obesity as measured by BMI25.
One of the strengths of this study is the fact of working with a population-based sample, made up of young adults, a population in which there are few studies in Brazil. Furthermore, this study presents the association, as yet little stud-ied, between anthropometric indicators and insulin resistance. The Joint Interim Statement (JIS) was used, which is the most current crite-ria for the diagnosis of MS and considers low-er values for WC. The plow-ercentage of losses was satisfactory considering the proportions of the study (25.3%). In contrast, the rate of attendance at performing laboratory tests was low at 45.5%. As a result, it is possible that some estimates are overestimated if individuals who have attended the examinations are those who reported a high-er numbhigh-er of changes.
One limitation of the study was to have made the calculation of correlations using the Pear-son coefficient, which assumes normal distribu-tion. This was done to avoid underestimation of sampling errors. A comparison of the estimates obtained with the weighted Pearson correlation and the un-weighted Spearman and the values obtained with the Pearson correlation was per-formed in the same direction but were slightly higher. The p-values of the Spearman coefficient were also compared with the p-values obtained by linear regression with correction for the sam-pling delineation. Both provided similar and consistent estimates.
Conclusion
C
ar
v
alho CA
of these indicators for identifying individuals at risk.
The indicators that were most associated with cardiovascular risk factors were BMI, WC and WHR in females and WHR and WHtR in men. Anthropometric indicators of obesity correlat-ed more with the metabolic variables and blood pressure in females than in males.
All cardiovascular risk factors analyzed in this study are modifiable, so it reinforces the impor-tance of encouraging the adoption of a healthier life style in the public studied.
Collaborations
e C
ole
tiv
a,
20(2):479-490,
2015
Third Report of the National Cholesterol Education Program (NCEP) Expert Panel on Detection, Evalua-tion, and Treatment of High Blood Cholesterol in Adults (Adult Treatment Panel III) final report. Circu-lation 2002; 106:3143-3421.
Pitanga FJG, Lessa I. Associação entre indicadores de obesidade e risco coronariano em adultos na cidade de Salvador, Bahia, Brasil. Rev Bras Epidemiol 2007; 10(2):239-248.
Alberti KG, Zimmet P, Shaw J. Metabolic syndrome--a new world-wide definition. A Consensus Statement from the International Diabetes Federation. Diabet
Med 2006; 23(5):469-480.
Ybarra J, Sanchez-Hernandez J, Pou J, Fernandez S. An-thropometrical measures are easily obtainable sensitive and specific predictors of insulin resistance in healthy individuals. Prevent Control 2005; 1(2):175-181. Geloneze B, Vasques ACJ, Stabe CFC, Pareja JC, Rosado LEFPL, Queiroz EC, Tambascia MA; BRAMS Investi-gators. HOMA1-IR and HOMA2-IR indexes in identi-fying insulin resistance and metabolic syndrome – Bra-zilian Metabolic Syndrome Study (BRAMS). Arq Bras Endocrinol Metab 2009; 53(2):281-287.
Matsudo S, Araújo T, Matsudo V, Andrade D, Andrade E, Oliveira LC, Braggion G. Questionário Internacio-nal de Atividade Física (IPAQ): estudo de validade e reprodutibilidade no Brasil. Rev Ativ Fís Saúde 2001; 6(2):5-18.
Scattolin FAA, Diogo MJD, Colombo RCR. Correla-ção entre instrumentos de qualidade de vida relacio-nada à saúde e independência funcional em idosos com insuficiência cardíaca. Cad Saude Publica 2007; 23(11):2705-2715.
Rezende FAC, Rosado LEFPL, Ribeiro RCL, Vidigal FC, Vasques ACJ, Bonard IS, Carvalho CR. Índice de massa corporal e circunferência abdominal: associação com fatores de risco cardiovascular. Arq. Bras. Cardiol. 2006; 87(6):728-734.
Nascente FMN, Jardim PCBV, Peixoto MRG, Monego ET, Barroso WKS, Moreira HG, Vitorino PVO, Scala LN. Hipertensão arterial e sua associação com índices antropométricos em adultos de uma cidade de peque-no porte do interior do Brasil. Rev Assoc Med Bras 2009; 55(6):716-722.
Gharakhanlou R, Farzad B, Agha-Alinejad H, Steffen LM, Bayati M. Medidas antropométricas como predi-toras de fatores de risco cardiovascular na população urbana do Irã. Arq Bras Cardiol 2012; 98(2):126-135. Krause MP, Hallage T, Gama MPR, Sasaki JE, Miculis CP, Buzzachera CF, Silva SG. Associação entre Perfil Li-pídico e Adiposidade Corporal em Mulheres com Mais de 60 Anos de Idade. Arq Bras Cardiol 2007; 89(3):163-169.
Mascena GV, Cavalcante MSB, Marcelino GB, Holanda SA, Brandt CT. Fatores de risco cardiovascular em estu-dantes da Faculdade de Ciências Médicas de Campina Grande. Medicina (Ribeirão Preto) 2012; 45(3):322-328.
Onat A, Uyarel H, Hergenc G, Karabulut A, Albayrak S, Can G. Determinants and definition of abdominal obesity as related to risk of diabetes, metabolic syndro-me and coronary disease in Turkish syndro-men: A prospective cohort study. Atherosclerosis 2007; 191(1):182-190. 16.
17.
18.
19.
20.
21.
22.
23.
24.
25.
26.
27.
28. References
Bozza R, Neto AS, Ulbrich AZ, Vasconcelos IQA, Mas-carenhas LPG, Brito LMS, Campos W. Circunferência da cintura, índice de massa corporal e fatores de risco cardiovascular na adolescência. Rev Bras Cineantropom Desempenho Hum 2009; 11(3):286-291.
Carnelosso ML, Barbosa MA, Porto CC, Silva SA, Car-valho MM, Oliveira ALI. Prevalência de fatores de risco para doenças cardiovasculares na região leste de Goiâ-nia (GO). Cien Saude Colet 2010; 15(Supl. 1):1073-1080.
Ferreira JS, Aydos RD. Prevalência de hipertensão arte-rial em crianças e adolescentes obesos. Cien Saude Colet 2010; 15(1):97-104.
Oliveira MAM, Fagundes RLM, Moreira EAM, Trinda-de EBSM, Carvalho T. Relação Trinda-de Indicadores Antro-pométricos com Fatores de Risco para Doença Cardio-vascular. Arq. Bras. Cardiol. 2010; 94(4):478-485. Fonseca FL, Brandão AA, Pozzan R, Campana EMG, Pizzi OL, Magalhães MEC, Freitas EV, Brandão AP.A relação entre a pressão arterial e indices antropométri-cos na infância/adolescência e o comportamento das variáveis de risco cardiovascular na fase adulta jovem em seguimento de 17 anos: Estudo do Rio de Janeiro. Rev SOCERJ 2008; 21(5):281-290.
Silva DAS, Lima LRA, Dellagrana RA, Bacil EDA, Rech CR. Pressão arterial elevada em adolescentes: prevalên-cia e fatores assoprevalên-ciados. Cien Saude Colet 2013; 18(11): 3391-3400.
Moreira TMM, Gomes EB, Santos JC. Fatores de risco cardiovasculares em adultos jovens com hipertensão arterial e/ou diabetes mellitus. Rev Gaúcha Enferm. 2010; 31(4):662-669.
Haun DR, Pitanga FJG, Lessa I. Razão cintura/estatura comparado a outros indicadores antropométricos de obesidade como preditor de risco coronariano elevado. Rev Assoc Med Bras 2009; 55(6):705-711.
Beck CC, Lopes AS, Pitanga FJG. Indicadores antropo-métricos de sobrepeso e obesidade como preditores de alterações lipídicas em adolescentes. Rev. paul. pediatr. 2011; 29(1):46-53.
Meller FO, Ciochetto CR, Santos LP, Duval PA, Vieira MFA, Schafer AA. Associação entre circunferência da cintura e índice de massa corporal de mulheres brasi-leiras: PNDS 2006. Cien Saude Colet 2014; 19(1):75-82. Vasques ACJ, Rosado LEFPL, Rosado GP, Ribeiro RCL, Franceschini SCC, Geloneze B, Priore SE, Oliveira DR. Habilidade de indicadores antropométricos e de com-posição corporal em identificar a resistência à insulin. Arq Bras Endocrinol Metab 2009; 53(1):72-79. Matos LM, Giorelli GV, Dias CB. Correlation of an-thropometric indicators for identifying insulin sensiti-vity and resistance. Sao Paulo Med J 2011; 129(1):30-35. Petribú MMV, Cabral PC, Arruda IKG. Estado nutri-cional, consumo alimentar e risco cardiovascular: um estudo em universitários. Rev. Nutr. 2009; 22(6):837-846.
World Health Organization (WHO). Obesity: preven-ting and managing the global epidemic. Geneva: WHO; 1998. (Report of a WHO Consultation on obesity). Cuppari L. Nutrição clínica no adulto: Guias de medici-na ambulatorial e hospitalar, UNIFESP- escola paulista de medicina. 2ª ed. Barueri: Ed. Manole; 2005. 1.
2.
3.
4.
5.
6.
7.
8.
9.
10.
11.
12.
13.
14.
C
ar
v
alho CA
Pinho CPS, Diniz AS, Arruda IKG, Batista Filho M, Co-elho PC, Sequeira LAS, Lira PIC. Prevalência e fatores associados à obesidade abdominal em indivíduos na faixa etária de 25 a 59 anos do Estado de Pernambuco, Brasil. Cad Saude Publica 2013; 29(2):313-324. Kachani AT, Brasiliano S, Hochgraf PB. O impacto do consumo alcoólico no ganho de peso. Rev. Psiq. Clín. 2008; 35(Supl. 1): 21-24.
Zemdegs CS, Corsi LB, Coelho LC, Pimentel GD, Hirai AT, Sachs A. Lipid profile and cardiovascular risk fac-tors among first-year Brazilian university students in São Paulo. Nutr Hosp 2011; 26(3):553-559.
Oliveira EO, Velásquez-Melendez G, Kac G. Fatores demográficos e comportamentais associados à obe-sidade abdominal em usuárias de centro de saúde de Belo Horizonte, Minas Gerais, Brasil. Rev Nutr 2007; 20(4):361-369.
Rocha NP, Siqueira-Catania A, Barros CR, Pires MM, Folchetti LD, Ferreira SRG. Análise de diferentes me-didas antropométricas na identificação de síndrome metabólica, com ou sem alteração do metabolismo gli-cídico. Arq Bras Endocrinol Metab 2010; 54(7):636-643. Ferreira AP, Ferreira CB, Brito CJ, Pitanga FJG, Moraes CF, Naves LA, Nóbrega OT, França NM.Predição da Síndrome Metabólica em Crianças por Indicadores Antropométricos. Arq Bras Cardiol 2011; 96(2):121-125.
Article submitted 24/03/2014 Approved 19/06/2014
Final version submitted 21/06/2014 29.
30.
31.
32.
33.