FREE THEMES
1 Secretaria da Pós-Graduação em Saúde Coletiva, Universidade Federal de Pernambuco. Hospital das Clínicas Bloco E/4º/NUSP s/n, Cidade Universitária. 50670-901 Recife PE Brasil. [email protected]
Economic growth and inflation rate: implications for municipal
revenue and health expenditure of the municipalities
of Pernambuco, Brazil
Abstract This paper analyzes the implications of municipal budget revenue growth and the mone-tary policy’s inflation rates goals in the availabil-ity of public health resources of municipalities. This is a descriptive, exploratory, quantitative, retrospective and longitudinal cross-sectional study covering the period 2002-2011. We ana-lyzed health financing and expenditure variables in the municipalities of the state of Pernambuco, Brazil, describing the trend and the relationship between them. Data showed the growth of the variables and trend towards homogeneity. The exception was for the participation of Intergov-ernmental Transfers in the Total Health Expen-diture of the Municipality. We found a significant correlation between Budget Revenue per capita and Health Expenditure per capita and a strong significant negative correlation between Inflation Rate, Budget Revenue per capita and Health Ex-penditure per capita. We concluded that increased health expenditure is due more to higher munic-ipal tax revenue than to increased transfers that, in relative terms, did not increase. The strong in-verse relationship between inflation rate and the Financing and Expenditure variables show that the monetary policy’s inflation goals have restrict-ed health financing to municipalities.
Key words Decentralization, Inflation, Health care financing
Marciana Feliciano1
Adriana Falangola Benjamin Bezerra1
Fe
liciano M
Introduction
In the 1970s and 1980s, decentralization became an important principle of public sector reforms in several countries. In those emerging from au-thoritarian experiences, as in the case of Brazil, decentralization has also been understood as an
essential realm of democratization1. In response
to redemocratization and Health Reform move-ments, health decentralization began to appear as a guideline enshrined in the 1988 Federal Con-stitution.
It is worth mentioning that this guideline was aligned with both the neoliberal interests and aspirations of the Health Reform activists. In the case of the former, decentralization is a way of guiding the restructuring of the public/ private mix, decentralizing both responsibilities and funding to subnational levels and to the private sector. In the neoliberal conception, the decentralization guideline also facilitates a flex-ible management, separating the financial role
from the service provision role2. In the case of the
latter, the decentralization guideline was under-stood as a realm of democracy and, thus, aligned with its socializing and democratizing agenda. In the list of interests were also those of the munic-ipalist movement, which was keen on bringing the sharing of political and financial power to municipalities and pushed hard for a move
to-wards decentralization3.
The structuring legal instruments of the Unified Health System (SUS) have been estab-lished throughout the 1990s. Among them, Law Nº 8.080/1990, which links decentralization to municipalization, and Law Nº 8.142/1990, which confers greater managerial capacity to states and
municipalities4,5. In addition to these laws, the
Basic Operational Standards (NOB), the Health Care Operational Standards (NOAS), the Health Pact, Constitutional Amendment Nº 29/2000, Complementary Law Nº 141/2012 and Decree Nº 7.508/2012, among other normative legal in-struments, progressively broadened the norma-tive basis for structuring the SUS
implementa-tion process6.
The orientation of the decentralization pro-cess has changed over the course of these regula-tions. NOBs guided the decentralization process towards municipalization, establishing subna-tional management spheres of the SUS, states and municipalities, favoring the latter, which now ex-tend their responsibilities and their implementa-tion in public health acimplementa-tions and services. NOAS reoriented decentralization, recovering the role
of the states towards the regionalization of health actions and services. These changes occurred due to the financial and political limitations of the municipalities in ensuring comprehensive health care to the population. The Health Pact continues on the pathway of regionalization, establishing the federative co-responsibility for the provision of health actions and services, calling for account-ability among entities. In the current setting, De-cree N° 7.508/2011, which regulates Law Nº 8.080, seeks to establish the basis for the regionalization of Health Care Networks. This decree establishes the Organizing Contract for Public Health Action (COAP), which aims to “organize and integrate health actions and services, under the respon-sibility of federative entities in a Health Region,
aiming at ensuring users’ comprehensive care”7.
The issue of health decentralization is not limited to its underpinning normative base, and considering that its implementation is strongly linked to the mechanisms of public health fi-nancing, it is inevitable to discuss the Brazilian
fiscal federalism model. Lima8,9 affirms that there
are two main criticisms by fiscal federalism ex-perts to the Brazilian tax system, governed by the 1988 Constitution and other subsequent legal norms, which are vertical imbalances (between spheres of different levels) and horizontal im-balances (between spheres of the same level of government). The aforementioned author states that vertical imbalances are generated by the fed-eral entity’s high taxation power, as opposed to the spending needs of subnational entities due to the greater responsibilities assumed. On the other hand, horizontal imbalances are due to the socioeconomic inequalities between the entities of the same governing body, which determine differentiated capacities of service provision by these entities with comparable taxation systems. Horizontal imbalances also derive from the dif-ferent needs of public spending due to the differ-ent needs and demands of the population. These imbalances mark Brazilian fiscal federalism and have a strong implication in the national and
universal implementation of the health policy9.
The role of coordinating these imbalances would be incumbent on Federal Government. However, this role was hampered by economic ri-gidity resulting from the macroeconomic adjust-ment policy experienced by Brazil in the post-88 period, with the expenditure contingency to en-sure compliance with fiscal goals to enen-sure
gener-ation of primary surpluses9,10.
e C
ole
tiv
a,
22(6):1979-1990,
2017
public spending through the restrictive fiscal
policy11. In the 1990s, the inflation goal scheme
monetary policy is implemented, where interest rates are managed to keep inflation at technically feasible and socially acceptable levels. This culmi-nated in a restrictive fiscal policy subordiculmi-nated to the monetary policy, with the justification of
re-ducing or even not generating a public deficit 11.
In the name of macroeconomic stability, the Federal Government has maneuvered to over-come the loss of revenues related to the decen-tralization of tax competencies and the increase of constitutional transfers, such as the State ticipation Fund (FPE) and the Municipal Par-ticipation Fund (FPM). Among measures taken, we mention the increased rates of social contri-butions; their cost contingency management for economic stabilization funds, such as the Divest-ment of Federal GovernDivest-ment Revenue (DRU); the growing lack of accountability in relation to social policies, justified by decentralization; and the stagnation of the Income Tax (IR) and the Tax on Industrialized Products (IPI), which
mostly underpin the FPE and FPM9.
In the same perspective, we have gazed at the Northeast Region of Brazil , more specifically, the state of Pernambuco, which, in recent years, has shown a process of accelerated economic growth. According to data from the Brazilian Institute of Geography and Statistics (IBGE), the state evidenced, in the period 2000-2010, a percentage increase of Gross Domestic Product (GDP) equivalent to 253.08%, higher than Bra-zil (219.64%) and the Northeast macro-region
(245.65%)12. This growth was mainly driven by
industry, services and agriculture sectors13. It
should be noted that these activities have reper-cussions on several taxes, which are the basis for calculating the municipalities’ own resources to be allocated to public health actions and services. We can directly mention the Tax on Industrial-ized Products (IPI), Tax on Circulation of Goods and Services (ICMS) and the Tax on Services of any Nature (ISS).
This last tax is collected in the jurisdiction of the municipality and the others are collected by the states, with the exception of IPI, which is the responsibility of the Federal Government. Al-though the collection of these taxes is incumbent on different subnational entities, a percentage of them is transferred to the municipalities, by means of shares or FPM, as is the case of IPI.
Notwithstanding, the municipalities of Per-nambuco showed, between 2000 and 2007, a percentage increase of 190.76% in health
munic-ipal expenditure per inhabitant, corresponding to R$ 183.79, on average, for 2007. This amount (R$ 261.43) was well below national average for that year and, in the context of the federation and ranked Pernambuco ahead of only Acre (R$ 165.1) and Amapá (R$ 167.4). With regard to the municipalities of the other states of the Northeast, the municipalities of Pernambuco had the lowest
health expenditure per capita in the Region14.
In addition to the reflections raised by the health decentralization process and adjustment to macroeconomic policy, and when Pernam-buco undergoes remarkable economic growth, which has produced a positive impact on the budgets of municipalities located in the areas with the highest concentration of investments, we should consider the importance that contri-bution of resources to the municipal budget rev-enue may represent to the strengthening of the health policy.
Thus, considering that the composition of the health revenue under the responsibility of the municipality consists of own resources that the municipality collects and by the transfers received from the Federal Government and the States and that most Brazilian municipalities al-ready invest in health a percentage of their own resources higher than the minimum prescribed by Constitutional Amendment Nº 29/2000, we can assume that the increased absolute value of that revenue is dependent on the increase of the global revenue of the municipalities or the
in-creased value of transfers14.
In this perspective, this paper discusses the dynamics of health financing in the municipal entity, starting from the following premises: 1) economic growth has an impact on growth of the municipal budget revenue; and 2) the macro-economic adjustment based on the inflation tar-get-based monetary policy shrinks the volume of Federal Government transfers to the municipali-ties. Hence, we try to answer the following ques-tion: what are the implications of municipal bud-get revenue growth and the inflation tarbud-get-based monetary policy on health expenditure?
Methodology
Fe
liciano M The analysis period was defined (2002-2011)
taking into account the significant growth of the state of Pernambuco in those years, as indicated by data from IBGE and State Agency of Planning and Research of Pernambuco (CONDEPE/FI-DEM), among other agencies. The choice of such series was also based on the period of operation of the Public Health Budget Information System (SIOPS), the main system to be used for the col-lection of secondary data on public health financ-es and budgets. The Ministry of Health institu-tionalized the SIOPS in 2000, but it only homog-enized the calculation of indicators in 2002. The period chosen also covers the period in which Constitutional Amendment Nº 29/2000 enters into force. In addition, the final milestone of the series has been set, seeking to ensure that data from all years are fully published by DATASUS.
It is important to note that, during the pe-riod under review, data reporting in the SIOPS was not mandatory and subject to penalties for managers. These implications only occurred with the publication of Complementary Law Nº 141, dated January 13, 2012. Therefore, this fact can be pointed out as a limitation for the findings of this study.
The state of Pernambuco is made up of 184 municipalities plus the Fernando de Noronha ter-ritory, which was excluded from the sample selec-tion process, as well as the municipalities of More-no and Caetés, because they did More-not show data referring to the Budget Revenue throughout the series of the Brazilian Financial system (FINBRA).
The sample selection was of a non-probabilis-tic type and built on the measurement of the per-centage growth of the budget revenue per capita between the years of the series (2002-2011). We selected municipalities by establishing the first and third quartiles as cutoff points. Therefore, municipalities with a percentage growth of per capita budget revenue lower than the first quar-tile (477.30%) and municipalities with values higher than the third quartile (623.98%) were selected, which made up the group of munici-palities with the lowest percentages of growth in per capita budget revenue and the group of municipalities with the highest percentages of growth of said variable, respectively, GROUP 1 and GROUP 2. The sample consisted of 90 mu-nicipalities allocated to both groups, each with 45 municipalities.
Two public access information systems were consulted to collect the study the variables: FIN-BRA and SIOPS. Monetary variables expressed in absolute values were deflated by the Broad
Na-tional Consumer Price Index (IPCA) for 2011, excluding the effect of inflation on the values to ensure comparability between the series years. The variables underpinning the database of this study were the following:
- Budget revenue per capita;
- Total Health Expenditure, under the re-sponsibility of the Municipalities, per inhabitant (Health Expenditure per capita);
- Percentage of intergovernmental transfers in the total health expenditure of the municipali-ty in relation to the total health municipal expen-diture (Intergovernmental Transfers in the Total Health Expenditure of the Municipality);
- Inflation rate (IPCA).
The database was ready to be analyzed using software Excel 2007 and SPSS Statistics®
(Statis-tical Package for the Social Sciences®), version
20.0 for Microsoft Windows. Statistical analysis occurred in three stages:
First stage
In the first stage, descriptive statistics used built on central tendency measures (mean and median) and dispersion (minimum, maximum and standard deviation) variables: Budget Reve-nue per capita and Health Expenditure per capita; We also described the trend perspective of study variables, throughout the historical series (2002-2011) by means of a yearly median for all 90 selected municipalities, GROUP 1 and GROUP 2, illustrated with trend charts, which made it possible to compare the evolution of variables between the two groups.
The analyses used the median – central ten-dency measure – in order to minimize the influ-ence that the isolated extreme values, known as outliers, exert on the results. Since the median is a real element and holds a central position in a series of data, it does not suffer interference from
these outliers15.
Then, we tested the difference in the distribu-tion of the variables between the two groups of municipalities through the non-parametric test of the median. The result of this test was illustrat-ed with boxplot type charts, which schematically aggregates five measures: minimum value, first quartile, median (second quartile), third quartile and maximum value.
Second stage
e C
ole
tiv
a,
22(6):1979-1990,
2017
variable and its association with Health Expendi-ture per capita was tested with Spearman’s Cor-relation Coefficient.
For the interpretation of the magnitude of correlations, the following classification of cor-relation coefficients (r) was used: weak, “r” values between 0.1 and 0.3; moderate, “r” between 0.4
and 0.6; and strong, “r” above 0.716. This
associ-ation was tested in all 90 municipalities and in GROUP 1 and GROUP 2 separately.
Third stage
In the third stage, the Inflation Rate (IPCA) was considered as an independent variable, asso-ciating it with the variables: Budget Revenue per capita, Health Expenditure per capita and Inter-governmental Transfers in Total Health Expendi-ture of the Municipality. We tested associations with Spearman’s Correlation Coefficient.
In the same way as in the previous moments, this analysis was carried out for all 90 municipal-ities of Pernambuco, as well as the two groups of municipalities separately.
Results and discussion
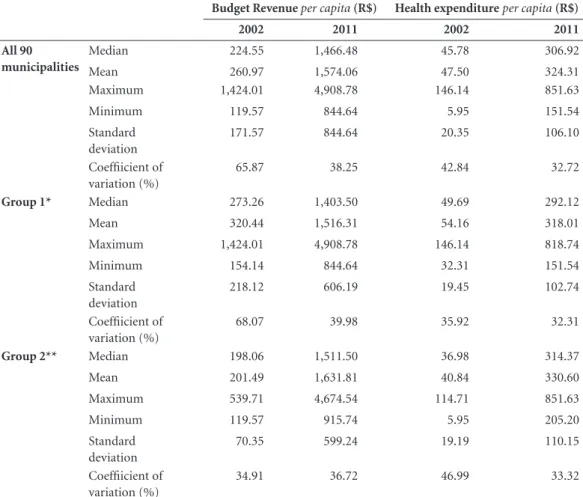
The measures of central tendency and dispersion for the variables of Health Financing and Health Expenditure, described in Table 1, confirmed the expected growth of variables, which occurred in GROUP 1, GROUP 2 and all 90 municipalities. Regarding Revenue, in 2002, all GROUP 1 mea-sures were higher than those of GROUP 2, while in 2011, this only held true for the maximum (R$ 4,908.78), standard deviation (606.19) and the coefficient of variation (39.98%). On analyzing Expenditure, in 2002, all GROUP 1 measures were higher except the coefficient of variation (35.92%) and, in 2011, this superiority was re-versed in favor of GROUP 2.
The expected growth of the Budget Revenue per capita was based on the economic growth of the state of Pernambuco, whose main sectors were industry, services and agriculture and
live-stock13.
Regarding the expected increase of Health Expenditure per capita, the guidelines of certain legal instruments, such as NOB, NOAS and Con-stitutional Amendment Nº 29/2000 were taken into account in addition to the state’s economic growth. Several other studies have pointed to the growth of both municipal revenue and
munici-pal health expenditure14,17-19.
Taking into account the coefficient of vari-ation in Table 1, the reduction of this measure is evident in both variables among all groups, except for the Budgetary Revenue per capita in GROUP 2, where the coefficient of variation increased from 34.91%, in 2002, to 36.72%, in 2011. The analysis of this measure shows that, between 2002 and 2011, these Health Financing and Expenditure variables became more homo-geneous among the municipalities of the study.
Araujo and Oliveira20 have collected the
ev-idence that intergovernmental transfers, par-ticularly those of the FPM, have minimized the enormous variance in the financing pattern of Brazilian municipalities. Based on the findings of these authors, it is assumed that the FPM can also explain the tendency towards homogeneity in the municipalities of our study.
Regarding the homogeneity of Health
Expen-diture per capita, the study by Leite et al.18 also
shows a trend towards uniformity of total health expenditure in municipalities of Rio Grande do Norte, in 2003, 2004 and 2005.
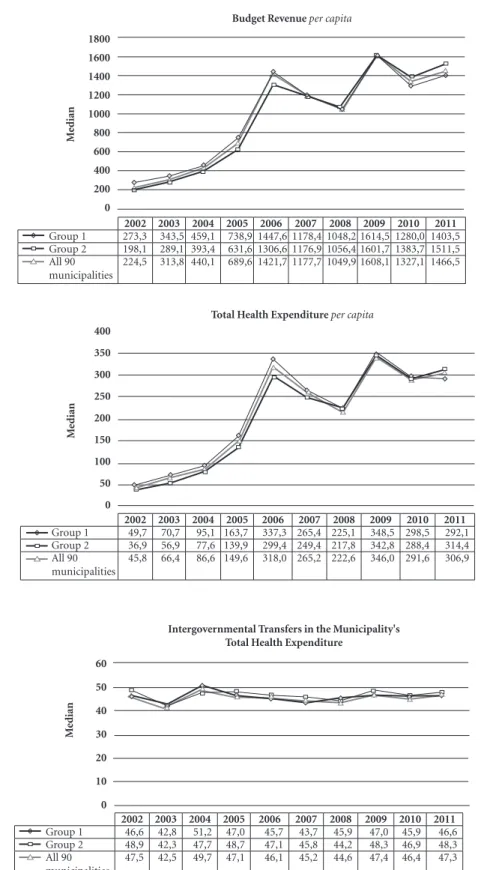
The trend of Health Financing and Expen-diture variables shown in Figure 1 coincides with the growth and inversion of the measures of these variables between the two groups, indi-cated in Table 1. As in Figure 1, at the beginning of the series, GROUP 1 had higher values than those of GROUP 2 for all Financing and Expen-diture variables, a situation that was reversed in the last year of the series, as shown in Table 1, where measures of central tendency and disper-sion of these variables in GROUP 2 were higher than in GROUP 1.
As described in the methods, GROUP 2 cor-responds to the municipalities of Pernambuco with the highest percentages of Budget Revenue per capita growth, so according to the first prem-ise used, it was already expected that this group would show a change in these variables.
The analysis of Figure 1 also indicates the similar behavior of these variables for the two groups of municipalities, with peaks in 2006 and 2009 and downturns in 2008 and 2010. In order to understand what factors might be linked to this, we resorted to literature in a macroeconom-ic approach, whmacroeconom-ich will be discussed later.
Fe
liciano M
Budget Revenue per capita growth, the statistical analysis outlined here did not show differences in the distribution of variables between them.
This finding confirms that growth was noted for all variables and in both groups, except for the share of Intergovernmental Transfers in the Total Health Expenditure of the Municipality, which stagnated at around 40%-50%.
Table 2 shows Spearman’s correlation coeffi-cients and p-values obtained through the associ-ation between the Budget Revenue per capita and the Health Expenditure per capita. Based on the data shown in the above table, there was a strong correlation between Budget Revenue per capita and Health Expenditure per capita (r = 0.988, p < 0.001) for both GROUP 1 and GROUP 2, as well as for all 90 municipalities. This strong cor-relation was also evidenced in studies by Espírito
Santo et al.14 and Nunes19.
The study by Espírito Santo et al.14, which
worked with all the municipalities of Pernambu-co aggregated by Regional Health Management (GERES), verified that the municipal budget per capita was strongly correlated with the health ex-penditure per capita of the municipalities, and this correlation went from moderate in 2000 to
strong in 2007. Nunes19 analyzed the relationship
between total health expenditure per capita and own per capita revenue of the municipalities of São Paulo, Espírito Santo and Ceará, and found the following respective r2 values: 82.1%, 64.8% and 46.6%, evidencing positive correlations. In other words, according to these authors, the higher the available income, the higher the health expenditure per capita.
Another important evidence pointed out in
the study by Espírito Santo et al.14 refers to the
finding that the average percentage of own
re-Table 1. Measures of central tendency and dispersion of the municipalities of Pernambuco. Pernambuco, Brazil, 2002-2011.
Budget Revenue per capita (R$) Health expenditure per capita (R$)
2002 2011 2002 2011
All 90 municipalities
Median 224.55 1,466.48 45.78 306.92
Mean 260.97 1,574.06 47.50 324.31
Maximum 1,424.01 4,908.78 146.14 851.63
Minimum 119.57 844.64 5.95 151.54
Standard deviation
171.57 844.64 20.35 106.10
Coeffiicient of variation (%)
65.87 38.25 42.84 32.72
Group 1* Median 273.26 1,403.50 49.69 292.12
Mean 320.44 1,516.31 54.16 318.01
Maximum 1,424.01 4,908.78 146.14 818.74
Minimum 154.14 844.64 32.31 151.54
Standard deviation
218.12 606.19 19.45 102.74
Coeffiicient of variation (%)
68.07 39.98 35.92 32.31
Group 2** Median 198.06 1,511.50 36.98 314.37
Mean 201.49 1,631.81 40.84 330.60
Maximum 539.71 4,674.54 114.71 851.63
Minimum 119.57 915.74 5.95 205.20
Standard deviation
70.35 599.24 19.19 110.15
Coeffiicient of variation (%)
34.91 36.72 46.99 33.32
* Set of municipalities with the lowest percentage growth of the per capita Budget Revenue. ** Set of municipalities with the highest percentage growth of the per capita Budget Revenue.
e C
ole
tiv
a,
22(6):1979-1990,
2017
Figure 1. Trend of the Financing and Expenditure variables, in the period of 2002-2011. Pernambuco, Brazil, 2002-2011.
Source: Own elaboration. 1800
1600 1400
1200
1000
800 600
400
200
0
Budget Revenue per capita
2002 2003 2004 2005 2006 2007 2008 2009 2010 2011
Group 1 273,3 343,5 459,1 738,9 1447,6 1178,4 1048,2 1614,5 1280,0 1403,5 Group 2 198,1 289,1 393,4 631,6 1306,6 1176,9 1056,4 1601,7 1383,7 1511,5 All 90
municipalities
224,5 313,8 440,1 689,6 1421,7 1177,7 1049,9 1608,1 1327,1 1466,5
M
edian
400
350
300
250
200
150
100
50
0
Total Health Expenditure per capita
2002 2003 2004 2005 2006 2007 2008 2009 2010 2011
Group 1 49,7 70,7 95,1 163,7 337,3 265,4 225,1 348,5 298,5 292,1 Group 2 36,9 56,9 77,6 139,9 299,4 249,4 217,8 342,8 288,4 314,4 All 90
municipalities
45,8 66,4 86,6 149,6 318,0 265,2 222,6 346,0 291,6 306,9
M
edian
Intergovernmental Transfers in the Municipality's Total Health Expenditure
2002 2003 2004 2005 2006 2007 2008 2009 2010 2011
Group 1 46,6 42,8 51,2 47,0 45,7 43,7 45,9 47,0 45,9 46,6 Group 2 48,9 42,3 47,7 48,7 47,1 45,8 44,2 48,3 46,9 48,3 All 90
municipalities
47,5 42,5 49,7 47,1 46,1 45,2 44,6 47,4 46,4 47,3
M
edian
60
50
40
30
20
10
Fe
liciano M Variable Boxplot p-valor
Annual Budget Revenue
per capita 0,641
Health Expenditure
per capita 0,053
Health Expenditure
per capita without the participation of transfers
0,053
Intergovernmental transfers in the municipality’s total health expenditure
1,000
Figure 2. Boxplot of Financing and Expenditure variables and Median’s non-parametric test results. Pernambuco, Brazil, 2002-2011.
Source: Own elaboration.
Group 1 Group 2
Group 1 Group 2
Group 1 Group 2
Group 1 Group 2
6.000,00
4.000,00
2.000,00
0,00
1.000,00
600,00 1.200,00
800,00
400,00
200,00
0,00
1.000,00
600,00 1.200,00
800,00
400,00
200,00
0,00
Grand Median = 108,78 Grand Median = 226,46 Grand Median = 1.048,32
Grand Median = 46,23 300,00
200,00
100,00
e C
ole
tiv
a,
22(6):1979-1990,
2017
sources invested in health by the municipalities in the state of Pernambuco already exceeded that provided by Constitutional Amendment Nº 29/2000. In 2007, with the exception of one, all other GERES already had a mean investment value of own resources between 17.01% and 22.26%.
Municipalities, in general, unlike the Federal Government and the states, since the introduc-tion of Constituintroduc-tional Amendment no. 29/2000, have always fulfilled the minimum health invest-ment percentage levels, even exceeding the mini-mum legal percentage (15%). This demonstrates that linkage of resources to the amendment did not change the health financing framework of
municipalities21.
However, it should be noted that, notwith-standing, the health expenditure per capita un-der the responsibility of the municipalities of Pernambuco is still very low, almost always below the national average, which is a strong obstacle to full decentralization in the supply and
manage-ment of health services in the state14.
In order to understand the causes of these ob-stacles, we go back to the second premise of the study, which addresses the relationship between
the inflation target-based monetary policy and the level of Federal Government transfers to the municipalities, in a macroeconomic discussion, assuming that macrostructural phenomena are implicated in health financing policy.
To investigate this premise, Spearman’s cor-relation coefficients and p-values between the Inflation Rate (IPCA) and Health Financing and Expenditure variables of the municipalities of Pernambuco were calculated.
Table 3 shows the measures of association between these variables, in which a strong sig-nificant correlation can be observed between In-flation Rate (IPCA), Budget Revenue per capita and Health Expenditure per capita. This strong correlation (r above 0.7) occurred for all 90 mu-nicipalities, GROUP 1 and GROUP 2. It is note-worthy that all Spearman’s correlation coefficient values were negative, indicating an inverse rela-tionship between variables, that is, when the In-flation Rate (IPCA) increases, Health Financing and Expenditure variables of the municipalities of Pernambuco listed here are reduced.
Again, analyzing Table 3, no significant re-lationship was identified between Inflation Rate (IPCA) and the share of Intergovernmental Transfers in the Total Health Expenditure of the Municipality, which is due to the fact that this variable did not suffer great variations in the pe-riod under study, as can be verified by reviewing Figure 1, in which it is observed that said percent-age was around 40%-50%.
The study by Soares and Santos22, when
ana-lyzing public health expenditure of federated en-tities between 1990 and 2012, found that the rel-ative participation of the Federal Government in health expenditure showed a marked decrease of 38.4%, while states had an increase of 87.2% and municipalities more than doubled their share in
Table 2. Relationship between Annual Budget Revenue per capita and Health Expenditure, under the responsibility of the Municipalities, per capita. Pernambuco, Brazil, 2002-2011.
Spearman p-valor All 90 municipalities 0,988 < 0,001 Group 1 0,988 < 0,001 Group 2 0,988 < 0,001
Source: Own elaboration.
Table 3. Relationship between Inflation Rate (IPCA) and Health Financing and Expenditure variables in the municipalities of the study. Pernambuco, Brazil, 2002-2011.
Annual Budget Revenue per capita
Health Expenditure
per capita
Intergovernmental transfers in the municipality’s total health
expenditure All 90
Municipalities
-0.723
(p = 0.018*)
-0.796
(p = 0.006**)
0.207
(p = 0.567)
Group 1 -0.796
(p = 0.006**)
-0.815
(p = 0.004**)
0,.073
(p = 0.841)
Group 2 -0.669
(p = 0.005*)
-0.723
(p = 0.018*)
0.030
(p = 0.934)
Fe
liciano M public health financing, rising from 12.10% in
1990 to 28.89% in 2012 – an increase of 138.8%. We should bear in mind that the Federal Government is the entity with the greatest share in health transfers to the municipality. Thus, it is necessary to discuss the relationship between this finding and two elements, namely, the Pro-visional Contribution on Financial Transactions (CPMF) and the Divestment of Federal Govern-ment Revenue (DRU).
The CPMF was in force from 1996 to 2007 and was supposedly exclusive for health, which was not respected and its resources were carried over to the Pension Fund and the Fund for Combating and Eradicating Poverty. Moreover, the incorpo-ration of funds from the CPMF for health was accompanied by losses from other revenues, such as the Contribution to Social Security Financing (COFINS) and Contribution on the Net
Prof-it of Companies (CSLL)23,24. In other words, the
CPMF, which would have the role of increasing Federal Government’s health financing ended up playing the role of replacing revenue losses. This is one of the explanatory factors for the stagna-tion of the Intergovernmental Transfers’ share in the Total Health Expenditure of the Municipality.
Another important element for the discus-sion on the screen is the DRU. This is a “maneu-ver” that carries 20% of the Federal Government’s budget to the primary surplus, applying to both
taxes and social contributions23,24, which limits
the availability of Federal Government funds to be transferred to municipalities for investment in health. Thus, while there is no DRU in munici-palities, this “maneuver” has direct implications on the availability of resources for this entity.
Both CPMF and DRU are fiscal adjustment mechanisms used by the Federal Government to meet the dictates of the macroeconomic stabi-lization policy and structural adjustment of the economy imposed by external agents,
multilater-al organizations and private interests25.
In addition to fiscal adjustment measures, we should consider the economic policy imple-mented in the country, also in line with macro-economic policy. In the current Brazilian con-text, the economic policy is practically limited to using a monetary policy and submitting a fiscal policy to achieve inflationary control. The infla-tion-target scheme has been implemented since the 1990s by many developed and
underdevel-oped countries11.
According to Leite and Almeida11, this
eco-nomic policy was put into practice, definitively,
with the implementation of the Real Plan when
there was a lower participation of the State in the economy that culminated in reduced public spend-ing via restrictive fiscal policy and a contraction-ary monetcontraction-ary policy with high interest rates, which serve as a precondition to the inflationary control discourse.
According to the monetary policy adopted, when inflation hikes, interest rates are managed by the Central Bank to keep inflation at low lev-els. In more detail, the inflation target-based pol-icy works with the following rationale: whenever inflation rises, interest rates and, consequently, public debt and public deficit increase. By using the justification of the public deficit, the Govern-ment limits social expenditure to settle public
debt11.
Advocates of this inflation target-based pol-icy argue that interest rates are high due to high government deficits. However, data analyzed by
Leite and Almeida11 dismantle this rationale. The
analysis of these authors shows that if debt in-terest was disregarded, the public deficit would be very small, achieving a surplus in some years. Thus, authors bring strong data that causality is the reverse: deficit and debt rise because interest rates are high, not the other way round. Conse-quently, to pay debt interest, the economy com-mits resources that should be invested in social areas, such as health. That is, what happens is the use of the primary surplus to pay the public debt instead of investing resources in social policies.
Conclusion
By describing the trend of the variables in the study, it can be seen that there was a significant growth of the Financing and Expenditure vari-ables in the municipalities of Pernambuco, al-though they were considered municipalities with different percentages of Budget Revenue per cap-ita growth.
In the setting of the state of Pernambuco that experienced significant economic growth during the study period, data corroborated with litera-ture by evidencing a statistically significant asso-ciation between budget revenue per capita and health expenditure per capita. This fact confirms the role of revenue in expanding and diversifying health expenditure.
e C
ole
tiv
a,
22(6):1979-1990,
2017
collection capacity is much lower than that of the Federal Government.
Then, the municipality’s own revenue role in own health financing is clear. Thus, we can infer that increased health expenditure is due to high-er municipality tax collection rathhigh-er than highhigh-er transfers, since these, in relative terms, did not grow during the period studied.
Despite the relationship between variables, which shows the inference of municipal own revenue to the growth of health expenditure, the availability of resources for the sector remains one of the great current challenges of the SUS, especially when it comes to municipal financing capacity. Even after the establishment of various legal provisions, such as Constitutional Amend-ment No. 29/2000 and CompleAmend-mentary Law Nº 141/2012, macro-structural impositions restrict the financing of the sector.
The strong inverse relationship between the Inflation Rate (IPCA), the Budget Revenue per capita and the Health Expenditure per capita are concrete data which prove that the alignment to the macroeconomic policy through the use of inflation target-based monetary policy restricts health financing.
The fact that the share of Intergovernmen-tal Transfers in the ToIntergovernmen-tal Health Expenditure of the Municipality remains stable also reflects the impact of restrictive fiscal measures on health investments. This finding is symptomatic of the need for the Federal Government to be more active in the financing since it is the entity with the largest collection capacity, or, maybe, going beyond, to question the extent to which the mu-nicipality will be able to manage the health of its territory, taking into account the principle of universality in a context of limited resources.
Thus, the health financing issue must take into account the interfederative relationships re-sulting from the fiscal federalism model imple-mented in the country, which is also a factor to be considered in the analysis of municipal health financing.
The inflation target-based monetary policy and the use of the primary surplus to pay public debt causes the state to shrink, which is felt main-ly by social areas such as health. Thus, beyond the federative question, the economic policy model used and its implications for SUS sustainability must be questioned.
Collaborations
M Feliciano worked on the design of the re-search, data collection and analysis and writing of this paper. AFB Bezerra worked on the design of research, data analysis and writing of this pa-per. ACG do Espírito Santo worked on the design of the research and writing of this paper.
Acknowledgements
Fe
liciano M
References
1. Melo MA. Crise federativa, guerra fiscal e “hobbesia-nismo municipal” efeitos perversos da descentraliza-ção? São Paulo Perspec 1996; 10(3):11-20.
2. Almeida CM. Reforma do Estado e reforma de sistemas de saúde: experiências internacionais e tendências de mudança. Cien Saude Colet 1999; 4(2):263-286. 3. Carvalho B, Costa AC. Da centralização à
descentrali-zação, da municipalização à terceirização: a quem com-pete a escolarização da criança brasileira hoje? Revista
Paulista de Educação 2012; 1(1):3-16.
4. Brasil. Lei nº 8.080, de 19 de setembro de 1990. Dispõe sobre as condições para a promoção, proteção e recu-peração da saúde, a organização e o funcionamento dos serviços correspondentes e dá outras providências. Di-ário Oficial da União 1990; 20 set.
5. Brasil. Lei nº 8.142, de 28 de setembro de 1990. Dispõe sobre a participação da comunidade na gestão do Sis-tema Único de Saúde (SUS) e sobre as transferências intergovernamentais de recursos financeiros na área da saúde e dá outras providências. Diário Oficial da União
1990; 31 set.
6. Brasil. Conselho Nacional de Secretários de Saúde (Co-nass). Legislação Estruturante do SUS. Brasília: Conass; 2011.
7. Brasil. Decreto nº 7.508, de 28 de junho de 2011. Regu-lamenta a Lei no 8.080, de 19 de setembro de 1990, para dispor sobre a organização do Sistema Único de Saúde - SUS, o planejamento da saúde, a assistência à saúde e a articulação interfederativa, e dá outras providências.
Diário Oficial da União 2011; 29 jun.
8. Lima LD. Conexões entre o federalismo fiscal e o fi-nanciamento da política de saúde no Brasil. Cien Saude
Colet 2007; 12(2):511-522.
9. Lima LD. Federalismo fiscal e financiamento descen-tralizado do SUS: balanço de uma década expandida.
Trab Educ Saude 2009; 6(3):573-597.
10. Oliveira FA, Rezende F. O Estado e a federação. In: Re-zende F, Tafner P, editores. Brasil: o estado de uma na-ção. Rio de Janeiro: Ipea; 2005. p. 252-283.
11. Leite KVBS, Almeida ACS. Aspectos Políticos e Teóri-cos da Relação entre Taxa de Juros, Inflação e Déficit Público. In: Anais do V Encontro Internacional da
As-sociação Keynesiana Brasileira (AKB); 2012; São Paulo.
p. 1-25.
12. Brasil. Instituto Brasileiro de Geografia e Estatística – IBGE [internet]. Tabela 21: Produto interno bruto a preços correntes, impostos, líquidos de subsídios, sobre produtos a preços correntes e valor adicionado bruto a preços correntes total e por atividade econômica, e res-pectivas participações/1999-2010. [acessado 2013 jan 8]. Disponível em: http://www.sidra.ibge.gov.br/bda/tabe-la/protabl.asp?c=21&z=p&o=39&i=P
13. Pernambuco. Secretaria Estadual de Saúde (SES). Ge-rência de Acompanhamento da Gestão Municipal. Re-latório Interno. Recife: SES; 2012.
14. Espírito Santo ACG, Fernando VCN, Bezerra AFB. Despesa pública municipal com saúde em Pernam-buco, Brasil, de 2000 a 2007. Cien Saude Colet 2012; 17(4):861-871.
15. Rouquayrol MZ. Introdução à Epidemiologia. Rio de Janeiro: Guanabara Koogan; 2006.
16. Dancey CP, Reidy J. Estatística sem matemática:usando
SPSS para Windows. Porto Alegre: Artmed; 2006.
17. Scatena JHG, Viana ALA, Tanaka OY. Sustentabilida-de financeira e econômica do gasto público em saú-de no nível municipal: reflexões a partir saú-de dados saú-de municípios mato-grossenses. Cad Saude Publica 2009; 25(11):2433-2445.
18. Leite VR, Lima KC, Vasconcelos CM. Financiamento, gasto público e gestão dos recursos em saúde: o ce-nário de um estado brasileiro. Cien Saude Colet 2012; 17(7):1849-1856.
19. Nunes AA. Alocação equitativa inter-regional de recursos públicos federais do SUS: a receita própria do município
como variável moderadora. Brasília: Ministério da
Saú-de (MS); 2004.
20. Araujo EA, Oliveira PAS. Receita municipal: a impor-tância das transferências do FPM e do SUS. Informe-se/
BNDES 2001; (28):1-8.
21. Mendes AN. Financiamento, gasto e gestão do Sistema Único de Saúde (SUS): a gestão descentralizada semiple-na e plesemiple-na do sistema municipal no estado de São Paulo
(1995-2001) [tese]. Campinas: Universidade Estadual
de Campinas; 2005.
22. Soares A, Santos NR. Financiamento do Sistema Único de Saúde nos governos FHC, Lula e Dilma. Saúde De-bate 2014; 38(100):18-25.
23. Dain S. Os vários mundos do financiamento da saúde no Brasil: uma tentativa de integração. Cien Saude Co-let 2007; 12(Supl.):1851-1864.
24. França JRM, Costa NR. A dinâmica da vinculação de recursos para a saúde no Brasil: 1995 a 2004. Cien Sau-de Colet 2011; 16(1):241-257.
25. Lima LD. Federalismo, Relações Fiscais e
Financiamen-to do Sistema Único de Saúde:a distribuição de receitas
vinculadas à saúde nos orçamentos municipais e estadu-ais [tese] Rio de Janeiro: Universidade do Estado do Rio de Janeiro; 2006.
Article submitted 10/11/2015 Approved 27/06/2015