Mixed-dentition analysis: Tomography versus
radiographic prediction and measurement
Letícia Guilherme Felício*, Antônio Carlos de Oliveira Ruellas**, Ana Maria Bolognese***, Eduardo Franzotti Sant’Anna****, Mônica Tirre de Souza Araújo****
Objective: The aim of this study was to evaluate the method for mixed-dentition analysis us-ing Cone-Beam Computed Tomography for assessus-ing the diameter of intra-osseous teeth and compare the results with those obtained by Moyers, Tanaka-Johnston, and 45-degree oblique radiographs. Methods: Measurements of mesial-distal diameters of erupted lower permanent incisors were made on plaster cast models by using a digital calliper, whereas assessment of the size of non-erupted permanent pre-molars and canines was performed by using Moyer’s table and Tanaka-Johnston’s prediction formula. For 45-degree oblique radiographs, both ca-nines and pre-molars were measured by using the same instrument. For tomographs, the same dental units were gauged by means of Dolphin software resources. Results: Statistic analysis revealed high agreement between tomographic and radiographic methods, and low agreement between tomographs and other methods being evaluated. Conclusion: Cone-Beam Computed Tomography was accurate for mixed-dentition analysis in addition to presenting some advantages over compared measurement methods: observation and measurement of intra-osseous teeth individually with the possibility, however, to view them from different prospects and without superimposition of anatomical structures.
Abstract
Keywords: Mixed dentition. Cone-Beam Computed Tomography. 45-degree oblique radiograph. Plaster cast.
* Student of Masters in Orthodontics, Faculty of Dentistry, Federal University of Rio de Janeiro – UFRJ.
** Master and Doctor of Orthodontics, UFRJ. Associate Professor of Orthodontics, School of Dentistry, Federal University of Rio de Janeiro – UFRJ. *** Master and Doctor of Orthodontics, Faculty of Dentistry, Federal University of Rio de Janeiro – UFRJ. Postdoctoral Fellow in Oral Biology - North-Western
University (USA). Professor of Orthodontics, School of Dentistry, Federal University of Rio de Janeiro – UFRJ.
intROduCtiOn
The majority of malocclusions involve prob-lems related to an imbalance between the dimen-sions of teeth and bone base.1 However, there is a short period of dentition development in which lower arch crowding is considered accept-able. When the lower permanent lateral incisor erupts into the oral cavity, an additional space of 1.6 mm, on average, is needed to allow correct alignment of all anterior teeth.2,3 In many cases, this dental crowding is transient and tends to re-solve spontaneously due to an increase in inter-canine distance, migration of deciduous inter-canines towards primate spaces, and a more labial po-sition of permanent incisors in relation to their deciduous antecessors.4 During this phase, it is important to analyse the mixed dentition to es-timate the diameter of non-erupted permanent teeth and to assess whether dental volume is in accordance with the bone base size.
Several methods have been developed aim-ing for this goal, and they can be briefly grouped into three categories: Those based on regression equations, those using radiographs, and those combining these both methods.5
Among them, Moyers’ analysis has been largely used because of its simplicity.6 Based on the fact that permanent teeth have highly proportional dimensions in a same individual, Moyers4 proposes a table with values for per-manent canines and pre-molars not yet erupt-ed, using as reference the diameter of perma-nent lower incisors.
Tanaka-Johnston’s formula is a practical man-ner of obtaining the same information, since no table is needed. The values for pre-molars and canines of an hemi-arch are defined by adding one-half of the mesial-distal diameter of the per-manent lower incisors to a pre-determined value regarding both lower and upper hemi-arches, re-spectively, 10.5 mm and 11.0 mm.7
Oblique radiographs at 45-degree angle have been cited as one of the most reliable methods
for obtaining diameters of non-erupted teeth be-cause it allows unilateral identification and clear visualization of posterior teeth.8-13 This method has a small magnification factor, little distortion compared to the lateral cephalometric radio-graph10 and tooth size is effectively measured and not estimated.
One of the possibilities of using computed tomography in orthodontics is the exact mea-surement of the mesial-distal diameter of teeth for evaluation of tooth-bone discrepancies14. Three-dimensional views generated by comput-ed tomographs allow rapid and efficient occlu-sion analysis, particularly in patients with mixed dentition as such images show erupted teeth as well as those erupting or developing. In addi-tion, their relative position and root formation are also provided.15
Due to the decrease in arch length, particu-larly the lower one, during transition from mixed to permanent dentition, the mixed-dentition analysis is usually applied to the mandible.16
In the present study, the main objective was to compare a new method for mixed-dentition analysis, which was based on computed tomo-graphic measurements, to those traditionally employed such as Moyers’ analysis, Tanaka-Johnston prediction table and 45-degree oblique radiography.
MAtERiALS And MEtHOdS
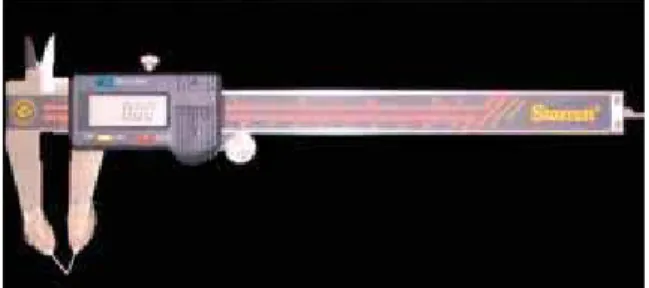
Plaster cast models were made from alginate impressions and the diameters of lower perma-nent incisors were obtained by using a digital cal-liper with precision of 0.02 mm and repetition precision of 0.01 mm (Starret, Itu, SP, Brazil). A device was made using acrylic resin and stainless steel wire and then adapted onto the tips of the digital calliper (Fig 1) to facilitate the measure-ment of tooth size. The maximum dental mesial-distal width was achieved by positioning the tips of calliper at the regions of contact point, parallel to occlusal or incisal surfaces and perpendicular to the tooth long axis. The values regarding the four incisors were added so that Moyers’ table could be used at 75% probability level and Tanaka-John-ston’s prediction formula applied, whereas the values regarding non-erupted permanent canines and pre-molars were used for prediction.
Oblique radiographs were taken at 45-degree angle during the Dental Radiology and Imaging Specialization Course at the Federal University of Rio de Janeiro (UFRJ). The radiographs of right and left sides of the same patient were taken by us-ing an orthopantomography unit (Rotograph Plus, Villa Sistemi Midicali, Buccinasco MI, Italy). The diameters of intra-osseous teeth appearing on the 45-degree oblique radiographs were also obtained by using a digital calliper. The greatest mesial-distal width of the teeth was determined visually.
Computed tomographs performed with i-CAT scan equipment were imported under DICOM file format by using Dolphin 3D V.11
software. The measurements of both erupted tooth diameter and arch perimeter were ob-tained by using tools of this software. Therefore, the long axis of each tooth was corrected in the three planes—axial, coronal, and sagittal (Figs 2 and 3). The technique employed in the measure-ment of intra-bony teeth in this study had been previously tested to evaluate erupted teeth and was very appropriate. The method using Cone-Beam Computed Tomography to measure tooth diameter could be considered valid.
The research project was reviewed and ap-proved by the Ethic Commission of Institute for Studies in Public Health of the Federal Univer-sity of Rio de Janeiro.
FIGURE 1 - Image of digital calliper used for measurements in plaster cast models, with its tips made of acrylic and stainless steel wire.
FIGURE 2 - A, B) Tomographic images whose segmentation and translu-cence were changed, showing (B) the possibility of visualization of intra-osseous teeth.
TABLE 1 - Descriptive statistical analysis of linear measurements (mm) rep-resenting the sum of permanent canines and premolars for right and left sides, performed with Cone-Beam Computed Tomography (CBCT), 45 de-gree radiographs and 45 dede-gree radiographs with magnification correction and derived from the Moyers table and from Tanaka-Johnston´s formula, including mean, standard deviation and minimum and maximum values.
TABLE 2 - Results of the statistical analysis used to evaluate agree-ment between measureagree-ments performed with Cone-Beam Computed Tomography, and those derived from the Moyers table and from Tanaka-Johnston´s formula, and 45 degree oblique radiographs.
RESuLtS
In order to determine precision, reliability, and capacity of measurement repetition, ten pairs of plaster cast models, ten 45-degree ra-diographs, and ten tomographs were randomly selected and then measured twice by the same investigator, with a 10-day interval between both measurements. The intra-class correlation rate was as high as 0.98 for plaster cast models, 0.97 for radiographs, and 0.99 for tomographs, thus indicating reliability of the measurements performed by the investigator.
The descriptive statistics containing mean, standard deviation, minimum and maximum values for the sum of right and left permanent canines and premolars in Cone-Beam Comput-ed Tomography (CBCT), in 45-degree radio-graphs, in 45-degree radiographs with correc-tion of magnificacorrec-tion and derived from Moy-ers’ table and Tanaka-Johnston’s formula are represented in Table 1.
The agreement between measurements of non-erupted teeth regarding tomography and those predicted by Moyers’ table and Tanaka-Johnston’s formula, including the 45-degree oblique radiographs, was evaluated by using both intra-class correlation rate and paired Student’s t test at 95% confidence interval (p<0.05). The results revealed high agreement between to-mographic and radiographic methods as well as low agreement between tomographs and other methods studied (Table 2).
diSCuSSiOn
Imaging diagnosis and study models are very important resources available in orthodontics. Within the context of conventional radiographic techniques, a varied number of exams (periapi-cal, panoramic, teleradiographic, profile, poste-rior-anterior, occlusal, and 45-degree oblique) are routinely employed for orthodontic evalua-tion of the craniofacial region. Nevertheless, the conventional radiography is a two-dimensional
n Mean SD Minimum Maximun
CBCT 30 46.44 2.57 39.40 52.90
Moyers’
table 28 44.62 1.42 44.62 48.60
Tanaka-John-ston’s Formula 29 44.07 1.47 44.07 47.62
45º X-ray 30 46.27 2.75 39.15 52.65
45º X-ray x 0.928 30 42.93 2.58 36.26 48.83
n ICC
Paired t-test
p value (p<0.05*)
Mean Difference (mm)
Moyers’ table 28 0.35 0.000* 2.00
Tanaka-John-ston’s Formula 29 0.41 0.008* 1.81
45º X-ray 30 0.97 0.273 0.25
45º X-ray x 0,928 30 0.82 0.000* 3.54
representation of three-dimensional structures and therefore there are some drawbacks in terms of precision and spatial orientation, size, shape, and relationship between anatomical structures regarding this method.18 Differently from the radiography, which projects the X-ray exposed objects into one plane, the Cone-Beam Comput-ed Tomography shows the relationships between structures in depth.14
Plaster cast models have limitations as well, since they have been traditionally measured manually by means of a calliper. Alternatively, measurements can be made on photocopies, photographs, holograms, and virtual models.19
n = size of sample, SD = standard deviation.
Among some advantages regarding the digital methods in relation to the manual measurement, one can cite shorter procedure time, no need to store study models, and easy access to diagnostic records from anywhere.6
The use of Cone-Beam Computed Tomog-raphy to evaluate tooth diameter has not been tested. Despite this, other studies20-24 pointed out such a possibility as quantitative analyses us-ing computed tomography were found to have high accuracy and precision. Measurements made directly on skull and on the tomograph-ic image of the same skull were entirely simi-lar. Precision and reproducibility of the method were confirmed by the presence of very few er-rors in the measurement repetitions, regardless of intra- and inter-examiner variability.14
In the evaluation of values regarding the sum of diameters of intra-osseous teeth, permanent pre-molars, and permanent canines measured on tomographic images and those measured using Moyers’ table and Tanaka-Johnston’s formula, statistical analysis showed low agreement be-tween both methods. However, studies on medi-cal tomographs of craniofacial region indicated that measurements up to 5% are clinically ac-ceptable,22 and this figure is higher than that ob-served in the present study.
In the orthodontic treatment planning, in-dividual variation represents an important fac-tor.2 All methods for predicting mesial-distal diameter of canine and pre-molars, such as the Moyers’ and Tanaka-Johnston’s analyses, do not take into account the individuality and then under or over-estimate actual den-tal dimensions.16 With the use of Cone-Beam Computed Tomography, teeth are measured instead of being estimated. Tomographic exam of one of the patients revealed the presence of macrodontia and abnormal shape of the second pre-molars. By consulting the Moyers’ table or Tanaka-Johnston’s formula only, such information would not be taken into account
and the space needed for the patient would be mistakenly predicted as being smaller. In another case, agenesis of second pre-molars was also observed on tomographs during the mixed-dentition analysis. For this patient, with absence of the second premolar, the Moyers’ table and Tanaka-Johnston’s formula could not be applied for purposes of comparison with the tomographic measurements, because it yields the sum of the canines and first and second premolars. For another, whose sum of measurements of lower incisors was so low that the Moyers’ table could not be used, the comparison with the tomographic measure-ments was also not possible. The sample, there-fore, consisted of 29 and 28 patients for the evaluation of tomography measurements with those suggested by the Tanaka-Johnston’s for-mula and Moyers’ table, respectively.
In turn, both radiographic and tomographic methods took into account individual variation (each tooth is measured during both exams), and a high agreement between them was ob-served. With regard to radiography, most cases (29.21%) involved rotated teeth. In this way, Cone-Beam Computed Tomography has some advantages in relation to the 45-degree oblique radiograph. The authors of the present study agree that three-dimensional imaging offers greater potential for quantitative evaluation of the skull and face because points are easily iden-tified and structures are not overlapped. There is also the possibility of moving the image three-dimensionally, which allows visualization of the object at different angles.
Interestingly, the radiographic method hav-ing image magnification correction did not yield better results than the tomography (Table 2). The teeth measured on tomographs were often greater than those measured on oblique radio-graphs, and the radiographic magnification cor-rection indeed enhanced such a difference.
According to Bernabé and Flores-Mir5, in 2005, the mixed-dentition analysis should pres-ent a minimum and known systematic error, allow easy replication by any basically trained operator, be quickly conducted, not require very sophisticated equipment, be directly applied to the mouth, and available for both dental arches. It is also important to emphasize that errors and time regarding the evaluation of the new method tend to be greater during this process of meth-od change. As the examiner proceeds with the procedures and has the opportunity to evaluate more tomographs, less variations between the methods are observed, a finding also reported by Rheude et al17 in 2005.
The radiation dose of this imaging modality is equivalent to approximately one sixth of that necessary for a medical tomography. In addition, Cone-Beam Computed Tomography is very similar to dental radiographs, providing more reliable and extensive information14,19,20,21,26-30. Its modest application is due mainly to the high cost of softwares that allow viewing and editing images, since their acquisition, given the cost of dental radiographs, is financially attractive be-cause the cost of the tomographic scan is equiv-alent to that of conventional orthodontic docu-mentation14. Through the years, the likelihood is
that such softwares become more accessible. The availability of such technology will undoubtedly extend the use and application of 3D images in orthodontics for clinical purposes23.
It is difficult to work with probabilities re-quiring accuracy, since human anatomy has inherent variations. There are several methods aimed to estimate the mesial-distal diameter of canines and pre-molars by means of tables, equations, and radiographs. Obtaining such values as closer to reality as possible by using these measurements is a challenge, since all may fail. The evaluation of the effectiveness of such methods is not meant to approve or reprove them, but to serve as a mechanism to assess how they can produce a reliable diagnosis. Therefore, allied to the prediction methods, a good profes-sional sense should exist in order to elaborate diagnosis more effectively7.
COnCLuSiOn
Mixed-dentition analysis by the tomograph-ic method is accurate and has some advantages in relation to other evaluated methods. It con-siders individual variations of dental anatomy, easy identification of points, no superposition of structures, and three-dimensional move-ment of image, which allows visualization at different angles.
ACKnOWLEdGMEntS
1. Shigenobu N, Hisano M, Shima S, Matsubara N, Soma K. Patterns of dental crowding in the lower arch and contributing factors. A statistical study. Angle Orthod. 2007 Mar;77(2):303-10. 2. Sayin MO, Türkkahraman H. Factors contributing to
mandibular anterior crowding in the early mixed dentition. Angle Orthod. 2004 Dec;74(6):754-8.
3. Lima Martinelli F, Martinelli de Lima E, Rocha R, Souza Tirre-Araujo M. Prediction of lower permanent canine and premolars width by correlation methods. Angle Orthod. 2005 Sep;75(5):805-8.
4. Moyers RE. Handbook of orthodontics. 4th ed. Chicago: Year
Book; 1988.
5. Bernabé E, Flores-Mir C. Are the lower incisors the best predictors for the unerupted canine and premolars sums? an analysis of a Peruvian sample. Angle Orthod. 2005 Mar;75(2):202-7.
6. Paredes V, Gandia JL, Cibrian R. New, fast, and accurate procedure to calibrate a 2-dimensional digital measurement method. Am J Orthod Dentofacial Orthop. 2005
Apr;127(4):518-9.
7. Marchionni VMT, Silva MCA, Araujo TM, Reis SRA. Avaliação da efetividade do método de Tanaka-Johnston para predição do diâmetro mésio-distal de caninos e pré-molares não-irrompidos. Pesqui Odontol Bras. 2001;15(1):35-40. 8. Cartwright LJ, Harvold E. Improved radiographic results in
cephalometry through the use of high kilovoltage. J Can Dent Assoc. 1954;1(6):251-4.
9. Barber TK, Pruzansky S, Lauterstein A, Kindelperger R. Application of roentgenographic cephalometry to pedodontic research. J Dent Child. 1960;7(2nd quart.):97-106.
10. Barber TK, Pruzansky S, Kindelperger R. An evaluation of the oblique cephalometric ilm. J Dent Child. 1961;28:94-105. 11. Ingervall B, Lennartsson B. Prediction of breadth of
permanent canines and premolars in the mixed dentition. Angle Orthod. 1978 Jan;48(1):62-9.
12. Paula S, Almeida MA, Lee PC. Prediction of mesiodistal diameter of unerupted lower canines and premolars using 45 degrees cephalometric radiography. Am J Orthod Dentofacial Orthop. 1995 Mar;107(3):309-14.
13. Bronzi ES, Sakima T, Sakima MT. Telerradiograia em norma de 45 graus: uma revisão de literatura. Rev Fac Odontol Inst Amaz Ens Sup. 2004 jul-dez;1:24-35.
14. Garib DG, Raymundo R Jr, Raymundo MV, Raymundo DV, Ferreira SN. Tomograia computadorizada de feixe cônico (Cone beam): entendendo este novo método de diagnóstico por imagem com aplicabilidade na Ortodontia. Rev Dental Press Ortod Ortop Facial. 2007 mar-abr;12(2):139-56. 15. Motta AT. Avaliação da cirurgia de avanço mandibular por
meio da superposição de modelos tridimensionais. [tese]. Rio de Janeiro (RJ): Universidade Estadual do Rio de Janeiro; 2007. 16. Melgaço CA, Sousa Araújo MT, Oliveira Ruellas AC.
Mandibular permanent irst molar and incisor width as predictor of mandibular canine and premolar width. Am J Orthod Dentofacial Orthop. 2007 Sep;132(3):340-5. REfEREnCES
17. Rheude B, Sadowsky PL, Ferriera A, Jacobson A. An evaluation of the use of digital study models in orthodontic diagnosis and treatment planning. Angle Orthod. 2005 May;75(3):300-4.
18. Oliveira AT. Aplicações da tomograia computadorizada cone beam em ortodontia: revisão de literatura [monograia]. Rio de Janeiro (RJ): Marinha do Brasil; 2007.
19. Zilberman O, Huggare JA, Parikakis KA. Evaluation of the validity of tooth size and arch width measurements using conventional and three-dimensional virtual orthodontic models. Angle Orthod. 2003 Jun;73(3):301-6.
20. Mozzo P, Procacci C, Tacconi A, Martini PT, Andreis IA. A new volumetric CT machine for dental imaging based on the cone-beam technique: preliminary results. Eur Radiol. 1998;8(9):1558-64.
21. Lascala CA, Panella J, Marques MM. Analysis of the accuracy of linear measurements obtained by cone beam computed tomography (CBCT-NewTom). Dentomaxillofac Radiol. 2004 Sep;33(5):291-4.
22. Hilgers ML, Scarfe WC, Scheetz JP, Farman AG. Accuracy of linear temporomandibular joint measurements with cone beam computed tomography and digital cephalometric radiography. Am J Orthod Dentofacial Orthop. 2005 Dec;128(6):803-11.
23. Periago DR, Scarfe WC, Moshiri M, Scheetz JP, Silveira AM, Farman AG. Linear accuracy and reliability of cone beam CT derived 3-dimensional images constructed using an orthodontic volumetric rendering program. Angle Orthod. 2008 May;78(3):387-95.
24. Brown AA, Scarfe WC, Scheetz JP, Silveira AM, Farman AG. Linear accuracy of cone beam CT derived 3D images. Angle Orthod. 2009 Jan;79(1):150-7.
25. Lima EMS, Monnerat ME. Comparação das predições do somatório dos diâmetros mésio-distais de pré-molares e caninos permanentes inferiores com seus valores reais [dissertação]. Rio de Janeiro (RJ): Universidade Federal do Rio de Janeiro; 1992.
26. Scarfe WC, Farman AG, Sukovic P. Clinical applications of cone-beam computed tomography in dental practice. J Can Dent Assoc. 2006 Feb;72(1):75-80.
27. Holberg C, Steinhäuser S, Geis P, Rudzki-Janson I. Cone-beam computed tomography in orthodontics: beneits and limitations. J Orofac Orthop. 2005 Nov;66(6):434-44. 28. Kau CH, Richmond S, Palomo JM, Hans MG.
Three-dimensional cone beam computerized tomography in orthodontics. J Orthod. 2005 Dec;32(4):282-93. 29. Nakajima A, Sameshima GT, Arai Y, Homme Y, Shimizu N,
Dougherty H Sr. Two- and three-dimensional orthodontic imaging using limited cone beam-computed tomography. Angle Orthod. 2005 Nov;75(6):895-903.
30. Ludlow JB, Davies-Ludlow LE, Brooks SL, Howerton WB. Dosimetry of 3 CBCT devices for oral and maxillofacial radiology: CB Mercuray, NewTom 3G and i-CAT. Dentomaxillofac Radiol. 2006 Jul;35(4):219-26.
Contact address
Antônio Carlos de Oliveira Ruellas
Av. Professor Rodolpho Paulo Rocco - Cidade Universitária CEP: 21.941-590 - Rio de Janeiro/RJ, Brazil
E-mail: [email protected]