5 6 9 5 6 9 5 6 9 5 6 9 5 6 9
Departamento de Medicina Preventiva da Faculdade de Medicina, Instituto do Coração do Hospital das Clínicas – FMUSP, SBC/FUNCOR and Departamento de Ateros-clerose da SBC
Mailing address: Ari Timerman – SBC/FUNCOR - Rua Beira Rio 45 - 3o - 04548-050
São Paulo, SP, Brazil
English version by Stela Maris C. e Gandour
Objective - To analyze the trends in risk of death due to cardiovascular diseases in the northern, northeastern, southern, southeastern, and central western Brazilian geographic regions from 1979 to 1996.
Methods - Data on mortality due to cardiovascular, cardiac ischemic, and cerebrovascular diseases in 5 Brazi-lian geographic regions were obtained from the Ministry of Health. Population estimates for the time period from 1978 to 1996 in the 5 Brazilian geographic regions were cal-culated by interpolation with the Lagrange method, based on the census data from 1970, 1980, 1991, and the po-pulation count of 1996, for each age bracket and sex. Trends were analyzed with the multiple linear regression model.
Results - Cardiovascular diseases showed a declining trend in the southern, southeastern, and northern Brazilian geographic regions in all age brackets and for both sexes. In the northeastern and central western regions, an increa-sing trend in the risk of death due to cardiovascular disea-ses occurred, except for the age bracket from 30 to 39 ye-ars, which showed a slight reduction. This resulted from the trends of cardiac ischemic and cerebrovascular diseases. The analysis of the trend in the northeastern and northern regions was impaired by the great proportion of poorly defined causes of death.
Conclusion - The risk of death due to cardiovascular, ce-rebrovascular, and cardiac ischemic diseases decreased in the southern and southeastern regions, which are the most developed regions in the country, and increased in the least developed regions, mainly in the central western region.
Key words: epidemiology, cardiovascular diseases, car-diac ischemic diseases, cerebrovascular di-seases, atherosclerosis
Arq Bras Cardiol, volume 77 (nº 6), 569-75, 2001
Ma r i a d e Fá t i m a Ma r i n h o d e Sou za , Ar i Ti m er m a n , Ca r l os Vi cen t e Ser r a n o Jr, Ra u l D. Sa n t os, An t on i o d e Pá d u a Ma n su r
São Paulo, SP - Brazil
Trends in the Risk of Mortality due to Cardiovascular Diseases
in Five Brazilian Geographic Regions from 1979 to 1996
Cardiovascular diseases are the major cause of death in developed countries 1-2. In Latin America, cardiovascular
diseases account for 1/3 of all deaths 3. They are also the
ma-jor cause of death in Brazil 4. When the total number of
dea-ths was considered, cardiovascular diseases accounted for 11.8%, 30.8%, and 28%, respectively, in the years 1930, 1980, and 1994. In 1994, the proportional mortality was 34% for individuals over the age of 30 years. The trend in morta-lity due to cardiovascular, cardiac ischemic, and cerebrovas-cular diseases has been declining in developed countries since the 1960s. The analysis performed by Uemura and Pisa5 showed a significant reduction in cardiovascular
di-seases in countries like Japan (-36.4% for males and –41.3% for females) and Australia (-32.1% for males and –39.2% for females), and a significant increase in most eastern Euro-pean countries (for example: 34.1% in Bulgaria and 31.3% in Poland). The same declining trend in mortality due to cardiac ischemic and cerebrovascular diseases has been observed in the municipality and state of São Paulo since 1976 6-9. The
decline in the risk of death due to cerebrovascular diseases in the municipality of São Paulo in the period from 1975 to 1981 was 13.6% for males and 8.5% for females 9. In Brazil, a
slight increase in the risk of death due to cardiovascular di-seases occurred from 1979 to 1984, and, after that, a progres-sive declining trend was observed until 1996 4. Most authors
believe that the decline in mortality due to cardiovascular di-seases in developed countries is mainly due to the control of risk factors 10,11. Improvement in diagnosis and medical
interventions has also helped patient survival 12. Other
stu-dies show that the treatment and control of arterial hyper-tension have contributed to the decline in cerebrovascular diseases 13,14. The objective of this study was to analyze the
trend in mortality from cardiovascular, cardiac ischemic, and cerebrovascular diseases in 5 Brazilian geographic regions according to sex and age bracket from 1979 to 1996.
Methods
ische-5 7 0 5 7 0 5 7 0 5 7 0 5 7 0
mic, and cerebrovascular diseases in the 5 Brazilian geo-graphic regions were obtained via the Ministry of Health for the period from 1979 to 1996 15. The population estimates
on the 1st of July of the years from 1978 to 1996 in the 5
Brazi-lian geographic regions were calculated using interpolation with the Lagrange method 16 based on census data from
1970, 1980, 1991, and the population count of 1996 for each age bracket and sex 17-20.
The multiple linear regression model was used 21.
In-formation on mortality due to all cardiovascular diseases was modeled, followed by data on mortality due to cardiac ischemic and cerebrovascular diseases. The natural loga-rithm of the raw coefficient (number of deaths/population estimated on the 1st of July) was used as a dependent
varia-ble. The cardiac ischemic and cerebrovascular diseases, the Brazilian geographic regions (Central Western, Northeast, North, Southeast, and South), sex, years in the calendar of the study, age bracket (30-39, 40-49, 50-59, 60-69, and above 70), and their respective interactions were the independent variables. The partial F test was performed to extract the nonsignificant interactions for the models. The objective was to reach the end of the modeling process with the lo-west number of possible interactions. Adjustment of the models was tested by the analysis of the residues and the correlation coefficients. Analysis of the residues was per-formed using graphs of the envelope type and graphs of the model residues versus adjusted values to assess the adjust-ment of the models adopted.
Results
The trends observed are shown as figures (figs. 1 to 6), where the coefficients are presented in natural logarithms, ac-cording to age bracket and sex, and also in 2 tables with raw coefficients for the years 1979, 1987, and 1996 of the series and the percentage variation between the years 1979 and 1996. The analysis of residues showed a good adjustment of the multiple linear regression model. A total of 3,764,265 deaths due to car-diovascular diseases, 1,113,281 deaths due to cardiac ischemic diseases, and 1,289,952 deaths due to cerebrovascular diseases was observed in the period from 1979 to 1996.
The coefficients and percentage variations of mortali-ty due to cardiovascular diseases are shown in table I. A de-clining trend in the incidence of cardiovascular diseases was observed in the southeastern, southern, and northern regions for all age brackets and both sexes in the period from 1979 to 1996. In the northeastern and central western re-gions, an increasing trend in the risk of death was observed for all age brackets analyzed, except for the 30-to-39-year in-terval. A reduction in the risk of death for the female sex in the age bracket from 40 to 49 years and above 70 years of age was observed in the central western region. At the be-ginning of the series in 1979, the risk of death due to cardio-vascular diseases was higher in the southeastern and sou-thern regions for all age brackets and both sexes. At the end of the series in 1996, this risk in the central western region exceeded that in the southern region in the age bracket
from 30 to 49 years and for both sexes. In the northeastern region, a lower risk than that in the other regions was obser-ved. However, this risk proved to be crescent, increasing 5%
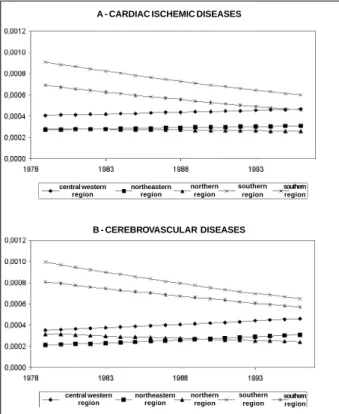
A - CARDIAC ISCHEMIC DISEASES
B - CEREBROVASCULAR DISEASES
Figure 1 – Model adjusted to the Brazilian geographic regions for the 40-to-49-year age bracket and the male sex, according to disease.
central western region
northeastern region
northern region
southern region
southern region central western
region
northeastern region
northern region
southern region
southern region
A - CARDIAC ISCHEMIC DISEASES
B - CEREBROVASCULAR DISEASES
Figure 2 - Model adjusted to the Brazilian geographic regions for the 40-to-49-year age bracket and the female sex, according to disease.
central western region
northeastern region
northern region
southern region
southern region
central western region
northeastern region
northern region
southern region
5 7 1 5 7 1 5 7 1 5 7 1 5 7 1
among females in the age bracket from 40 to 49 years, and 11% in the age bracket from 50 to 59 years. Among males, the risk increased 7% in the age bracket from 40 to 49 years and 12% in the age bracket from 50 to 59 years. In general, the northern region had the 2nd lowest risk of death, and the
drop in mortality was higher among males than among fema-les for the age bracket from 40 to 60 years.
The coefficients and percentage variations of mortali-ty due to cardiac ischemic diseases are shown in table II. Cardiac ischemic diseases exhibited a declining trend in the southern, southeastern, and northern regions for all age
A - CARDIAC ISCHEMIC DISEASES
B - CEREBROVASCULAR DISEASES
Figure 3 - Model adjusted to the Brazilian geographic regions for the 50-to-59-year age bracket and the male sex, according to disease.
central western
region northeasternregion northern
region southernregion southernregion
central western region
northeastern region
northern region
southern region
southern region
Figure 4 - Model adjusted to the Brazilian geographic regions for the 50-to-59-year age bracket and the female sex, according to disease.
central western region
northeastern
region northernregion
southern region
southern region
central western region
northeastern region
northern region
southern region
southern region A - CARDIAC ISCHEMIC DISEASES
B - CEREBROVASCULAR DISEASES
Figure 5 - Model adjusted to the Brazilian geographic regions for the 60-to-69-year age bracket and the female sex, according to disease.
A - CARDIAC ISCHEMIC DISEASES
B - CEREBROVASCULAR DISEASES central western
region northeasternregion
northern region
southern region
southern region
northeastern region central western
region northernregion
southern region southernregion
Figure 6 - Model adjusted to the Brazilian geographic regions for the 60-to-69-year age bracket and the male sex, according to disease.
central western region
northeastern region
northern region
southern region southernregion central western
region
northeastern region
northern region
southern region
southern region B - CEREBROVASCULAR DISEASES
5 7 2 5 7 2 5 7 2 5 7 2 5 7 2
brackets and for both sexes in the period from 1979 to 1996. In the central western and northeastern regions, an increase in cardiac ischemic diseases was observed for males and fe-males during this period. The risk of death in the central western region was higher than that in the northeastern re-gion; since the beginning of the observation period, howe-ver, the percentage variation in the risk of death has always been higher in the northeastern region than in the central western region. The highest risk of death was observed in the southeastern region for all age brackets and both sexes in the period studied. The southern region had the 2nd
hi-ghest risk of death, except for the year 1996 in the age bra-cket above 60 years. Both regions exhibited a declining trend in the risk of death, which was more marked in the sou-theastern region (figs. 1A to 6A).
The coefficients and percentage variations in mortality due to cerebrovascular diseases are shown in table II. Ce-rebrovascular diseases showed a declining trend in the southern, southeastern, and northern regions for all age brackets and both sexes in the period from 1979 to 1996. In the
central western and northeastern regions, an increase in ce-rebrovascular diseases was observed in the period studied for both sexes, except in the central western region in the age bracket from 30 to 39 years for both sexes and above 70 years for females, and in the northeastern region for females from 30 to 39 years and ≥70 years. The risk of death in the central western region was higher than that in the northeastern region, but the percentage variation of the risk of death showed great differences in the age bracket and sex. In the age bracket from 40 to 69 years, an increasing trend in the risk of death occurred, and it was similar for both sexes in the age bracket from 40 to 69 years, and higher for males in the age range from 50 to 59 years. The highest risk of death was observed in the southeastern region for all age brackets and both sexes in the period studied, except in the age bracket ≥70 years. The southern region had the 2nd highest risk of death, except in the year of 1996 for the
age bracket above 60 years, and in all the other years for the age bracket ≥70 years. In general, both regions showed a declining trend in the risk of death, which was more marked in the southe-astern region (figs. 1B to 6B).
Discussion
This study showed different trends in the risk of death due to cardiovascular diseases in 5 geographic Brazilian regions. The risk of death significantly increased in the cen-tral western region and decreased in the southeastern and southern regions of the country. In the northern region, a trend toward stability was observed, and, for some age brackets, a slight decline was seen. Therefore, an increase in mortality due to cardiovascular diseases in the less develo-ped regions and a reduction in the more develodevelo-ped ones were trends similar to those observed in eastern European countries (less developed countries) and in western coun-tries (more developed), respectively 22. In the northeastern
and central western regions, the risk of death from cardiac ischemic and cerebrovascular diseases increased, cardiac ischemic diseases playing the major role. Mortality due to cardiac ischemic diseases, even though increasing in the central western region, was more pronounced in the sou-thern and southeastern regions. The increase in cerebro-vascular diseases was more important in males and females of the central western and northeastern regions; in absolute figures, however, this risk was higher in the southeastern and southern regions. A study carried out in 8 Brazilian capitals also showed a higher incidence of mortality due to cardiovascular diseases in the age bracket from 30 to 69 ye-ars in the southern and southeastern Brazilian capitals 7.
The central western region ranked 3rd in the risk of death
due to cardiovascular diseases with the same increasing trend of that in the northeastern region. Cerebrovascular di-seases were the major cause of death in males and females. The risk of death due to cerebrovascular diseases was close to that of cardiac ischemic diseases in males however it was not true to women who presented a disproportionate greater cerebrovascular death rate. These findings were similar to those of the Brazilian population 4. The authors showed the
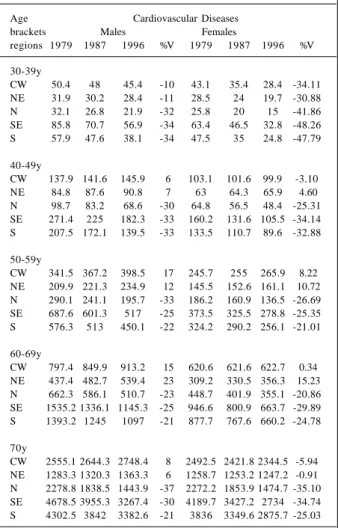
Table I – Risk of death due to cardiovascular diseases per 100,000 inhabitants estimated according to sex and age bracket for the years
1979, 1987, and 1996.
Age Cardiovascular Diseases brackets Males Females
regions 1979 1987 1996 %V 1979 1987 1996 %V
30-39y
CW 50.4 48 45.4 -10 43.1 35.4 28.4 -34.11 NE 31.9 30.2 28.4 -11 28.5 24 19.7 -30.88 N 32.1 26.8 21.9 -32 25.8 20 15 -41.86 SE 85.8 70.7 56.9 -34 63.4 46.5 32.8 -48.26 S 57.9 47.6 38.1 -34 47.5 35 24.8 -47.79
40-49y
CW 137.9 141.6 145.9 6 103.1 101.6 99.9 -3.10 NE 84.8 87.6 90.8 7 63 64.3 65.9 4.60 N 98.7 83.2 68.6 -30 64.8 56.5 48.4 -25.31 SE 271.4 225 182.3 -33 160.2 131.6 105.5 -34.14 S 207.5 172.1 139.5 -33 133.5 110.7 89.6 -32.88
50-59y
CW 341.5 367.2 398.5 17 245.7 255 265.9 8.22 NE 209.9 221.3 234.9 12 145.5 152.6 161.1 10.72 N 290.1 241.1 195.7 -33 186.2 160.9 136.5 -26.69 SE 687.6 601.3 517 -25 373.5 325.5 278.8 -25.35 S 576.3 513 450.1 -22 324.2 290.2 256.1 -21.01
60-69y
CW 797.4 849.9 913.2 15 620.6 621.6 622.7 0.34 NE 437.4 482.7 539.4 23 309.2 330.5 356.3 15.23 N 662.3 586.1 510.7 -23 448.7 401.9 355.1 -20.86 SE 1535.2 1336.1 1145.3 -25 946.6 800.9 663.7 -29.89 S 1393.2 1245 1097 -21 877.7 767.6 660.2 -24.78
70y
CW 2555.1 2644.3 2748.4 8 2492.5 2421.8 2344.5 -5.94 NE 1283.3 1320.3 1363.3 6 1258.7 1253.2 1247.2 -0.91 N 2278.8 1838.5 1443.9 -37 2272.2 1853.9 1474.7 -35.10 SE 4678.5 3955.3 3267.4 -30 4189.7 3427.2 2734 -34.74 S 4302.5 3842 3382.6 -21 3836 3349.6 2875.7 -25.03
5 7 3 5 7 3 5 7 3 5 7 3 5 7 3
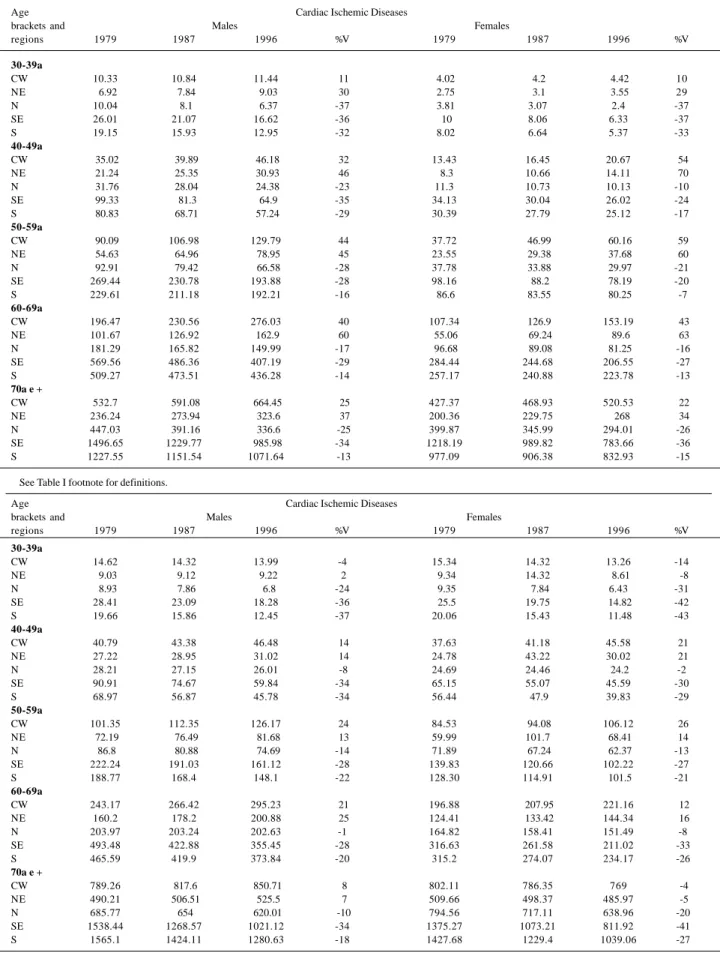
Table II – Coefficient of mortality due to cardiac ischemic and cerebrovascular disease per 100,000 inhabitants estimated according to sex and age bracket for the years 1979, 1987, and 1996.
Age Cardiac Ischemic Diseases
brackets and Males Females
regions 1979 1987 1996 %V 1979 1987 1996 %V
30-39a
CW 10.33 10.84 11.44 11 4.02 4.2 4.42 10
NE 6.92 7.84 9.03 30 2.75 3.1 3.55 29
N 10.04 8.1 6.37 -37 3.81 3.07 2.4 -37
SE 26.01 21.07 16.62 -36 10 8.06 6.33 -37
S 19.15 15.93 12.95 -32 8.02 6.64 5.37 -33
40-49a
CW 35.02 39.89 46.18 32 13.43 16.45 20.67 54
NE 21.24 25.35 30.93 46 8.3 10.66 14.11 70
N 31.76 28.04 24.38 -23 11.3 10.73 10.13 -10
SE 99.33 81.3 64.9 -35 34.13 30.04 26.02 -24
S 80.83 68.71 57.24 -29 30.39 27.79 25.12 -17
50-59a
CW 90.09 106.98 129.79 44 37.72 46.99 60.16 59
NE 54.63 64.96 78.95 45 23.55 29.38 37.68 60
N 92.91 79.42 66.58 -28 37.78 33.88 29.97 -21
SE 269.44 230.78 193.88 -28 98.16 88.2 78.19 -20
S 229.61 211.18 192.21 -16 86.6 83.55 80.25 -7
60-69a
CW 196.47 230.56 276.03 40 107.34 126.9 153.19 43
NE 101.67 126.92 162.9 60 55.06 69.24 89.6 63
N 181.29 165.82 149.99 -17 96.68 89.08 81.25 -16
SE 569.56 486.36 407.19 -29 284.44 244.68 206.55 -27
S 509.27 473.51 436.28 -14 257.17 240.88 223.78 -13
70a e +
CW 532.7 591.08 664.45 25 427.37 468.93 520.53 22
NE 236.24 273.94 323.6 37 200.36 229.75 268 34
N 447.03 391.16 336.6 -25 399.87 345.99 294.01 -26
SE 1496.65 1229.77 985.98 -34 1218.19 989.82 783.66 -36
S 1227.55 1151.54 1071.64 -13 977.09 906.38 832.93 -15
See Table I footnote for definitions.
Age Cardiac Ischemic Diseases
brackets and Males Females
regions 1979 1987 1996 %V 1979 1987 1996 %V
30-39a
CW 14.62 14.32 13.99 -4 15.34 14.32 13.26 -14
NE 9.03 9.12 9.22 2 9.34 14.32 8.61 -8
N 8.93 7.86 6.8 -24 9.35 7.84 6.43 -31
SE 28.41 23.09 18.28 -36 25.5 19.75 14.82 -42
S 19.66 15.86 12.45 -37 20.06 15.43 11.48 -43
40-49a
CW 40.79 43.38 46.48 14 37.63 41.18 45.58 21
NE 27.22 28.95 31.02 14 24.78 43.22 30.02 21
N 28.21 27.15 26.01 -8 24.69 24.46 24.2 -2
SE 90.91 74.67 59.84 -34 65.15 55.07 45.59 -30
S 68.97 56.87 45.78 -34 56.44 47.9 39.83 -29
50-59a
CW 101.35 112.35 126.17 24 84.53 94.08 106.12 26
NE 72.19 76.49 81.68 13 59.99 101.7 68.41 14
N 86.8 80.88 74.69 -14 71.89 67.24 62.37 -13
SE 222.24 191.03 161.12 -28 139.83 120.66 102.22 -27
S 188.77 168.4 148.1 -22 128.30 114.91 101.5 -21
60-69a
CW 243.17 266.42 295.23 21 196.88 207.95 221.16 12
NE 160.2 178.2 200.88 25 124.41 133.42 144.34 16
N 203.97 203.24 202.63 -1 164.82 158.41 151.49 -8
SE 493.48 422.88 355.45 -28 316.63 261.58 211.02 -33
S 465.59 419.9 373.84 -20 315.2 274.07 234.17 -26
70a e +
CW 789.26 817.6 850.71 8 802.11 786.35 769 -4
NE 490.21 506.51 525.5 7 509.66 498.37 485.97 -5
N 685.77 654 620.01 -10 794.56 717.11 638.96 -20
SE 1538.44 1268.57 1021.12 -34 1375.27 1073.21 811.92 -41
S 1565.1 1424.11 1280.63 -18 1427.68 1229.4 1039.06 -27
5 7 4 5 7 4 5 7 4 5 7 4 5 7 4
importance of the risk of death due to cerebrovascular diseases, and, therefore, the need for greater investment in detection and treatment of systemic arterial hypertension, the major risk factor for cerebrovascular diseases 23-25. This
is probably the most prevalent risk factor in the Brazilian population and also in patients with coronary artery disease. Therefore, primary and secondary prevention for cardiovascular diseases should initially include the control of arterial hypertension to promote or intensify the declining trend in the risk of death due to cardiovascular diseases. This trend was observed in the southern and southeastern regions, probably resulting from the better identification and control of risk factors, as occurs in more developed countries 26-28.
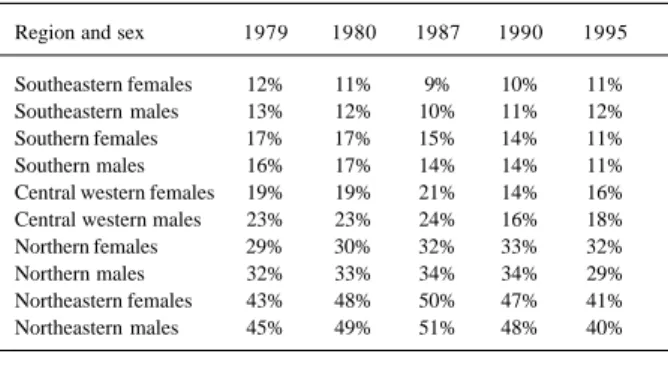
The increase in the risk of death in the central western and northeastern regions may have been partially affected by: (1) an improvement in diagnosis of causes of death, and a decrease in poorly defined symptoms, signs, and afflicti-ons from 19% to 16% among females and from 23% to 18% among males at the end of the period; (2) an increase in urba-nization; and (3) a change in the socioeconomic condition in these regions. Improvement in the diagnosis of the cause of death most probably explains, in part, the increasing trend in the risk of death due to cardiovascular diseases in these regions. In the northeastern and central western regions, the proportion of poorly defined deaths was very high, but it showed a gradual decreasing trend between 1979 and 1996. The reduction in the number of poorly defined deaths observed in these regions may have artificially revealed the increasing trend in the risk of death due to cardiovascular diseases. This results from the fact that cardiovascular di-seases may account for most poorly defined deaths. There-fore, the reduction observed in poorly defined deaths during the period from 1979 to 1996 results from and explains the increase in the risk of death due to cardiovascular disea-ses in these regions. Changes in the socioeconomic condi-tions, even though attractive, may not have played a similar
Table III – Proportion of deaths due to poorly defined symptoms, signs, and afflictions* according to the geographical region and sex
in individuals above the age of 30 years.
Region and sex 1979 1980 1987 1990 1995
Southeastern females 12% 11% 9% 10% 11% Southeastern males 13% 12% 10% 11% 12% Southern females 17% 17% 15% 14% 11% Southern males 16% 17% 14% 14% 11% Central western females 19% 19% 21% 14% 16% Central western males 23% 23% 24% 16% 18% Northern females 29% 30% 32% 33% 32% Northern males 32% 33% 34% 34% 29% Northeastern females 43% 48% 50% 47% 41% Northeastern males 45% 49% 51% 48% 40%
* External causes excluded.
role in the increased trend. On the contrary, the improve-ment in these conditions is associated with a reduction in the risk of death due to cardiovascular diseases 29-31.
Data on mortality existing in the information system of the Ministry of Health are subject to limits imposed by the problems that may exist in the origin of these data. Among these problems, we may cite the following: diagnostic er-rors, deficiencies in filling out death certificates, existence of a proportion of deaths with no clear cause, and typing er-rors. Studies validating the information on mortality were carried out in the municipality of São Paulo and they sho-wed a good quality of data 32,33; this type of study, however,
does not exist for most states and cities of the country. An indirect indicator of data quality is the proportion of death certificates with poorly defined symptoms, signs, and afflic-tions as the diagnosis of the cause of death. Good quality data are expected to have a small proportion of this type of diagnosis. In this regard, the northeastern region has the greatest proportion of undefined diagnoses of mortality, which, in 1995, accounted for up to 40% of the deaths. In 1995, 30% of the deaths in the northern region were poorly defined. In the central western region, 20% of the deaths were poorly defined, the lowest rates being observed in the southeastern and southern regions, around 11%. No signi-ficant difference existed according to sex (tab. III).
In conclusion, the risk of death due to cardiovascular, cerebrovascular, and cardiac ischemic diseases is decrea-sing in the southern and southeastern regions, which are the most developed regions in the country, and increasing in the less developed regions, mainly in the northeastern and central western regions. The analysis of the trend in the nor-thern, northeastern, and central western regions was impai-red by the great proportion of poorly defined causes of dea-th. The increase in the incidence of cerebrovascular and cardiac ischemic diseases in these regions for some age brackets may mean that the risk is higher than that observed simply due to the nonexistence of a diagnosis of the cause of death. The northern region showed a slight decline in the risk of death for some age brackets. The 30% rate of po-orly defined causes of death in this region may mean the existence of a higher risk. However, other studies are requi-red to help understand the trends observed, mainly in the northern, northeastern, and central western regions. Prima-ry and secondaPrima-ry prevention, mainly through identification and control of the major risk factors, such as arterial hyper-tension and dyslipidemia, should be emphasized in our health services.
Acknowledgments
5 7 5 5 7 5 5 7 5 5 7 5 5 7 5
1. American Heart Association. Heart and Stroke Facts, 1998. Dallas: AHA, 1998. 2. The WHO MONICA project. A worldwide monitoring system for
cardiovascu-lar disease. World Health Stat Ann 1989; 27: 149.
3. Lotufo PA. Epidemiologia das doenças isquêmicas do coração no Brasil. In: Les-sa, I. O adulto brasileiro e as doenças da modernidade. HUCITEC/ABRASCO, 115-22, SP/RJ, 1998.
4. Mansur AP, Favarato D, Souza MFM, et al. Tendência da mortalidade por doenças circulatórias no Brasil de 1979 a 1996. Arq Bras Cardiol 2001; 76: 497-503. 5. Uemura K, Pisa, Z. Recent trends in cardiovascular disease mortality in 27
indus-trialized countries. Wld Hlth Statist Quart1985; 38: 142-57.
6. Lotufo PA, Lólio CA. Tendência da mortalidade por doença isquêmica do coração no estado de São Paulo: 1970 a 1989. Arq Bras Cardiol 1993; 61: 149-53. 7. Chor D, Fonseca MJM, Andrade CR, Waissmann W, Lotufo PA. Doenças
Cardio-vasculares: panorama da mortalidade no Brasil. In Minayo MC (ORG.): Os Muitos Brasis. Ed HUCITEC/ABRASCO, SP/RJ, 1995.
8. Laurenti R. The decline of cardiovascular diseases as a cause of death. Rev Saúde Pública 1986; 20: 341-2.
9. Lólio CA, Laurenti R. Tendência da mortalidade por doença cerebrovascular em adultos maiores de 20 anos de idade no Município de São Paulo (Brasil), 1950-1981. Rev Saúde Pública 1986; 20: 343-6.
10. Walker WJ. Changing U.S. lifestyle and declining vascular mortality – A retros-pective. N Engl J Med 1983; 308: 649-51.
11. Kuulasmaa K, Tunstall-Pedoe H, Dobson A, et al. Estimation of contribution of changes in classic risk factors to trends in coronary-event rates across the WHO MONICA Project populations. Lancet 2000; 355: 675-87.
12. Collins R, Peto R, MacMahon S, et al. Blood pressure, stroke, and coronary heart di-sease. Part 1, Prolonged differences in blood pressure: prospective observational studies corrected for the regression dilution bias. Lancet 1990; 335: 827-38. 13. Eluf-Neto J, Lotufo PA, Lólio CA. Tratamento da hipertensão e declínio da
mor-talidade por acidentes vasculares cerebrais. Rev Saúde Pública 1990; 24: 332-6. 14. Sytkowski PA, Kannel WB, D’Agostino RB. Changes in risk factors and the de-cline of mortality from cardiovascular disease. N Engl J Med 1990; 322: 1635-41. 15. Ministério da Saúde. Fundação Nacional da Saúde. DATASUS. Sistema de infor-mação sobre mortalidade 1979-1997: dados de declaração de óbito. [CD-ROM]. Brasília, 1998.
16. Cláudio DM, Marins JM. Cálculo numérico computacional. São Paulo: Atlas, 1989.
17. Fundação IBGE. Censo demográfico Goiás: VIII Recenseamento Geral-1970. Rio de Janeiro, 1973. (Série Regional, I).
18. Fundação IBGE. Censo demográfico: dados gerais-migração-instrução-fecun-didade-mortalidade. Rio de Janeiro, 1982. (Recenseamento geral do Brasil 1980, 9: v.1, t.4).
References
19. Fundação IBGE. Censo demográfico 1991: resultados do universo relativo às características da população e dos domicílios. Rio de Janeiro, 1994. n.27: Goiás. 20. Fundação IBGE. Contagem da população 1996. Rio de Janeiro, 1997. v.1. (Resultados relativos a sexo da população e situação da unidade domiciliar). 21. Neter J, Kutner MH, Nachtschiem CJ, Wasserman W. Applied Linear Statistical
Models. 4th ed. Chicago: Irwin Series in Statistics, 1996: p.217-489, 567-614.
22. Stegmayr B, Vinogradova T, Malyutina S, Peltonen M, Nikitin Y, Asplund K. Widening gap of stroke between East and West. Eight-year trends in occurrence and risk factors in Russia and Sweden. Stroke 2000; 31: 2-8.
23. Mcgovern PG, Burke GL, Sprafka JM, Xue S, Folsom AR, Blackburn H. Trends in mortality, morbidity, and risk factor levels for stroke from 1960 through 1990. The Minnesota Heart Survey. JAMA 1992; 268: 753-9.
24. Modan B, Wagener DK. Some epidemiological aspects of stroke: mortality/mor-bidity trends, age, sex, race, socioeconomic status. Stroke 1992; 23: 1230-6. 25. Derby CA, Lapane KL, Feldman HA, Carleton RA. Trends in validated cases of
fatal and nonfatal stroke, stroke classification, and risk factors in southeastern New England, 1980 to 1991: data from the Pawtucket Heart Health Program. Stroke 2000; 31: 875-81.
26. Haskell WL, Alderman EL, Fair JM, et al. Effects of intensive multiple risk factor reduction on coronary atherosclerosis and clinical cardiac events in men and wo-men with coronary artery disease. The Stanford Coronary Risk Intervention Project (SCRIP). Circulation 1994; 89: 975-90.
27. Gillum RF. Trends in acute myocardial infarction and coronary heart disease death in the United States. J Am Coll Cardiol 1994; 23: 1273-7.
28. McGovern PG, Pankow JS, Shahar E, et al. Recent trends in acute coronary heart disease - mortality, morbidity, medical care, and risk factors. The Minnesota Heart Survey Investigators. N Engl J Med 1996; 334: 884-90.
29. Iribarren C, Luepker RV, McGovern PG, Arnett DK, Blackburn H. Twelve-year trends in cardiovascular disease risk factors in the Minnesota Heart Survey. Are socioeconomic differences widening? Arch Intern Med 1997; 157: 873-81. 30. Osler M, Gerdes LU, Davidsen M, et al. Socioeconomic status and trends in risk
factors for cardiovascular diseases in the Danish MONICA population, 1982-1992. J Epidemiol Community Health 2000; 54: 108-13.
31. Hoeymans N, Smit HA, Verkleij H, Kromhout D. Cardiovascular risk factors in relation to educational level in 36 000 men and women in The Netherlands. Eur Heart J 1996; 17: 518-25.
32. Laurenti R. Características da mortalidade por doença isquêmica do coração em adultos de 15 a 74 anos no município de São Paulo. Arq Bras Cardiol 1981; 36: 95-9.