Point of view/Coluna opinião
Calculating germination measurements and organizing spreadsheets
MARLI A. RANAL
1,5, DENISE GARCIA DE SANTANA
2, WANESSA RESENDE FERREIRA
3and
CLESNAN MENDES-RODRIGUES
4(received: April 24, 2008; accepted: October 14, 2009)
ABSTRACT – (Calculating germination measurements and organizing spreadsheets). With the objective to minimize diffi culties for beginners we are proposing the use of a conventional spreadsheet for the calculations of the main germination (or emergence) measurements, the organization of the fi nal data for the statistical analysis and some electronic commands involved in these steps.
Key words - germination rate, germination time, seed germination, synchrony, uncertainty
RESUMO – (Calculando medidas de germinação e organizando planilhas eletrônicas). Com o objetivo de minimizar as difi culdades dos iniciantes, estamos propondo o uso de planilhas eletrônicas convencionais para o cálculo das principais medidas de germinação (ou emergência), a organização dos dados fi nais para a análise estatística e alguns comandos eletrônicos envolvidos nesses passos.
Palavras-chave - germinação de sementes, incerteza, sincronia, tempo de germinação, velocidade de germinação
1. Universidade Federal de Uberlândia, Instituto de Biologia, Caixa Postal 593, 38400-902 Uberlândia, MG, Brazil.
2. Universidade Federal de Uberlândia, Instituto de Ciências Agrárias, Caixa Postal 593, 38400-902 Uberlândia, MG, Brazil.
3. Universidade Federal de Uberlândia, Instituto de Ciências Agrárias, Programa de Pós-graduação em Agronomia, Caixa Postal 593, 38400-902 Uberlândia, MG, Brazil.
4. Universidade Federal de Uberlândia, Instituto de Biologia, Programa de Pós-graduação em Ecologia e Conservação de Recursos Naturais, Caixa Postal 593, 38400-902 Uberlândia, MG, Brazil.
5. Corresponding author: [email protected]
Scientifi c urgency is determined by the need for its use. Many people have been contacting us since we published the book on the analysis of the germination process Análise da germinação: um enfoque estatístico, (Santana & Ranal 2004), but in a special way, people from other countries have been making inquiries after the publication of the review relating to this subject (Ranal & Santana 2006).
People have been inquiring about our procedures for the calculation of the germination measurements. The book, written in Portuguese, has some intermediate tables, essential for encouraging the user, but the review is only theoretical. Members of the examining board of the Master Degree Dissertation of the third author suggested the inclusion of an annex containing the intermediate tables to facilitate the work in Forest Seed Laboratories. Without doubt researchers could save time training the new members in their laboratories and beginners could have more autonomy to study and organize their data
having these instructions on hand. Besides, instructions relating to the manipulation of spreadsheets usually are omitted from papers.
Thus, the purpose of this note is to facilitate the calculations of the main germination measurements (valid for seedling emergence) by means of the use of a conventional spreadsheet, the organization of the
fi nal data for the statistical analysis and also to show some Excel commands involved in these steps. The six measurements here presented are being used by us because each one measures only one aspect of the germination process including capacity (germinability or seedling emergence), time spent to germinate or emerge (mean germination time), speed (mean germination rate), homogeneity (coeffi cient of variation of the germination time), uncertainty, and synchrony (see limitations of each measurement in Ranal & Santana 2006).
To obtain accurate results, fi rstly it is necessary to be punctual and for this, each evaluation must be made at the same time, as was planned, in hours or days. Secondly, we must be organized and the spreadsheets have been programmed to assist us.
Supposing that you are collecting data of one experiment every 24 hours from seed sowing and you are going to prepare your fi rst table. In the fi rst column of this table, collection dates should be written (see table 1). In the second column (ti) the time in days must be
so on, with the result reported in hours. It is necessary to enter the number of seeds germinated at the observation (not the accumulated values) in the third column (ni). The
second and third are the two most valuable columns of this table (ti and ni), giving support to the construction of the subsequent columns with commands from the Excel program, for example. The mathematical expressions used in each column are presented in table 1, the Excel commands of each cell in table 2, and the calculus made using such expression for seeds of Anadenanthera
colubrina (Vell.) Brenan are presented in table 3. The
fi rst and the seventh rows of table 1 have mathematical expressions to make their recognition easier as part of the general expressions for the germination measurements (see references mentioned). It is recommended that in the spreadsheets more simple symbols should be adopted as in tables 3 and 4. This simple form dispenses the use of the “Microsoft Equation” at this stage of the work. Excel commands were used in the tables here included due to their easy access.
The row of the last germination of the experiment (see the ni column of all sheets) is the limit to write the
germination measurements as was expressed in row 9 of table 1. This position will facilitate the use of an important Excel command when the general sheet of the experiment is constructed. The expressions and Excel commands for the most important germination measurements are presented below based on the cells of table 3.
Germinability is the germination percentage. Excel command: =C17/A19*100 (C17 is the intersection between column C and row 17 of the sheet; number of sowed seeds is in A19; for the example of table 3 this number is 25). Insert the n value in A19.
Mean germination time is calculated by the
expression , where ti: time from the start of the
experiment to the ith observation (day for the example); ni: number of seeds germinated in the ith time (not the
accumulated number, but the number correspondent to the ith observation), and k: last time of germination. Excel
command: =D17/C17.
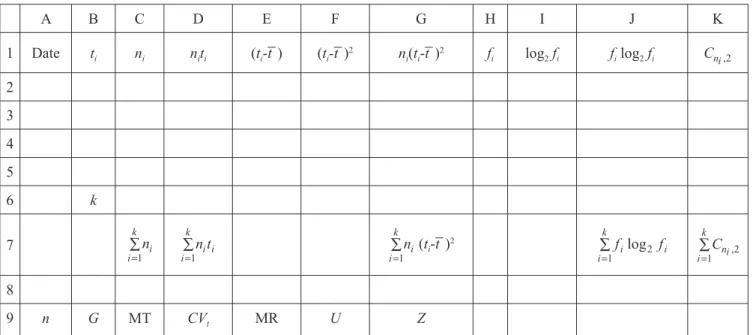
Table 1. General organization of the data for the calculation of the mean germination time and its variability measurements as recommended by Labouriau (personal communication), mean germination rate, uncertainty, and synchrony of the germination process. This table must be prepared with data collected from one experimental unit as one Petri dish, one germination box or other container. (ti: time between the sowing and the i
th (day or hour) observation; n
i: number of seeds germinated in the
observation time (not the accumulated number, but the number registered in the ith observation); t : mean germination time;
k: last time of germination; fi: relative frequency of germination; log2fi: logarithm of the relative frequency of germination to
the base 2; : combination of the seeds germinated in the ith time, two by two; G: germinability; t = MT in the sheet; CV
t:
coeffi cient of variation of the germination time; v: mean germination rate = MR in the sheet; U: uncertainty of the germination process; Z: synchrony of the germination process; A to K are the names of the columns of the sheet; 1 to 9 are the numbers of the rows of the sheet).
A B C D E F G H I J K
1 Date ti ni niti (ti-t ) (ti-t )
2 n
i(ti-t )
2 f
i log2fi fi log2fi
2 3 4 5
6 k
7 (ti-t )2
8
Variance of germination time is calculated by the
expression , where t : mean germination
time; ti: time between the start of the experiment and the ith observation (day for the example); n
i: number
of seeds germinated in the ith time, and k: last time of
germination. The variance value will be used to calculate the CVt (see the command below).
Coeffi cient of variation of the germination time
is calculated by the expression , where
st: standard deviation of the germination time and t : mean germination time. Excel command: =SQRT(G17/ (C17-1))/C19*100. Replications or samples with only one seed germinated do not have the value of this measurement because the divisor of the variance of the germination time is zero.
Mean germination rate is calculated as the reciprocal of the mean germination time. Excel command: =1/C19.
Uncertainty of the germination process is calculated
by the expression , being ,
where ni: number of seeds germinated on the ith time,
and k: last day of observation. Excel command: =-J17 (see the negative signal before J17).
Synchrony of germination is calculated by the
expression , being = ni(ni-1)/2, where
: combination of the seeds germinated in the ith time,
two by two, and ni: number of seeds germinated in the
ith time. Excel command: =K17/COMBIN(C17;2). Z is
the quotient between the sum of the partial combinations of the number of seeds germinated in each ti, two by two (K17) and the two by two combination of the total number of seeds germinated at the end of the experiment, assuming that all seeds that germinated did so simultaneously.
Special attention should be given to the logarithm and combination columns when in a given time ti, no seed could germinate or when only one seed could germinate. Thus, when the relative frequency of germination (fi) is equal to zero, the calculus of log2fi
will be automatically expressed in the cell as #NUM! A similar situation will occur for the combinations when ni≤ 1. In these cases, it is necessary to delete the
T
able 2. Excel commands used to prepare table 3.
The mathematical notation was omitted to make the construction of the table ea
sier
. Columns
A, B, and C will be
completed using the experimental data.
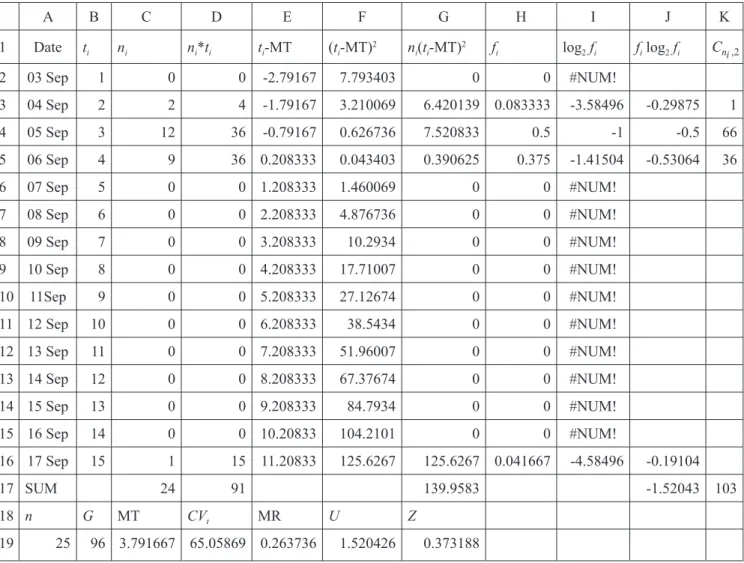
Table 3. Calculus of the germination measurements for seeds of the the fi rst replication (n = 25) of matrix number 1 of
Anadenanthera colubrina. The seeds were sown on September 02, 2005 and the fi rst observation was done 24 hours after this,
on September 03, 2005 (see the column A of the table). (ti: time between the sowing and the i
th (day) observation; n
i: number
of seeds germinated in the observation time (not the accumulated number, but the number registered to the ith observation); MT: mean germination time; fi: relative frequency of germination; : combination two by two of the event; G: germinability; CVt: coeffi cient of variation of the germination time; MR: mean germination rate; U: uncertainty; Z: synchrony; A to K are the
names of the columns of the sheet; 1 to 19 are the numbers of the rows of the sheet). The mathematical notation was omitted to make the construction of the table easier.
A B C D E F G H I J K
1 Date ti ni ni*ti ti-MT (ti-MT)2 ni(ti-MT)2 fi log2fi fi log2fi
2 03 Sep 1 0 0 -2.79167 7.793403 0 0 #NUM!
3 04 Sep 2 2 4 -1.79167 3.210069 6.420139 0.083333 -3.58496 -0.29875 1
4 05 Sep 3 12 36 -0.79167 0.626736 7.520833 0.5 -1 -0.5 66
5 06 Sep 4 9 36 0.208333 0.043403 0.390625 0.375 -1.41504 -0.53064 36
6 07 Sep 5 0 0 1.208333 1.460069 0 0 #NUM!
7 08 Sep 6 0 0 2.208333 4.876736 0 0 #NUM!
8 09 Sep 7 0 0 3.208333 10.2934 0 0 #NUM!
9 10 Sep 8 0 0 4.208333 17.71007 0 0 #NUM!
10 11Sep 9 0 0 5.208333 27.12674 0 0 #NUM!
11 12 Sep 10 0 0 6.208333 38.5434 0 0 #NUM!
12 13 Sep 11 0 0 7.208333 51.96007 0 0 #NUM!
13 14 Sep 12 0 0 8.208333 67.37674 0 0 #NUM!
14 15 Sep 13 0 0 9.208333 84.7934 0 0 #NUM!
15 16 Sep 14 0 0 10.20833 104.2101 0 0 #NUM!
16 17 Sep 15 1 15 11.20833 125.6267 125.6267 0.041667 -4.58496 -0.19104
17 SUM 24 91 139.9583 -1.52043 103
18 n G MT CVt MR U Z
19 25 96 3.791667 65.05869 0.263736 1.520426 0.373188
Excel commands for D2 (column D, row 2) is =C2*B2; for E2 is =B2-$C$19; for F2 is =E^2 (=click on cell E2, then use SHIFT + circumfl ex accent, give one space and press number 2); for G2 is =C2*F2; for H2 is =C2/$C$17; for I2 is =LOG(H2;2); for J is =H2*I2; for K2 is =COMBIN(C2;2). The command $C$19 sets the cell where the value of the mean germination time required for the calculation is. The command fragmented in columns E, F and G can be processed at once, using only the G column as =C2*(B2-$C$19)^2. The summations are calculated using the command =SUM(C2:C16). Delete the symbol #NUM! of the J and K columns before the command for summation.
symbol #NUM! so that Excel recognizes only numerical values when the summation of columns J and K are processed (table 3).
Table 3 has data of one replication of one treatment of Anadenanthera colubrina seeds, in this case, matrix number 1 (individual marked to collect the seeds). As the experiment was composed by seeds of fi ve matrixes, each one with four replications, we
constructed 20 sheets similar to this. At this moment we invite you to prepare your spreadsheet using table 3 as a model, the commands presented above, and the commands presented in table 2. At the end of this operation, the numbers of the 19th row of table 3 will
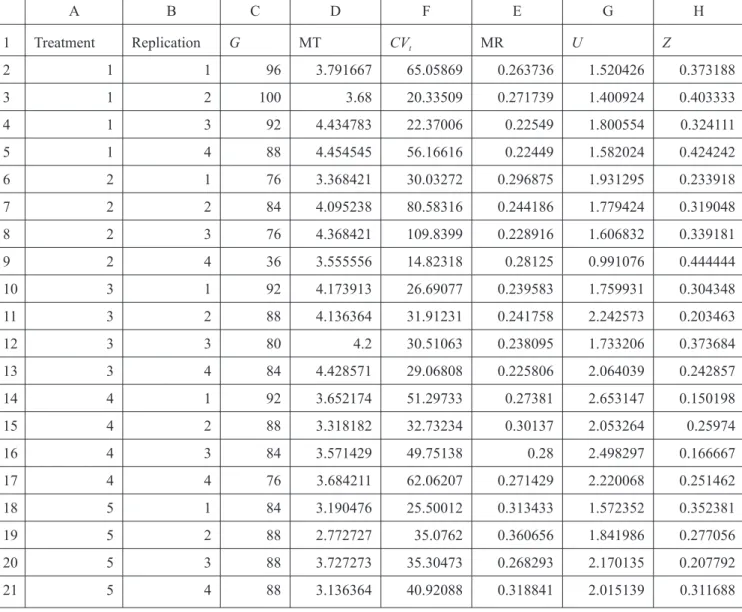
Table 4. General sheet of the experiment of Anadenanthera colubrina prepared in the Excel program. Five treatments with four replications constituted the experiment. (G: germinability; MT = t : mean germination time; MR = v: mean germination rate; CVt: coeffi cient of variation of the germination time; U: uncertainty of the germination process; Z: synchrony of the
germination process). Use point for decimals to enter in a statistical program; A to H names of the columns of the sheet; 1 to 21: numbers of the rows of the sheet). The mathematical notation was omitted to make the construction of the table easier.
A B C D F E G H
1 Treatment Replication G MT CVt MR U Z
2 1 1 96 3.791667 65.05869 0.263736 1.520426 0.373188
3 1 2 100 3.68 20.33509 0.271739 1.400924 0.403333
4 1 3 92 4.434783 22.37006 0.22549 1.800554 0.324111
5 1 4 88 4.454545 56.16616 0.22449 1.582024 0.424242
6 2 1 76 3.368421 30.03272 0.296875 1.931295 0.233918
7 2 2 84 4.095238 80.58316 0.244186 1.779424 0.319048
8 2 3 76 4.368421 109.8399 0.228916 1.606832 0.339181
9 2 4 36 3.555556 14.82318 0.28125 0.991076 0.444444
10 3 1 92 4.173913 26.69077 0.239583 1.759931 0.304348
11 3 2 88 4.136364 31.91231 0.241758 2.242573 0.203463
12 3 3 80 4.2 30.51063 0.238095 1.733206 0.373684
13 3 4 84 4.428571 29.06808 0.225806 2.064039 0.242857
14 4 1 92 3.652174 51.29733 0.27381 2.653147 0.150198
15 4 2 88 3.318182 32.73234 0.30137 2.053264 0.25974
16 4 3 84 3.571429 49.75138 0.28 2.498297 0.166667
17 4 4 76 3.684211 62.06207 0.271429 2.220068 0.251462
18 5 1 84 3.190476 25.50012 0.313433 1.572352 0.352381
19 5 2 88 2.772727 35.0762 0.360656 1.841986 0.277056
20 5 3 88 3.727273 35.30473 0.268293 2.170135 0.207792
21 5 4 88 3.136364 40.92088 0.318841 2.015139 0.311688
The sequence of the germination measurements included in the last row of table 3 was determined to make use one important Excel command, necessary to make the preparation of the general sheet of the experiment easier. The values of the germination measurements presented in this row will be copied in a new sheet for statistical analysis. The measurements sequence presented in row number 1 of table 4 is the same as that presented in the 18th row of table 3. To prepare row number 2 of table
4 you will click on the fi rst position to copy the fi rst measurement (C2, table 4), including the equal sign (=).
H. All values expressed in the 19th row of table 3 are
automatically copied. If some modifi cation is processed in the sheet of one replication, the general sheet of the experiment will be automatically modifi ed and this is the second advantage of this command. All things will be processed if all sheets of the experiment are saved in the same fi le.
Table 4, written according to the international system (point to separate decimals), could be copied to process the statistical analysis, using the command copy, special paste, and the option “values”. Only the values will be copied, without the commands which are unnecessary for the statistical programs.
The fi nal table used for publication is presented in table 5. By the way, the standard deviation communicated along side the mean germination time means the deviation of the mean time of all germinated seeds of each replication in relation to the mean time of the treatment. This mean time was obtained from the means of the replications and then includes the variability among seeds (genetic and environmental factor) and the variability among replications of the same treatment, including the effects of the experimental condition. The same is valid for the mean germination rate.
The procedures related to tables 4 and 5 are recommended if the experiment is based on some type
of design, including treatments and replications, but if the experiment is based on samples, the organization and calculus presented on tables 1 and 2 can also be applied. The same calculus presented on tables 1 and 3 can also be processed if other statistical applications are chosen by the researchers as curves with means and dispersion measurements.
After the construction of one sheet like table 3 it will be tempting to use the commands SELECT RANGE, CTRL+C, and CTRL+V to copy a new sheet for the second replication of the experiment, for a second studied sample or for a second experiment, but pay attention because some numbers must be modifi ed as the column of dates, the values of ni, the n value for the calculation of the germinability if the size of the sample is different, and the cells with the #NUM! command.
These instructions can be used for a free construction, without a spreadsheet model, but there is an electronic spreadsheet for download associated with this paper.
The last important point is the construction of the sheets when zero appears in several cells. In the spreadsheets for download there is one example and instructions related to zeros, to prepare the sheets for the statistical analysis. Consult Ranal
Table 5. Germination measurements (mean ± standard deviation) of Anadenanthera colubrina seeds collected in the Araguari river valley, MG, 2005 crop, from fi ve matrixes (individual from which the seeds were collected). Table extracted from the Master Degree Dissertation of Ferreira (2007). Means followed by the same letters in each column are not signifi cantly different based on the Tukey test at 0.05 probability. (G: germinability; t : mean germination time; CVt: coeffi cient of variation of the germination time; v: mean germination rate; U: uncertainty; Z: synchrony; W: statistics of the Shapiro-Wilk test; boldfaced values indicate normality for the residuals of ANOVA (P > 0.01); F: statistics of the Levene test; boldfaced values indicate homogeneity among variances (P > 0.01); F: Snedecor distribution value; boldfaced values indicate signifi cant difference among matrixes (ANOVA; P < 0.05); P: probability).
Matrix 1G (%) t (day) 1CV
t (%) v (day-1) U (bit) Z
1 94.00 ± 5.16 a 4.09 ± 0.41 b 40.98 ± 22.97 b 0.2464 ± 0.0249 b 1.58 ± 0.17 a 0.38 ± 0.04 a 2 68.00 ± 21.66 ab 3.85 ± 0.46 ab 58.82 ± 44.12 ab 0.2628 ± 0.0316 ab 1.52 ± 0.39 a 0.33 ± 0.09 ab 3 86.00 ± 5.16 a 4.23 ± 0.13 b 29.54 ± 2.23 ab 0.2363 ± 0.0072 b 1.95 ± 0.25 ab 0.28 ± 0.07 ab 4 85.00 ± 6.83 ab 3.56 ± 0.17 ab 48.96 ± 12.13 a 0.2816 ± 0.0136 ab 2.36 ± 0.27 b 0.21 ± 0.06 b 5 87.00 ± 2.00 b 3.21 ± 0.39 a 34.20 ± 6.40 ab 0.3153 ± 0.0378 a 1.90 ± 0.26 ab 0.29 ± 0.06 ab
W (P) 0.6883 (0.9671) 0.9619 (0.5848) 0.9642 (0.6300) 0.9901 (0.9951) 0.9781 (0.8915) 0.9776 (0.8834)
F(P) 3.047 (0.0504) 3.534 (0.0319) 0.590 (0.6753) 2.198 (0.1186) 0.614 (0.6593) 0.385 (0.8162)
F (P) 5.932 (0.0046) 5.860 (0.0048) 3.929 (0.0224) 5.973 (0.0044) 5.904 (0.0046) 3.867 (0.0236)
& Santana (2006) if there are any doubts relating to zeros.
Our experience indicates that several days of instructions will be saved in our laboratories using these instructions with the advantage that the new student can repeat the operation n times to feel secure.
Acknowledgements – The authors register their thanks to the readers of the references here cited because their questions stimulated the organization of this note. Review of the English text was done by Mr. John David Bagnall. Anaximandro Rende helped us with the construction of spreadsheet version for download.
References
FERREIRA, W.R. 2007. Variabilidade de cinco espécies arbóreas da região de cerrado do Brasil Central para medidas de germinação e emergência. Dissertação de mestrado, Universidade Federal de Uberlândia, Uberlândia.
RANAL, M.A. & SANTANA, D.G. 2006. How and why to measure the germination process? Revista Brasileira de Botânica 29:1-11.