doi: 10.1093/intqhc/mzy108 Article
Article
Bed management team with Kanban web-based
application
HERMANO ALEXANDRE LIMA ROCHA
1,2, ANA KELLY LIMA
DA CRUZ SANTOS
3, ANTÔNIA CELIA DE CASTRO ALCÂNTARA
3,
CARMEN SULINETE SULIANO DA COSTA LIMA
3, SABRINA GABRIELE
MAIA OLIVEIRA ROCHA
1, ROBERTO MELO CARDOSO
3,
and JAIR RODRIGUES CREMONIN, JR.
31
Community Health Department, Federal University of Ceará, Rua Prof Costa Mendes, 1608, 60.430-130, Fortaleza,
Ceará, Brazil,
2Public Health, Centro Universitário Unichristus, ISEC. R. João Adolfo Gurgel, 133, Cocó, Fortaleza,
CE, 60190-060, and
3Research Unit Department, Hospital Regional Unimed Fortaleza. Av. Visconde do Rio Branco,
4000
—
São João do Tauape, Fortaleza
—
CE, 60055-172, Fortaleza, Ceará, Brazil
Address reprint requests to: Hermano Alexandre Lima Rocha, Universidade Federal do Ceará, Departamento de Saúde Comunitária, Rua Professor Costa Mendes, 1608 (5°andar), Rodolfo Teófilo, Fortaleza-CE, CEP: 60430-140, Brazil. Tel:+55 85 3366-8044,+55 85 98812-8807; Fax:+55 85 3366-8044; E-mail address: [email protected], [email protected]
Editorial Decision 20 March 2018; Accepted 29 April 2018
Abstract
Objective:
To measure the effectiveness of the bed management process that uses a web-based
application with Kanban methodology to reduce hospitalization time of hospitalized patients.
Design:
Before
–
after study was performed.
Setting:
The study was conducted between July 2013 and July 2017, at the Unimed Regional Hospital
of Fortaleza, which has 300 beds, of which 60 are in the intensive care unit (ICU). It is accredited by
International Society for Quality in Healthcare.
Population:
Patients hospitalized in the referred period.
Intervention:
Bed management with an application that uses color logic to signal at which stage of
high
fl
ow the patients meet, in which each patient is interpreted as a card of the classical Kanban
theory. It has an automatic user signaling system for process movement, and a system for
moni-toring and analyzing discharge forecasts.
Main Outcome Measures:
Length of hospital stay, number of customer complaints related to bed
availability.
Results:
After the intervention, the hospital
’
s overall hospital stay time was reduced from 5.6 days
to 4.9 days (
P
=
0.001). The units with the greatest reduction were the ICUs, with reduction from
6.0 days to 2.0 (
P
=
0.001). The relative percentage of complaints regarding bed availability in the
hospital fell from 27% to 0%.
Conclusion:
We conclude that the use of an electronic tool based on Kanban methodology and
accessed via the web by a bed management team is effective in reducing patients
’
hospital stay
time.
Key words:hospital bed capacity, information management, mobile applications, quality improvement, hospital care, statistical process control, access to care
Background
Economic performance of a hospital institution can be measured by the excess of a ‘typical’ patient stay or by the occurrence of long excesses of stay. The duration of hospital admission explains ~85–90% of hospital cost variation with patients. One more daily in ICU bed, plus the average permanence time expected for a patient, is roughly four times more expensive than the cost of an average hospital daily, and every subsequent daily is about 2.5 times more expensive, cost ratio similar to existing in open units. In a regression model held to explain the expenses of permanence time, patients’clinical characteris-tics explain only 26% of the cost variation [1]. In an average length of stay of 4 days, the marginal cost [2] is $ 1 457, or 15% of the total costs, reaching $ 1 754 from thefifth day, per extra daily [3].
Currently, the private health system, aiming at a greater competi-tiveness in the market, and considering population aging, shows a growing concern for better results in healthcare, seeking to increase the volume of patients, reduce hospitalization time and reduce healthcare costs, factors considered necessary for survival in the market. Length of stay is one of the institutional quality indicators used to define the yield and productivity per hospital bed. It is important to note its rele-vance to health managers, since this indicator evaluates the efficiency of the institution, as well as it can be used to measure the number of hospital beds needed to provide assistance to the population in a spe-cific area, in which the efficiency of use of a bed is increased [4].
Literature shows that patients who receive poor quality of care have significantly longer hospital stay than patients whose care was of acceptable quality in various clinical conditions analyzed [5]. In add-ition, hospitals that spend relatively less or more than expected with their assistance have significantly longer stay time. The overall pattern of hospital resource allocation was also associated with length of stay. Thus, the measurable clinical effects can be seen as determined by the resource allocation decisions made by hospital management, support-ing the need for rigorous decision-maksupport-ing processes [6].
The study of the hospitalization process has received increasing attention, using methodologies developed in the industrial sector, such as Six Sigma, applied to health management, achieving quality improvement with reduced cost in different hospital process [7,8]. The Kanban methodology, which works with task signaling and pri-oritization, allowsflow to be run as efficiently as possible, and has been successfully implemented in hospital processes [9].
The management of hospital beds by an own staff is essential, and also contributes to reduce the time of treatment of pneumonia, currently a major international focus, responsible for the long stay in most of the institutions of the world. It has been proven that the reduction in the mean stay time of these patients does not cause harm to them [10].
This study aims to measure the effectiveness of the bed manage-ment process that uses a web-based tool with the Kanban method-ology to reduce hospital stay time. The hypotheses are that this tool can reduce length of stay.
Methods
Study type
A before–after study was conducted through the analysis of elec-tronic records of hospital indicators.
Study setting
The study was carried out with data from the period of July 2013 and July 2017, of the Unimed Regional Hospital of Fortaleza (HRU), a highly complex hospital with 300 beds, of which 60 are in the ICU. It
is the largest private hospital in Ceará, northeastern Brazil, which serves all medical specialties. It is an internationally accredited hospital by Qmentum. It has a volume of about 1 500 admissions per month. In Brazil, there are two main funding for healthcare, the universal gov-ernment coverage, SUS and the supplementary health system, mainly funded by employers, that works live an insurance system. The hos-pital metrics from both systems are not very different [11]. The studied hospital is from the supplementary health system.
Population and sample
The population was constituted with all adult patients hospitalized at the HRU between July 2013 and July 2017. Data from 67 878 patients were analyzed.
Study design
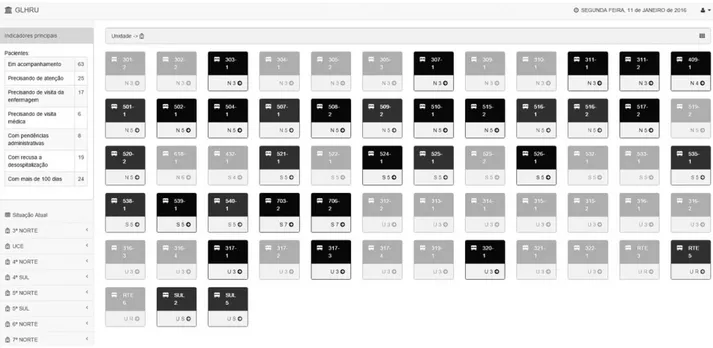
The intervention of the study was started in August 2015, with the implementation of bed management team and use of the web-based Kanban application for management of time permanence. The applica-tion was developed with the graphical interface equivalent to the actual distribution of the beds in each hospital unit. It can be used on mobile and computers, and updates made by users are viewed in real time by other users. The classical Kanban methodology, with the use of cards for the control of the productionflow, was adapted in the software to the process of bed management, in the same way of several other pro-cesses of market and factory did previously [12], based mainly on the proposal of Decentralized Reactive Kanban, made by Nakamura [13]. The method uses the color logic for the beds (Fig.1), which signal the stage of the discharge process in which each patient is, thus defining the need for attention and action of the bed management team, accord-ing to the priority: if red, the patient should be approached by the team in up to 48 h, if yellow in up to 5 days, and if green in up to 10 days. If no treatment is registered for the patient at these times, the sys-tem signals to the team the need for intervention. In addition, it strati-fies all patients according to the category of care and issues general daily report or whenever requested. This stratification is carried out based on social risks (for example, absence of family members) and clinical risks (for example, dependence on mechanical ventilation, for example), among others. Finally, it has an automatic user signaling sys-tem with emission demand for the managers, in real time, and a syssys-tem of monitoring and analysis of discharge forecast.
The bed management team consists of a doctor, a nurse and two social workers. When needed the system can suggest a direct contact of one of the team with the professionals directly involved in the assistance, with an estimated personal cost of US$ 9000.00 per month. The application itself has an approximatively maintenance cost of US$ 10.00 per month. In case of physicians, the contact is done by the medical doctor of the team. The 24 months prior to implantation were compared with the 24 subsequent months to ensure homogeneity of seasonality.
Variables
Data collect
The data were collected from the electronic system of indicators and business intelligence of the Hospital, the MV PEP®and through sat-isfaction surveys conducted by the quality assessment sector.
Data analysis
The data were initially imputed in Excel software, version 2013, Microsoft Inc®. Descriptive analyses were performed, with frequency and percentage calculations, means, medians, standard deviations, max-imum and minmax-imum values, as appropriate. Generalized linear regres-sive models were used to calculate effect size, as proposed by Bernal for analysis of interrupted time series in public health, adjusted for season-ality through stratification by months [14], in addition to Student’s
t-tests and ANOVA for comparison of means. The seasonality of the data was analyzed through seasonal decomposition with multivariate modeling and the weight of the moving averages considered equal in all months. Also, process control analyses were performed with three standard deviations of tolerance (three sigma). The level of statistical significance was set at 5%. We used the programs SPSS for Windows, IBM Inc. v23 and Minitab v17 for Windows.
Ethical aspects
The research was submitted to the Ethics Committee of Christus University Center. All the ethical principles pertinent to Resolution 466/12 of the National Health Council—CSN/Ministério da Saúde do Brasil—MS, which regulates research with human beings, were respected. The project was approved in the Brazil Platform under registry code CAAE 55700516.8.0000.5049.
Results
In Table1, it can be verified, through a simple bivariate comparison, that the reduction between the mean time of hospitalization before and after intervention, considering all hospital beds, was ~0.6 days,
P-value<0.001. Even more representative reductions were observed
when considering only open units and intensive units, both of which were also statistically significant,P-value<0.001. Also, it is verified that the bed occupancy rate varied positively in the period, increas-ing one percentage point, although without significance, demonstrat-ing that this indicator was not affected. In the analysis by months, it is noticed that the hospitalization times, considering all the units of the hospital, are higher in the first months of the year, denoting a pattern of seasonality.
The analysis of the temporal variation with seasonal decomposition allowed the identification of seasonal pattern, with an increase in the average stay time in thefirst semester, coinciding with the rainy season in Brazil. It is also observed a fall in the seasonal trend cycle (Fig.2).
Figure3 shows the drop in dwell time graphically, where the shaded area represents the post-intervention period. It can be seen from the regression model that this drop was statistically significant, even if it was controlled by the duration of the observation and the interaction of the latter with the intervention itself (P-value<0.001). The time of observation itself was also determinant, suggesting that the permanence time continues to decrease. As the post-intervention determination coefficient is about ten times greater (0.034 before and 0.321 after), this trend of decrease over time is attributed to the post-intervention period, which is also observed in the graph. The mean difference of length of stay before and after was 0.56 (IC 0.40–0.72), with aP-value of 0.001.
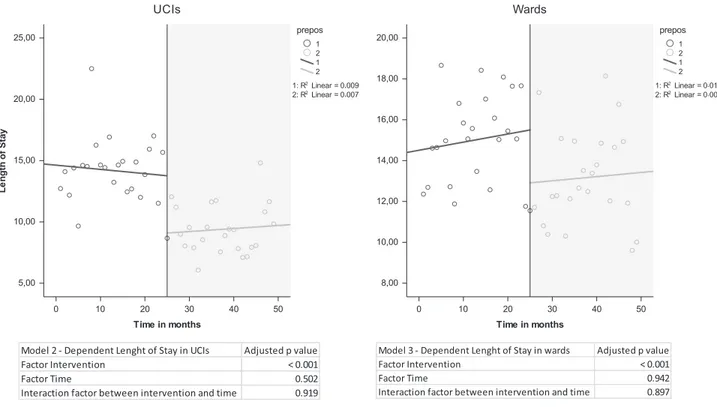
Figure4shows the scatter plots of the mean permanence times with the regression results, considering only the ICUs and only the ward units. It was observed a decrease in the time of permanence, with a stable tendency over time, where only the bed-management intervention with Kanban was determinant in the regression model (P<0.001). In this case, the time of observation was not determin-ant (Pvalues of 0.502 and 0.942, respectively).
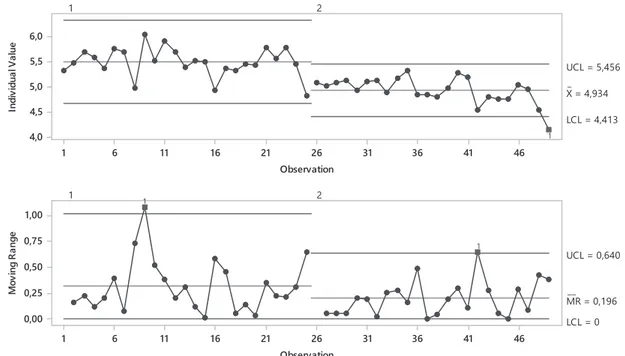
Figure5shows the graph of control of the general hospital stay times, in two stages, before and after the intervention. A narrowing of post-intervention confidence intervals was observed, demonstrating an increase in the control of the process after the implementation of the intervention.
In addition to the results identified in the reduction of length of hospital stay, there was a reduction in customer dissatisfaction. A survey by independent auditors found that the dissatisfaction rate related to waiting for bed by the client was 27% at the beginning of the project, in August 2015, reaching 0% in October 2017. Also, hospital infection rates were reduced in the period.
Discussion
This study verified that bed management performed by a small team in a large hospital aided by an application based on the Kanban methodology is effective in reducing the general length of hospital stay, reducing the length of stay by 0.6 days within 2 years, with
potential to achieve even more significant reductions. This applica-tion also increases the statistical control of the process.
Considering the marginal cost theory, and a marginal daily cost after thefifth day of US $ 1 754 [3], we have an estimate of hospital-ization savings, with a reduction in the length of stay found, of around US $ 800 (average length of hospital stay of 5 days). In a hospital with 1 500 admissions per month, this could mean an annual saving of $ 15 786 000.
Seasonality was identified in the behavior of the average length of stay, as expected due to the rainy season in the region that causes an increase in infections and hospitalizations in Ceará, Brazil [15]. Considering the phenomenon found, the analysis was adjusted to compensate the seasonality.
Figure 2Graph of seasonal factors (left) and trend cycle (right) for mean time of hospital stay, HRU, Ceará, Brazil.
Table 1Length of stay in all units and by sector and months, and hospital occupation rate, HRU, Ceará, Brazil
Intervention phase P-value
Before After
Mean SD Mean SD
Total Length of stay (days) 5.50 0.29 4.93 0.26 <0.001*
Occupation rate 82.11% 3.95% 83.11% 3.46% 0.357
Length of stay in ICUs (days) 14.18 2.67 9.40 2.02 <0.001
Length of stay in wards (days) 15.02 2.20 13.17 2.31 <0.001
Length of stay per month (days)
January 5.59 0.16 4.97 0.22
February 5.21 0.33 4.95 0.27
March 5.92 0.18 4.83 0.09
April 5.55 0.03 5.11 0.09
May 5.85 0.09 5.15 0.26
June 5.59 0.17 4.69 0.21
July 5.18 0.31 4.50 0.48
August 5.50 0.03 4.94 0.20
September 5.61 0.13 5.01 0.03
October 5.26 0.46 5.19 0.15
November 5.38 0.00 5.16 0.04
December 5.55 0.31 4.74 0.28
It was also verified that the hospital occupation increased in the comparison of the evaluated periods, demonstrating that there was an increase in bed rotation, without reducing the occu-pation of the hospital beds, demonstrating that a balance was found between the patients’ waiting for a bed and the time of patients’permanence [16]. This study did not evaluate the impact
of hospital readmissions, which may interfere with this estimated saving [17].
Several factors may have an impact on patients’length of stay, from their socioeconomic conditions [18] to purely clinical condi-tions [19–21], thus understanding the need for a multidisciplinary team to deal with the bed management process [22]. In addition, this specific process must be well organized to generate good results [23], and must act quickly so as not to lose the windows of clinical opportunity for discharge presented by patients [22]. Therefore, it is important that a methodology is used to guarantee the fast, continu-ous and accurate monitoring of this team, through an accessible and practical tool. This work has implemented an electronic system that can easily be accessed via the web in any device (mobile, computer, tablet) that uses the Kanban method. In Brazil, 20% of the hospitali-zations that evolve to long stay are due to socio-familiar problems. Thus, the participation of social workers was fundamental to the success of the project [24].
The Kanban was initially developed for the control of produc-tion andflow of materials, being initially thought to solve the pro-blems specifically faced by Toyota [25]. Since then, it has been adapted to improve the effectiveness of several processes, including in the area of health [12,26]. This study showed that the use of a tool that automates the signaling of the passages of each patient in the flow of their discharge process, signaled in turn by colors, in which each patient can be interpreted with a card of the original Kanban idea, is effective.
In addition to the direct economic benefit, other benefits are expected with reduced length of stay, such as shorter waiting times for beds leading to reduction of the emergency room queue [27] and reduction of hospital infection rates [28,29].
In this study, it was not possible to control other possible deter-minants of the length of stay reduction found. However, other pos-sible biases of quasi-experimental studies were controlled [30]. Figure 3Length of stay in all hospital pre (blue line) and post (green line)
intervention with Kanban web-based application, HRU, Ceará, Brazil.
We conclude that the use of an electronic tool based on Kanban methodology and accessed via the web by a bed management team is effective in reducing patients’hospital stay time.
Funding
None to report.Contributor statement
Author’s contribution were as follows: R.H.A.L., S.A.K.L. Da Cruz, A.A.C. De Castro, L.C.S.S. Da Costa have made substantial contributions to concep-tion and design and on revising the manuscript critically for important intel-lectual content. C.Jr.J.R., C.R.M. and R.S.G.M.O. have made substantial contributions to analysis and interpretation of data and on drafting the article and revising it critically for important intellectual content. All authors read and approved thefinal version of the manuscript and declare to have no con-flicts of interest to disclose.
References
1. Rapoport J, Teres D, Zhao Yet al. Length of stay data as a Guide to Hospital Economic Performance for ICU patients.Med Care2003;41:386–97. 2. Drummond MF, Sculpher MJ, Claxton Ket al.Methods for the economic
evaluation of health care programmes. Oxford: Oxford university press, 2015.
3. Carey K. Hospital length of stay and cost: a multilevel modeling analysis. Health Serv Outcomes Res Methodol2002;3:41–56.
4. da Silva GS, de Sousa AG, Soares Det al. Evaluation of the length of hos-pital stay in cases of coronary artery bypass graft by payer.Rev Assoc Med Bras2013;59:248–53.
5. Thomas JW, Guire KE, Horvat GG. Is patient length of stay related to quality of care?J Healthc Manage1997;42:489.
6. Needham DM, Anderson G, Pink GHet al. A province-wide study of the association between hospital resource allocation and length of stay. Health Serv Manage Res2003;16:155–66.
7. Revere L, Black K. Integrating Six Sigma with total quality management: a case example for measuring medication errors.J Healthc Manag2003;48:377.
8. Van Den Heuvel J, Does RJ, Verver JP. Six Sigma in healthcare: lessons learned from a hospital.Int J Six Sigma Competitive Advantage2005;1:380–8. 9. Persona A, Battini D, Rafele C. Hospital efficiency management: the
just-in-time and Kanban technique. International Journal of Healthcare Technology and Management2008;9:373–91.
10. McCormick D, Fine MJ, Coley CMet al. Variation in length of hospital stay in patients with community-acquired pneumonia: are shorter stays associated with worse medical outcomes?Am J Med1999;107:5–12. 11. Bittar OJNV. Produtividade em hospitais de acordo com alguns
indica-dores hospitalares.Revista de Saúde Pública1996;30:53–60.
12. Lage Junior M, Godinho Filho M. Variations of the kanban system: lit-erature review and classification.Int J Prod Econ2010;125:13–21. 13. Takahashi K, Nakamura N. Reacting JIT ordering systems to the unstable
changes in demand.Int J Prod Res1999;37:2293–313.
14. Bernal JL, Cummins S, Gasparrini A. Interrupted time series regression for the evaluation of public health interventions: a tutorial.Int J Epidemiol 2017;46:348–55.
15. de Gouvêa CSD, Travassos C, Fernandes C. Produção de serviços e quali-dade da assistência hospitalar no Estado do Rio de Janeiro, Brasil-1992 a 1995.Revista de Saúde Pública1997;31:601–17.
16. Gorunescu F, McClean SI, Millard PH. Correspondence. A queueing model for bed-occupancy management and planning of hospitals.J Oper Res Soc2002;53:19–24.
17. Carey K. Measuring the Hospital Length of Stay/Readmission Cost Trade-Off Under a Bundled Payment Mechanism.Health Econ2015;24: 790–802.
18. Epstein AM, Stern RS, Tognetti Jet al. The association of patients’ socio-economic characteristics with the Length of Hospital Stay and Hospital Charges within diagnosis-related groups.N Engl J Med1988;318:1579–85. 19. Pittet D, Tarara D, Wenzel RP. Nosocomial bloodstream infection in
crit-ically iii patients: excess length of stay, extra costs, and attributable mor-tality.JAMA1994;271:1598–601.
20. Mauldin PD, Salgado CD, Hansen ISet al. Attributable hospital cost and length of stay associated with health care-associated infections caused by antibiotic-resistant gram-negative bacteria.Antimicrob Agents Chemother 2010;54:109–15.
21. Correia MIT, Waitzberg DL. The impact of malnutrition on morbidity, mortality, length of hospital stay and costs evaluated through a multivari-ate model analysis.Clin Nutr2003;22:235–9.
22. Temple M, Dyer P. Doctors, ward rounds, discharge and the interface with the multidisciplinary team.Timely Disch Hosp2012: 195. 23. Wong H, Wu RC, Tomlinson Get al. How much do operational
pro-cesses affect hospital inpatient discharge rates?J Public Health (Oxford, England)2009;31:546–53.
24. Romero DE, Marques A, Barbosa Aet al. Internações de idosos por cuidados prolongados em hospitais do SUS no Rio de Janeiro: uma análise de suas características e da fragilidade das redes sociais de cuidado. Camarano AA, organizadora Cuidados de longa duração para população idosa: um novo risco social a ser assumido 2010: 249–78.
25. Sugimori Y, Kusunoki K, Cho Fet al. Toyota production system and Kanban system materialization of just-in-time and respect-for-human sys-tem.Int J Prod Res1977;15:553–64.
26. Landry S, Beaulieu M. Achieving lean healthcare by combining the two-bin kanban replenishment system with RFID technology. Int J Health Manage Inf2010;1:85–98.
27. Forster AJ, Stiell I, Wells Get al. The effect of hospital occupancy on emergency department length of stay and patient disposition.Acad Emerg Med2003;10:127–33.
28. Nguyen-Van-Tam S, Nguyen-Van-Tam J, Myint Set al. Risk factors for hospital-acquired urinary tract infection in a large English teaching hos-pital: a case-control study.Infection1999;27:192–7.
29. Hassan M, Tuckman HP, Patrick RHet al. Hospital length of stay and prob-ability of acquiring infection.Int J Pharm Healthc Mark2010;4:324–38. 30. Harris AD, McGregor JC, Perencevich ENet al. The use and