Study of chemical changes and antioxidant activity variation induced by
gamma-irradiation on wild mushrooms: comparative study through
principal component analysis
Ângela Fernandesa,b, João C.M. Barreiraa,b, Amilcar L. Antonioa,c,d, Pedro M.P. Santosc, Anabela Martinsa, M. Beatriz P.P. Oliveirab, Isabel C.F.R. Ferreiraa,*
a
Centro de Investigação de Montanha, ESA, Instituto Politécnico de Bragança, Campus de Santa Apolónia, Apartado 1172, 5301-855 Bragança, Portugal.
b
REQUIMTE/ Depto. de Ciências Químicas, Faculdade de Farmácia, Universidade do Porto, Rua Jorge Viterbo Ferreira n.º 228, 4050-313 Porto, Portugal.
c
IST/ITN, Instituto Superior Técnico, Estrada Nacional 10, 2686-953 Sacavém, Portugal. d
Departamento de Física Fundamental, Universidade de Salamanca, Plaza de la Merced, 37008 Salamanca, Spain.
Abstract
Mushrooms are especially sensitive to senescence, browning, water loss and microbial attack. Furthermore, wild species are characterized for their seasonality, demanding the development of suitable preservation technology. Gamma-irradiation was previously tested in wild Lactarius deliciosus, being verified that its application up to 1 kGy did not imply significant changes in chemical parameters. Herein, the effects of higher gamma-irradiation doses, typically used in natural food matrices like fruits or vegetables, were assessed in Boletus edulis Bull.: Fr. and Hydnum repandum L.: Fr. by checking for changes in nutritional parameters, free sugars, tocopherols, fatty acids, organic acids and antioxidant activity indicators. To have representative samples, the used carpophores were collected in different maturity stages, using the same number of specimens for each stage and also for each mushroom species. The specific effects of each tested irradiation were evaluated in an integrated manner through principal component analysis. The correspondent biplots indicate that differences caused by gamma-irradiation are enough to separate irradiated and non-irradiated samples of both mushrooms. Nevertheless, nutritional profiles were not affected in high extension, indicating that gamma-irradiation, up to the doses used in this work, might represent a useful mushroom conservation technology.
1. Introduction
Mushrooms are highly perishable food matrices mainly due to the high water content (approx. 90%), being easily deteriorated due to senescence, browning, water loss and microbial attack (Jolivet et al., 1998). Furthermore, wild mushrooms such as Boletus edulis Bull.:Fr. and Hydnum repandum L.:Fr. are strictly seasonal, causing difficulties in their distribution and marketing as fresh products; the level of loss in similar matrices during marketing could be as high as 40% (Lacroix & Ouattara, 2000). Therefore, mushrooms need special care to keep quality and freshness. The northeast of Portugal, due to its climatic conditions and flora diversity, is one of the European regions with a high variety of wild mushrooms, some of them with great gastronomic significance (Martins, Baptista,
Sousa, Meireles, & Pais, 2002). B. edulis and H. repandum are among the most commonly
consumed wild mushrooms. Their popularity is mainly due to sensory qualities, in particular aroma, taste and texture. Moreover, it should be highlighted that wild species are considered add-value foods for commercialization in the markets of France and Spain (Martins et al., 2002).
Irradiation is recognized as a safe and effective method of preservation used worldwide to extend the shelf life of raw foods (e.g. fruits and vegetables, spices, grains, meat or seafood) (Andrews et al., 1998; Fernandes, Antonio, Oliveira, Martins, & Ferreira, 2012a). In fact, more than 26 countries are using the process on a commercial scale (Stevenson,
1994; Lacroix & Ouattara, 2000). Different cultivated mushrooms (mainly from Agaricus,
mushroom, we conclude that up to 1 kGy this technology was effective in maintaining chemical composition and controlling the deterioration of fresh samples (Fernandes et al., 2012b; Fernandes et al., 2012c).
Herein, gamma-irradiation doses up to 2 kGy were applied to B. edulis and H. repandum. In fact, a dose of 2.0 kGy is usually the optimal dose that fruits and vegetables may tolerate
to keep their quality intact (without suffering loss of firmness, change in flavor/taste,
physiological breakage or accelerated ripening) (Lacroix & Ouattara, 2000). In addition, the elimination of mold and pathogenic bacteria from mushrooms can be achieved with 2.0
kGy dose, increasing their shelf life from 2 to 8 days when stored at 10ºC (Skou, Beett, & Lundsten, 1974; Lacroix & Ouattara, 2000). Accordingly, the effects on nutritional
parameters, free sugars, tocopherols, fatty acids, organic acids and antioxidant activity were evaluated individually in each assayed mushroom. Furthermore, principal component
analysis was applied to verify which specific parameters were more affected by each assayed gamma-irradiation dose.
2. Materials and methods
2.1. Standards and reagents
For chemical analyses: Acetonitrile 99.9%, n-hexane 95% and ethyl acetate 99.8% were of HPLC grade from Lab-Scan (Lisbon, Portugal). The fatty acids methyl ester (FAME) reference standard mixture 37 (standard 47885-U) was purchased from Sigma (St. Louis, MO, USA), as also other individual fatty acid isomers, organic acids, tocopherol and sugar standards. Racemic tocol, 50 mg/mL, was purchased from Matreya (PA, USA).
For antioxidant potential analysis: 2,2-Diphenyl-1-picrylhydrazyl (DPPH) was obtained from Alfa Aesar (Ward Hill, MA, USA). Standards trolox (6-hydroxy-2,5,7,8-tetramethylchroman-2-carboxylic acid) and gallic acid were from Sigma (St. Louis, MO, USA). Methanol and all other chemicals were of analytical grade and obtained from common sources. Water was treated in a Mili-Q water purification system (TGI Pure Water Systems, USA).
2.2. Samples and samples irradiation
B. edulis and H. repandum fruiting bodies (carpophores) were collected in different maturity stages; however, the same number of specimens belonging to each maturity stage was selected for both mushrooms. All mushrooms were collected in Trás-os-Montes (Northeast of Portugal) in November 2012.
B. edulis and H. repandum fresh samples were divided in three groups (each species) with three mushrooms per group. Each group corresponds to: control (non-irradiated, 0 kGy); sample 1 (1 kGy) and sample 2 (2 kGy).
ratios (Dmax/Dmin) were: 1.14±0.23 kGy, 1.71 kGy/h, 1.72 and 1.99±0.32 kGy, 1.49 kGy/h, 1.44, for B. edulis; and 1.02±0.04 kGy, 1.53 kGy/h, 1.08 and 1.66±0.46 kGy, 1.24 kGy/h, 1.98, H. repandum. For simplicity, in the text, tables and graphs we considered the values 0, 1 and 2 kGy, for non-irradiated and irradiated samples of both mushroom species. All the samples were lyophilized (FreeZone 4.5 model 7750031, Labconco, Kansas, USA), reduced to a fine dried powder (20 mesh) and mixed to obtain homogenized samples for subsequent analysis.
2.3. Chemical parameters
2.3.1. Nutritional value. Moisture, protein, fat, carbohydrates and ash were determined following the AOAC procedures (AOAC, 1995). Moisture content was evaluated by lyophilization (FreeZone 4.5 model 7750031, Labconco, Kansas, USA), crude protein content (N×4.38) of the samples was estimated by the macro-Kjeldahl method according to Léon-Guzmán et al. (1997); the crude fat was determined by extracting a known weight of powdered sample with petroleum ether, using a Soxhlet apparatus; the ash content was determined by incineration at 600±15 oC using a Chamber furnace Lenton Thermal Designs Ltd, model ECF 12/22. Total carbohydrates were calculated by difference. Energy was calculated according to the following equation: Energy (kcal) = 4 × (gprotein) + 3.75 × (gcarbohydrate) + 9 × (gfat).
detector (Knauer Smartline 2300). Data were analysed using Clarity 2.4 Software (DataApex). The chromatographic separation was achieved with a Eurospher 100-5 NH2 column (4.6 × 250 mm, 5 mm, Knauer) operating at 30 ºC (7971 R Grace oven). The mobile phase was acetonitrile/deionized water, 70:30 (v/v) at a flow rate of 1 mL/min. The compounds were identified by chromatographic comparisons with authentic standards. Quantification was performed using the internal standard method and sugar contents were further expressed in g per 100 g of dry weight (dw).
2.3.3. Fatty acids. Fatty acids were determined by gas-liquid chromatography with flame ionization detection (GC-FID), after the extraction and derivatization procedures described previously (Heleno et al., 2011). The analysis was carried out with a DANI model GC 1000 instrument equipped with a split/splitless injector, a FID at 260 ºC and a Macherey-Nagel column 50% cyanopropylmeythyl 50% phenylmethylpolysiloxane (30 m × 0.32 mm ID × 0.25 µm df). The oven temperature program was as follows: the initial temperature of the column was 50 ºC, held for 2 min, then a 30 ºC/min ramp to 125 ºC, 5 ºC/min ramp to 160 ºC, 20 ºC/min ramp to 180 ºC, 3 ºC/min ramp to 200 ºC, 20 ºC/min ramp to 220 ºC and held for 15 min. The carrier gas (hydrogen) flow-rate was 4.0 mL/min (0.61 bar), measured at 50 ºC. Split injection (1:40) was carried out at 250 ºC. Fatty acid identification was made by comparing the relative retention times of FAME peaks from samples with standards. The results were recorded and processed using the CSW 1.7 Software (DataApex 1.7) and expressed in relative percentage of each fatty acid.
detector (FP-2020; Jasco) programmed for excitation at 290 nm and emission at 330 nm. The chromatographic separation was achieved with a Polyamide II normal-phase column (250 × 4.6 mm; YMC Waters) operating at 30 ºC. The mobile phase used was a mixture of n-hexane and ethyl acetate (70:30, v/v) at a flow rate of 1 mL/min. The compounds were identified by chromatographic comparisons with authentic standards. Quantification was based on the fluorescence signal response, using the internal standard method, and tocopherols content was further expressed in mg per 100 g of dry weight (dw).
2.3.5. Organic acids. Organic acids were determined following a procedure previously optimized and described by the authors (Barros, Pereira, & Ferreira, 2013). Analysis was performed by ultra fast liquid chromatograph (UFLC) coupled to photodiode array detector (PDA), using a Shimadzu 20A series UFLC (Shimadzu Cooperation). Detection was carried out in a PDA, using 215 and 245 nm as preferred wavelengths. The organic acids were quantified by comparison of the area of their peaks recorded at 215 nm with calibration curves obtained from commercial standards of each compound. The results were expressed in mg per 100 g of dry weight (dw).
2.4. Antioxidant parameters
2.4.1. Extraction procedure. Lyophilized powdered mushrooms samples (1 g) were stirred
described by the authors (Heleno et al., 2010) to evaluate the antioxidant activity of the samples. The sample concentrations providing 50% of antioxidant activity or 0.5 of absorbance (EC50) were calculated from the graphs of antioxidant activity percentages (DPPH, β-carotene/linoleate and TBARS assays) or absorbance at 690 nm (reducing power assay) against sample concentrations. Trolox was used as standard.
2.4.2. DPPH radical scavenging activity. This methodology was performed using an ELX800 Microplate Reader (Bio-Tek). The reaction mixture in each one of the 96-wells consisted of one of the different concentrations of the extracts (30 µL) and methanolic solution (270 µL) containing DPPH radicals (6 × 10⁻⁵ mol/L). The mixture was left to stand for 60 min in the dark. The reduction of the DPPH radical was determined by measuring the absorption at 515 nm. The radical scavenging activity (RSA) was calculated as a percentage of DPPH discoloration using the equation: % RSA = [(ADPPH - AS)/ADPPH] × 100, where AS is the absorbance of the solution when the sample extract has been added at a particular level, and ADPPH is the absorbance of the DPPH solution.
2.4.3. Reducing power. Two different procedures were used to evaluate the reducing power:
B) The second methodology followed the Folin-Ciocalteu assay. The extract solution (1 mL) was mixed with Folin-Ciocalteu reagent (5 mL, previously diluted with water 1:10, v/v) and sodium carbonate (75 g/L, 4 mL). The tubes were vortex mixed for 15 s and allowed to stand for 30 min at 40 ºC for color development. Absorbance was then measured at 765 nm. Gallic acid was used to obtain the standard curve (0.0094-0.15 mg/mL), and the results were expressed as mg of gallic acid equivalents (GAE) per g of extract.
2.4.4. Inhibition of β-carotene bleaching. β-carotene (2 mg) was dissolved in chloroform (10 mL) and 2 mL of this solution were pipetted into a round-bottom flask. After the chloroform was removed at 40 ºC under vacuum, linoleic acid (40 mg), Tween 80 emulsifier (400 mg), and distilled water (100 mL) were added to the flask with vigorous shaking. Aliquots (4.8 mL) of this emulsion were transferred into different test tubes containing different concentrations of the extracts (0.2 mL). The tubes were shaken and incubated at 50 ºC in a water bath. As soon as the emulsion was added to each tube, the zero time absorbance was measured at 470 nm. β-Carotene bleaching inhibition was calculated using the following equation: (absorbance after 2 h of assay/initial absorbance) × 100.
ºC for 1 h. The reaction was stopped by the addition of trichloroacetic acid (28% w/v, 500 µL), followed by thiobarbituric acid (TBA, 2%, w/v, 380 µL), and the mixture was then heated at 80 ºC for 20 min. After centrifugation at 3000g for 10 min to remove the precipitated protein, the color intensity of the malondialdehyde (MDA)-TBA complex in the supernatant was measured by its absorbance at 532 nm. The inhibition ratio (%) was calculated using the following formula: Inhibition ratio (%) = [(A - B)/A] × 100%, where A and B were the absorbance of the control and the sample solution, respectively.
2.5. Statistical analysis
All analyses (extractions) were performed in triplicate; each replicate was quantified also three times. Data were expressed as means±standard deviations.
The fulfillment of the one-way ANOVA requirements, specifically the normal distribution of the residuals and the homogeneity of variance, was tested by means of the Shapiro-Wilk’s, and the Levene’s tests, respectively. For each parameter, significant differences among mean values were checked by Welch’s statistics (p<0.05 means that the mean value of the evaluated parameter of at least one irradiation differs from the others). In the cases where statistical significance differences were identified, the dependent variables were compared using Tukey’s honestly significant difference (HSD) or Tamhane’s T2 multiple comparison tests, when homoscedasticity was verified or not, respectively.
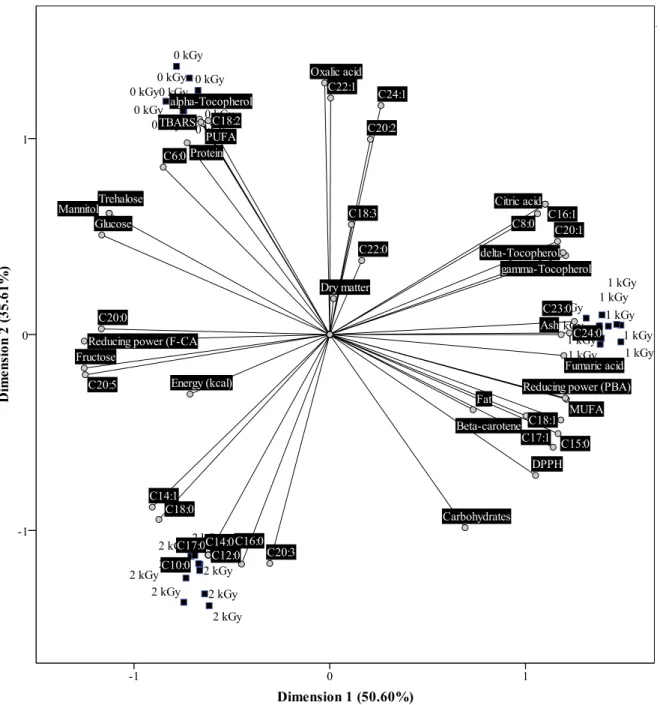
Principal components analysis (PCA) was applied as pattern recognition unsupervised classification method. PCA transforms the original, measured variables into new uncorrelated variables called principal components. The first principal component covers as much of the variation in the data as possible. The second principal component is orthogonal to the first and covers as much of the remaining variation as possible, and so on
the respective eigenvalues (which should be greater than one), by the Cronbach’s alpha parameter (that must be positive) and also by the total percentage of variance (that should be as higher as possible) explained by the number of components selected. The number of dimensions considered for PCA was chosen in order to allow meaningful interpretations, to ensure their reliability.
All statistical tests were performed at a 5% significance level using the SPSS software, version 18.0 (SPSS Inc).
3. Results and discussion
Results regarding the evaluated chemical parameters and antioxidant activity assays are presented in Tables 1-6.
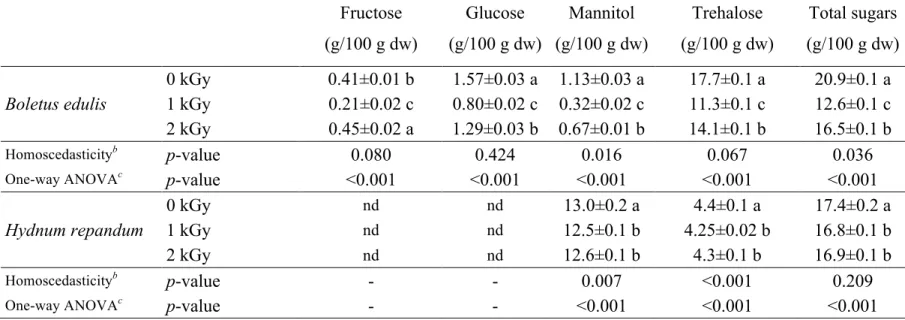
Free sugars profiles (Table 2) were quite different among the assayed species: trehalose was the main (≈ 14 g/100 g dw) sugar in B. edulis, a value similar to the previously reported by our research group (Heleno et al., 2011), while mannitol predominated (≈ 14 g/100 g dw) in H. repandum. The identified sugars decreased with irradiation in all cases. Sugars are known as being good indicators of a suitable conservation technology due to their sensibility to technical practices (Barreira, Pereira, Oliveira, & Ferreira, 2010). Irradiation, in particular, is known for causing several changes in sugars, such as melting point decreases, reduction in optical rotation and browning. Furthermore, sugars may suffer degradation, producing a mixture of gases consisting primarily of H2 and CO2, together with traces of CH4, CO and H2O. The relative proportions depends on the type of sugar irradiated and the absorbed dose (Molins, 2001), as verified in this case, where 1 kGy caused the minimization of sugar contents.
Tocopherol contents (Table 3) suffered the most marked effect in all quantified isoforms (α-, γ- and δ-tocopherol) presenting maximum values in samples irradiated with 1 kGy. Interestingly, the same irradiation dose minimized free sugars and maximized γ- and δ -tocopherol, a result that might be explained by the packaging atmosphere changes as a result of sugars degradation, since degradation of tocopherols is highly related with the availiability of free oxygen. α-Tocopherol, present in low amounts, was only detected in non-irradiated samples.
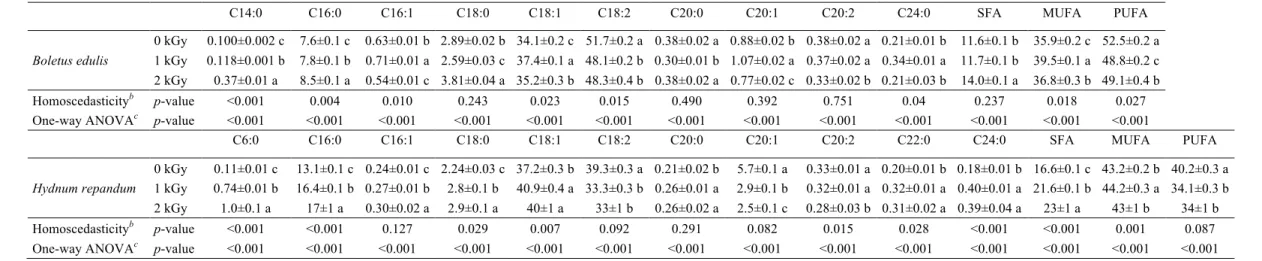
linoleic acid (C18:2), as it is common in these species (Kalač, 2009; Heleno et al., 2011). The high percentage of the latter should probably be associated with the highly appreciated organoleptic characteristics of these mushrooms, since linoleic acid is the precursor of oct-1-en-3-ol, known as “fungi alcohol”, the main aromatic component in fungi (Maga, 1981). It became evident that irradiation cause a decrease in unsaturated fatty acids. Irradiation may change lipid profile by catalyzing their reaction with molecular oxygen (autoxidation) or by the action of high-energy radiation itself, more evidently in both cases in unsaturated molecules (Nawar, 1986). In fact, the general mechanism of lipids radiolysis is thought to involve primary ionization, followed by migration of the positive charge either toward the carboxyl carbonyl group or double bonds (Molins, 2001), thus enhancing unsaturated fatty acids degradation.
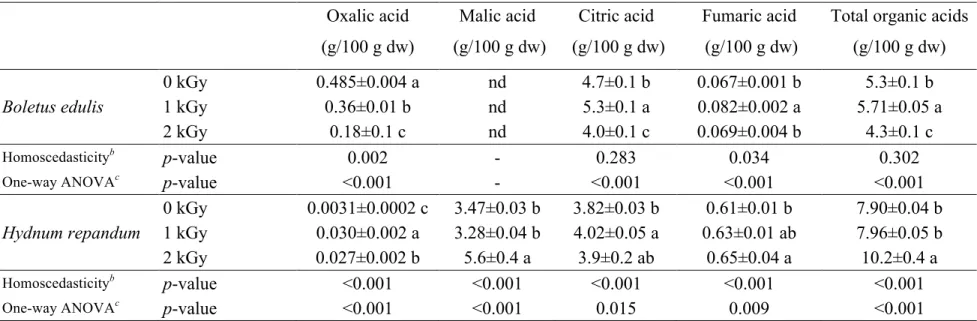
The profiles in organic acids (Table 5) were different among the two assayed mushrooms, particularly in what regards malic acid, which was absent in B. edulis. However, citric acid was the predominant organic acid, except in H. repandum samples irradiated with 2 kGy. Irradiated samples (excluding oxalic acid in B. edulis) presented higher organic acids values, as it was previously verified for tocopherols.
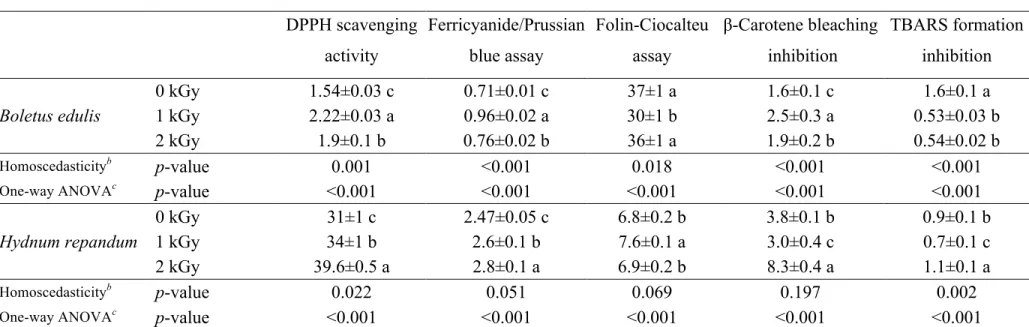
previous reports, B. edulis also gave higher antioxidant activity than H. repandum (Heleno et al., 2010; Heleno et al., 2011). Performed assays (Table 6) indicate that irradiated samples tended to have lower scavenging activity and reducing power, but higher lipid peroxidation inhibition. The observed decrease might be related with free radicals resulting from lipid radiolysis, which was higher in irradiated samples. On the other hand, the increase in lipid peroxidation inhibition is probably associated to the higher amount of tocopherols (powerful lipophilic antioxidants) detected in irradiated samples.
mostly characterized by high contents in C10:0, C12:0, C14:0, C16:0, C17:0 and C20:3 and low contents in C20:2, C22:1, C24:1 and oxalic acid.
In what concerns H. repandum (Figure 2) objects corresponding to each irradiation level were also clearly separated. The first two dimensions (first: Cronbach’s α, 0.986; eigenvalue, 28.386; second: Cronbach’s α, 0.907; eigenvalue, 8.855) include also most of the variance of all quantified variables (61.71% and 19.25%, respectively). In this case, group corresponding to 0 kGy was more positively correlated to fat, energy, mannitol, trehalose, α-tocopherol, C18:2, C18:3, C20:1 and PUFA, and more negatively correlated to C6:0, C8:0, C14:1, C16:0, C17:0, C18:0, C18:1, C20:0, C22:0, C22:1, C24:0 and oxalic acid. Objects corresponding to 1 kGy were more positively correlated to C24:1, MUFA, citric acid and reducing power (F-CA); no negative correlations were detected. Finally, 2 kGy group was mostly characterized by having high scores in carbohydrates, C10:0, C12:0, C14:0, C15:0, C16:1, fumaric acid, malic acid, β-carotene bleaching prevention, TBARS formation inhibition and reducing power (PBA) and low contents in dry matter, proteins, C20:2, C20:3 and C20:5.
research outcomes, irradiation minimizes the effects caused by storage time, being definitely indicated to be applied to mushrooms.
Acknowledgements
Authors are grateful to the Foundation for Science and Technology (FCT, Portugal) for financial support to research centres CIMO (PEst-OE/AGR/UI0690/2011) and REQUIMTE (PEst-C/EQB/LA0006/2011). Â. Fernandes, J.C.M. Barreira and A.L. Antonio thank FCT, POPH-QREN and FSE for their grants (SFRH/BD/76019/2011, SFRH/BPD/72802/2010 and SFRH/PROTEC/67398/2010, respectively).
References
Andrews, L.S., Ahmedna, M., Grodner, R. M., Liuzzo, J.A., Murano, P.S., & Murano, E. A. (1998). Food preservation using ionizing radiation. Review of Environmental and Contaminant Toxicology, 154, 1-53.
AOAC. (1995). Official methods of analysis (16th Ed.). Arlington VA, USA: Association of Official Analytical Chemists.
Barreira, J.C.M., Pereira, J.A., Oliveira, M.B.P.P., & Ferreira, I.C.F.R. (2010). Sugars profiles of different chestnut (Castanea sativa Mill.) and almond (Prunus dulcis) Cultivars by HPLC-RI. Plant Foods for Human Nutrition, 65, 38-43.
Barros, L., Pereira, C., & Ferreira, I.C.F.R. (2013). Optimized analysis of organic acids in edible mushrooms from Portugal by ultra fast liquid chromatography and photodiode array detection. Food Analytical Methods, 6, 309-316.
Fernandes, Â., Antonio, A.L., Barreira, J.C.M., Oliveira, M.B.P.P., Martins, A., & Ferreira, I.C.F.R. (2012b). Effects of gamma irradiation on physical parameters of Lactarius deliciosus wild edible mushroom. Postharvest Biology and Technology, 74, 79-84.
Fernandes, Â., Antonio, A.L., Oliveira, M.P.P., Martins, A., & Ferreira, I.C.F.R. (2012a). Effect of gamma and electron beam irradiation on the physico-chemical and nutritional properties of mushrooms: A review. Food Chemistry, 135, 641-650. Heleno, S.A., Barros, L., Sousa, M. J., Martins, A., & Ferreira, I.C.F.R. (2010).
Tocopherols composition of Portuguese wild mushrooms with antioxidant capacity. Food Chemistry, 119, 1443-1450.
Heleno, S.A., Barros, L., Sousa, M.J., Martins, A., Santos-Buelga, C., & Ferreira, I.C.F.R. (2011). Targeted metabolites analysis in wild Boletus species. LWT- Food Science and Technology, 44, 1343-1348.
Jolivet, S., Arpin, N., Wichers, H.J., & Pellon, G. (1998). Agaricus bisporus browning: a review. Mycological Research, 102, 1459-1483.
Kalač, P. (2009). Chemical composition and nutritional value of European species of wild growing mushrooms: A review. Food Chemistry, 113, 9-16.
Lacroix, M., & Ouattara, B. (2000). Combined industrial processes with irradiation to assure innocuity and preservation of food products - a review. Food Research International, 33, 719-724.
Léon-Guzmán, M.F., Silva, I., & Lopez, M.G. (1997). Proximate chemical composition, free amino acid contents, and free fatty acids contents of some wild edible mushrooms from Queretaro, Mexico. Journal of Agricultural and Food Chemistry, 45, 4329-4332.
Martins, A., Baptista, P., Sousa, M.J., Meireles, T., & Pais, M.S. (2002). Edible mycorrhizal fungi associated with Castanea sativa Mill trees in the Northeast of Portugal. In I. Hall, Wan Yun, E. Danell, A. Zambonelli (Eds.). Proceedings of the second international workshop on edible mycorrhizal fungi. ISBN 0-478-10828-X. Molins, R. (2001). Food Irradiation. Principles and applications. John Wiley & Sons, USA.
ISBN 0-471-35634-4.
Nawar, W.W. (1986). Volatiles from food irradiation. Food Reviews International, 2, 45-78.
Ouzouni, P. K., & Riganakos, K. A. (2007). Nutritional value and metal content of Greek wild edible fungi. Acta Alimentaria, 36, 99-110.
Patras, A., Brunton, N.P., Downey, G., Rawson, A., Warriner, K., & Gernigon, G. (2011). Application of principal component and hierarchical cluster analysis to classify fruits and vegetables commonly consumed in Ireland based on in vitro antioxidant activity. Journal of Food Composition and Analysis, 24, 250-256.
Skou, J. F., Beett, H., & Lundsten, K. (1974). E€ects of ionizing radiation on mushroms as influenced by physiological and environmental conditions. Radiation Botany, 14, 287-299.
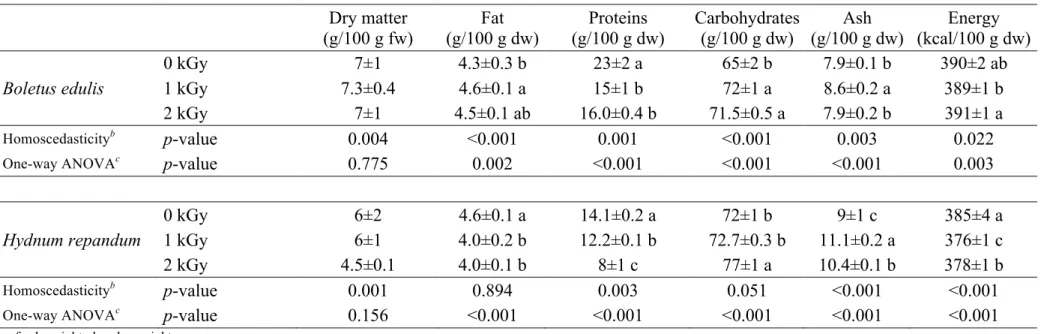
Table 1. Proximate composition and corresponding energetic value of B. edulis and H. repandum samples submitted to different gamma
irradiation doses. The results are presented as mean±SDa.
Dry matter (g/100 g fw)
Fat (g/100 g dw)
Proteins (g/100 g dw)
Carbohydrates (g/100 g dw)
Ash (g/100 g dw)
Energy (kcal/100 g dw)
Boletus edulis
0 kGy 7±1 4.3±0.3 b 23±2 a 65±2 b 7.9±0.1 b 390±2 ab
1 kGy 7.3±0.4 4.6±0.1 a 15±1 b 72±1 a 8.6±0.2 a 389±1 b
2 kGy 7±1 4.5±0.1 ab 16.0±0.4 b 71.5±0.5 a 7.9±0.2 b 391±1 a
Homoscedasticityb p-value 0.004 <0.001 0.001 <0.001 0.003 0.022
One-way ANOVAc p-value 0.775 0.002 <0.001 <0.001 <0.001 0.003
Hydnum repandum
0 kGy 6±2 4.6±0.1 a 14.1±0.2 a 72±1 b 9±1 c 385±4 a
1 kGy 6±1 4.0±0.2 b 12.2±0.1 b 72.7±0.3 b 11.1±0.2 a 376±1 c
2 kGy 4.5±0.1 4.0±0.1 b 8±1 c 77±1 a 10.4±0.1 b 378±1 b
Homoscedasticityb p-value 0.001 0.894 0.003 0.051 <0.001 <0.001
One-way ANOVAc p-value 0.156 <0.001 <0.001 <0.001 <0.001 <0.001
fw- fresh weight; dw- dry weight. a
Different letters in each column and for each mushroom indicate significant differences among mean values of each gamma irradiation level. b
Homoscedasticity among cultivars was tested by means of the Levene test: homoscedasticity, p-value>0.05; heteroscedasticity, p-value<0.05. c
Table 2. Sugars composition of B. edulis and H. repandum samplessubmitted to different gamma irradiation doses. The results are presented as
mean±SDa.
Fructose
(g/100 g dw)
Glucose
(g/100 g dw)
Mannitol
(g/100 g dw)
Trehalose
(g/100 g dw)
Total sugars
(g/100 g dw)
Boletus edulis
0 kGy 0.41±0.01 b 1.57±0.03 a 1.13±0.03 a 17.7±0.1 a 20.9±0.1 a
1 kGy 0.21±0.02 c 0.80±0.02 c 0.32±0.02 c 11.3±0.1 c 12.6±0.1 c
2 kGy 0.45±0.02 a 1.29±0.03 b 0.67±0.01 b 14.1±0.1 b 16.5±0.1 b
Homoscedasticityb p-value 0.080 0.424 0.016 0.067 0.036
One-way ANOVAc p-value <0.001 <0.001 <0.001 <0.001 <0.001
Hydnum repandum
0 kGy nd nd 13.0±0.2 a 4.4±0.1 a 17.4±0.2 a
1 kGy nd nd 12.5±0.1 b 4.25±0.02 b 16.8±0.1 b
2 kGy nd nd 12.6±0.1 b 4.3±0.1 b 16.9±0.1 b
Homoscedasticityb p-value - - 0.007 <0.001 0.209
One-way ANOVAc p-value - - <0.001 <0.001 <0.001
dw- dry weight; nd- not detected. a
Different letters in each column and for each mushroom indicate significant differences among mean values of each gamma irradiation level. b
Homoscedasticity among irradiation doses was tested by means of the Levene test: homoscedasticity, p-value>0.05; heteroscedasticity, p-value<0.05. c
Table 3. Tocopherols composition of B. edulis and H. repandum samples submitted to different gamma irradiation doses. The results are
presented as mean±SDa.
α-Tocopherol
(µg/100 g dw)
γ-Tocopherol
(µg/100 g dw)
δ-Tocopherol
(µg /100 g dw)
Total tocopherols
(µg /100 g dw)
Boletus edulis
0 kGy 1.5±0.1 25±2 b 33±4 b 59±2 b
1 kGy nd 85±3 a 58±1 a 143±3 a
2 kGy nd nd 24±1 c 24±1 c
Homoscedasticityb p-value <0.001 <0.001 <0.001 <0.001
One-way ANOVAc p-value <0.001 <0.001 <0.001 <0.001
Hydnum repandum
0 kGy 2.19±0.03 nd 8.9±0.2 c 11.1±0.2 c
1 kGy nd nd 113±1 a 113±1 a
2 kGy nd nd 80±2 b 80±1 b
Homoscedasticityb p-value <0.001 - 0.007 0.045
One-way ANOVAc p-value <0.001 - <0.001 <0.001
dw- dry weight; nd- not detected. a
Different letters in each column and for each mushroom indicate significant differences among mean values of each gamma irradiation level. b
Homoscedasticity among irradiation doses was tested by means of the Levene test: homoscedasticity, p-value>0.05; heteroscedasticity, p-value<0.05. c
Table 4. Fatty acids composition (relative percentages) of B. edulis and H. repandum samples submitted to different gamma irradiation doses.
The results are presented as mean±SDa.
C14:0 C16:0 C16:1 C18:0 C18:1 C18:2 C20:0 C20:1 C20:2 C24:0 SFA MUFA PUFA
Boletus edulis
0 kGy 0.100±0.002 c 7.6±0.1 c 0.63±0.01 b 2.89±0.02 b 34.1±0.2 c 51.7±0.2 a 0.38±0.02 a 0.88±0.02 b 0.38±0.02 a 0.21±0.01 b 11.6±0.1 b 35.9±0.2 c 52.5±0.2 a 1 kGy 0.118±0.001 b 7.8±0.1 b 0.71±0.01 a 2.59±0.03 c 37.4±0.1 a 48.1±0.2 b 0.30±0.01 b 1.07±0.02 a 0.37±0.02 a 0.34±0.01 a 11.7±0.1 b 39.5±0.1 a 48.8±0.2 c 2 kGy 0.37±0.01 a 8.5±0.1 a 0.54±0.01 c 3.81±0.04 a 35.2±0.3 b 48.3±0.4 b 0.38±0.02 a 0.77±0.02 c 0.33±0.02 b 0.21±0.03 b 14.0±0.1 a 36.8±0.3 b 49.1±0.4 b Homoscedasticityb p-value <0.001 0.004 0.010 0.243 0.023 0.015 0.490 0.392 0.751 0.04 0.237 0.018 0.027 One-way ANOVAc p-value <0.001 <0.001 <0.001 <0.001 <0.001 <0.001 <0.001 <0.001 <0.001 <0.001 <0.001 <0.001 <0.001
C6:0 C16:0 C16:1 C18:0 C18:1 C18:2 C20:0 C20:1 C20:2 C22:0 C24:0 SFA MUFA PUFA
Hydnum repandum
0 kGy 0.11±0.01 c 13.1±0.1 c 0.24±0.01 c 2.24±0.03 c 37.2±0.3 b 39.3±0.3 a 0.21±0.02 b 5.7±0.1 a 0.33±0.01 a 0.20±0.01 b 0.18±0.01 b 16.6±0.1 c 43.2±0.2 b 40.2±0.3 a 1 kGy 0.74±0.01 b 16.4±0.1 b 0.27±0.01 b 2.8±0.1 b 40.9±0.4 a 33.3±0.3 b 0.26±0.01 a 2.9±0.1 b 0.32±0.01 a 0.32±0.01 a 0.40±0.01 a 21.6±0.1 b 44.2±0.3 a 34.1±0.3 b 2 kGy 1.0±0.1 a 17±1 a 0.30±0.02 a 2.9±0.1 a 40±1 a 33±1 b 0.26±0.02 a 2.5±0.1 c 0.28±0.03 b 0.31±0.02 a 0.39±0.04 a 23±1 a 43±1 b 34±1 b Homoscedasticityb p-value <0.001 <0.001 0.127 0.029 0.007 0.092 0.291 0.082 0.015 0.028 <0.001 <0.001 0.001 0.087 One-way ANOVAc p-value <0.001 <0.001 <0.001 <0.001 <0.001 <0.001 <0.001 <0.001 <0.001 <0.001 <0.001 <0.001 <0.001 <0.001 dw- dry weight.
a
Different letters in each column and for each mushroom indicate significant differences among mean values of each gamma irradiation level. b
Homoscedasticity among irradiation doses was tested by means of the Levene test: homoscedasticity, p-value>0.05; heteroscedasticity, p-value<0.05. c
p<0.05 meaning that the mean value of the evaluated parameter of at least one irradiation differs from the others (in this case multiple comparison tests were performed).
Table 5. Organic acids composition of B. edulis and H. repandum samples submitted to different gamma irradiation doses. The results are
presented as mean±SDa.
Oxalic acid
(g/100 g dw)
Malic acid
(g/100 g dw)
Citric acid
(g/100 g dw)
Fumaric acid
(g/100 g dw)
Total organic acids
(g/100 g dw)
Boletus edulis
0 kGy 0.485±0.004 a nd 4.7±0.1 b 0.067±0.001 b 5.3±0.1 b
1 kGy 0.36±0.01 b nd 5.3±0.1 a 0.082±0.002 a 5.71±0.05 a
2 kGy 0.18±0.1 c nd 4.0±0.1 c 0.069±0.004 b 4.3±0.1 c
Homoscedasticityb p-value 0.002 - 0.283 0.034 0.302
One-way ANOVAc p-value <0.001 - <0.001 <0.001 <0.001
Hydnum repandum
0 kGy 0.0031±0.0002 c 3.47±0.03 b 3.82±0.03 b 0.61±0.01 b 7.90±0.04 b
1 kGy 0.030±0.002 a 3.28±0.04 b 4.02±0.05 a 0.63±0.01 ab 7.96±0.05 b
2 kGy 0.027±0.002 b 5.6±0.4 a 3.9±0.2 ab 0.65±0.04 a 10.2±0.4 a
Homoscedasticityb p-value <0.001 <0.001 <0.001 <0.001 <0.001
One-way ANOVAc p-value <0.001 <0.001 0.015 0.009 <0.001
dw- dry weight; nd- not detected. a
Different letters in each column and for each mushroom indicate significant differences among mean values of each gamma irradiation level. b
Homoscedasticity among irradiation doses was tested by means of the Levene test: homoscedasticity, P-value>0.05; heteroscedasticity, P-value<0.05. c
Table 6. In vitro antioxidant properties obtained for the extracts B. edulis and H. repandum samples submitted to different gamma irradiation
doses (mean±SD)a. Values are presented as EC50 values (mg/mL) for all assays except Folin-Ciocalteau, expressed as mg GAE/g extract.
Reducing power Lipid peroxidation inhibition
DPPH scavenging
activity
Ferricyanide/Prussian
blue assay
Folin-Ciocalteu
assay
β-Carotene bleaching
inhibition
TBARS formation
inhibition
Boletus edulis
0 kGy 1.54±0.03 c 0.71±0.01 c 37±1 a 1.6±0.1 c 1.6±0.1 a
1 kGy 2.22±0.03 a 0.96±0.02 a 30±1 b 2.5±0.3 a 0.53±0.03 b
2 kGy 1.9±0.1 b 0.76±0.02 b 36±1 a 1.9±0.2 b 0.54±0.02 b
Homoscedasticityb p-value 0.001 <0.001 0.018 <0.001 <0.001
One-way ANOVAc p-value <0.001 <0.001 <0.001 <0.001 <0.001
Hydnum repandum
0 kGy 31±1 c 2.47±0.05 c 6.8±0.2 b 3.8±0.1 b 0.9±0.1 b
1 kGy 34±1 b 2.6±0.1 b 7.6±0.1 a 3.0±0.4 c 0.7±0.1 c
2 kGy 39.6±0.5 a 2.8±0.1 a 6.9±0.2 b 8.3±0.4 a 1.1±0.1 a
Homoscedasticityb p-value 0.022 0.051 0.069 0.197 0.002
One-way ANOVAc p-value <0.001 <0.001 <0.001 <0.001 <0.001
dw- dry weight. a
Different letters in each column and for each mushroom indicate significant differences among mean values of each gamma irradiation level. b
Homoscedasticity among irradiation doses was tested by means of the Levene test: homoscedasticity, P-value>0.05; heteroscedasticity, P-value<0.05. c
p<0.05 meaning that the mean value of the evaluated parameter of at least one irradiation differs from the others (in this case multiple comparison tests were performed).
EC50- extract concentration corresponding to 50% of antioxidant activity or 0.5 of absorbance for the Ferricyanide/Prussian blue assay. Concerning the Folin-Ciocalteu assay, higher values
Figure 1. Biplot of objects (irradiation doses) and component loadings (evaluated
Figure 2. Biplot of objects (irradiation doses) and component loadings (evaluated