Procedia Engineering 147 ( 2016 ) 122 – 126
1877-7058 © 2016 The Authors. Published by Elsevier Ltd. This is an open access article under the CC BY-NC-ND license (http://creativecommons.org/licenses/by-nc-nd/4.0/).
Peer-review under responsibility of the organizing committee of ISEA 2016
ScienceDirect
* Corresponding author. Tel.: +65-6219-6213; fax: +65-6896-9260. E-mail address: tiago.barbosa@nie.edu.sg
11th conference of the International Sports Engineering Association, ISEA 2016
Comparison of the World and European Records in the 100m Dash by
a Quasi-Physical Model
Tiago M. Barbosa
a,b,c*, Pedro Forte
c,d, Daniel A. Marinho
c,d, Victor M. Reis
c,eaNanyang Technologic University, 637616 Singapore, Singapore bPolytechnic Institute of Bragança, 5300 Braganca, Portugal
cResearch Centre in Sports, Health and Human Development, 5001 Vila Real, Portugal dUnivesity of Beira Interior, 6200 Covilha, Portugal
eUnivesity of Trás-os-Montes and Alto Douro, 5001 Vila Real, Portugal
Abstract
The aim was to employ a quasi-physical model to analyse the performance and biomechanics of the World and European records at the 100m dash in Athletics. At the time of this research, the World record was hold by Usain Bolt (Jamaica) with 9.58s and the European record 9.86s by Francis Obikwelu (Portugal). The analysis of the performance employs a quasi-physical model that feature the drive, maintenance, velocity and drag terms. Obikwelu showed a slower start (drive term) and Bolt a lower rate of deceleration over the race (propulsive term). The velocity and drag terms were higher for Bolt. Correcting the race time for a hypothetical null wind speed, Bolt´s time would have been 9.62s (i.e. a 0.04s impairment) and 9.89s for Obikwelu (i.e. a 0.03s impairment).
© 2016 The Authors. Published by Elsevier Ltd.
Peer-review under responsibility of the organizing committee of ISEA 2016 Keywords: Sprinting; Race time; Kinematics; Aerodynamics; Wind
1. Introduction
Olympic Games, World and European Championships are major events in Athletics. In these events, most athletes have a large net of support, including sport scientists and amid these ones, biomechanists. Sport scientists aim to provide analytic data to athletes on their performances, as well as, their direct competitors [1,2,3]. In competitive settings, such as Olympic Games and World Championships, science staff at most national teams deliver yet to athletes reports on their kinematics. However, in the literature we can find other approaches that can be used concurrently providing a deeper insight. Sports scientists and researchers are also able of employing quasi-physical models and other analytical procedures to help the athletes [1] in competition settings. The major goal is providing to athletes and coaches insightful and holistic details on their performance but selecting testing procedures that are straightforward and less time-consuming.
The analysis of the performance by quasi-physical models is one of the most interesting procedures that can be carried out [1]. As far as we understand, the comparison of the performances delivered by the World (Usain Bolt) and European (Francis Obikwelu) record holders in the 100m dash has not yet been reported. The breakdown of the performance into its main determinant factors (i.e. terms in the model) can provide the insights pointed out earlier on.
The model reported by Mureika [1] features four terms considered as determinants for the final race time. The drive and maintenance terms describe the sprinters performance over such phases of the race. I.e., the beginning right after the start when he aims to reach as quickly as possible the maximal speed and the upright position (drive phase). After a brief transition eventually the sprinter tries to keep the maximal speed as long as possible, avoiding a speed decay due to fatigue (maintenance phase). However, there is a human limit to reach such maximal speed, being reflected by the speed term. Another term in the © 2016 The Authors. Published by Elsevier Ltd. This is an open access article under the CC BY-NC-ND license
(http://creativecommons.org/licenses/by-nc-nd/4.0/).
model reflecting the resistance acting upon the sprinter is the drag term. Altogether, these four terms can be used to have some insight on key-moments of the race and how it might affect the sprinter´s performance. Therefore, this quasi-physical model can provide practitioners and athletes a comprehensive understanding of their performance in the 100m dash. Besides anthropometrical features, all that is need is to collect the instantaneous speed over the race. Upon that the model [1] as reported under methods is run.
The aim was to employ a quasi-physical model to analyse the performance and biomechanics of the World and European records at the 100m dash in Athletics. It was hypothesized that significant differences could be identified between both sprinters in key-moments of the race, such as the drive and maintenance phases, explaining the lag in the race times between the two of them.
2. Methods
2.1. Sample
The sample was composed by the World and European record holders of the 100m dash at the time of this research. The World record is held by Usain Bolt (1.96m of height, 94kg of body mass; data retrieved online) of team Jamaica with the time of 9.58s (wind: +0.9m/s) obtained at the Berlin 2009 World Championships (Gold medal). The European record is held by Francis Obikwelu (1.95m of height, 80kg of body mass; personal communication by the athlete) of team Portugal with the time of 9.86s (wind: +0.6m/s) at the Athens 2004 Olympic Games (Silver medal). All procedures carried out in this research are in accordance to the Declaration of Helsinki.
2.2. Quasi-physical model
The performance in the 100m dash is determined by the time (t) spent over such displacement (d) and hence, under influence of the velocity:
v
d
t
(1)The sprinter must reach his maximal speed (or velocity that for this matter have the same magnitude) as soon as possible. I.e., the acceleration (a) is determined by the second law of motion, having the mechanical force (F) and the inertial component (i.e. mass, m) as exogenous variables:
m
F
a
(2)The F can be broken down into propulsive (Fprop) and resistive forces (Fresist). So, equation 2 is expended to:
m
F
F
a
(
prop resist)
(3)According to the quasi-physical model selected the Fprop encompasss the drive (fs) and the maintenance terms (fm), whereas
the Fresist feature the velocity (fv) and drag terms (fd)[1]:
>
@
m
f
f
f
f
a
(
s m)
(
v d)
(4)Speed-time [v(t)] or speed-distance [v(d)] of both races were retrieved online and from technical reports [4]. The mainstream devices to collect this data are Laser apparatus, Doppler systems, video cameras or time gaits. However it is also found in the literature pieces of research reporting kinematic analysis after retrieving publicly-available online material [5].
The fs is related to the start, from the crunched to the vertical position, considering the starting magnitude (fo=6.10N/kg) and
constant σ (2.22s-2):
)
exp(
20
t
f
The fm expresses the sprinter’s ability to keep the acceleration and, therefore, the rate of speed lost over the race, being f1
5.15N/kg and c a constant with the value of 0.0385 s-1:
)
exp(
1c
t
f
f
m
(6)The fv models the human limits to reach the maximal velocity (v) as function of time (t) being the constant α the human limit
(0.0323 s-1 if the stride frequency ranges roughly between 4-5Hz):
)
(t
v
f
vD
(7)Lastly, the fd is a term related to the air resistance. This includes the change of the surface area from the crunched to the
vertical position. The exogenous variables of this term are the air density (U), surface area (A), drag coefficient (Cd), body mass
(BM), velocity (v) and time (t):
)
(
)
exp(
4
1
1
2
1
2 2t
v
BM
C
A
t
f
d d
»¼
º
«¬
ª
U
V
(8)The A and Cd have been estimated in tandem with the procedure reported by Gómez et al. [6]. The acceleration (equation 4)
was submitted to integration for estimation of the velocity and the latter one integrated once again to determine the distance:
³
T
dt
)
t
(
a
v
0 (9)³
T
dt
t
v
d
0
(
)
(10)It is known that the wind speed can be a major determinant of the final race time. If the tail wind is more than 2.0 m/s, a time cannot be registered as an official record. Being the wind speed above or bellow 2.0m/s, this is yet considered as a benefit (tail wind) or a constraint (head wind) with an impact on the sprinting performance. The final race time can also be estimated for the event of a null wind speed (tc), being this based on the wind speed (vw) and the official race time delivered (tw) [7]:
»
»
¼
º
«
«
¬
ª
¸
¹
·
¨
©
§
2100
1
027
.
0
027
.
1
w w w ct
v
t
t
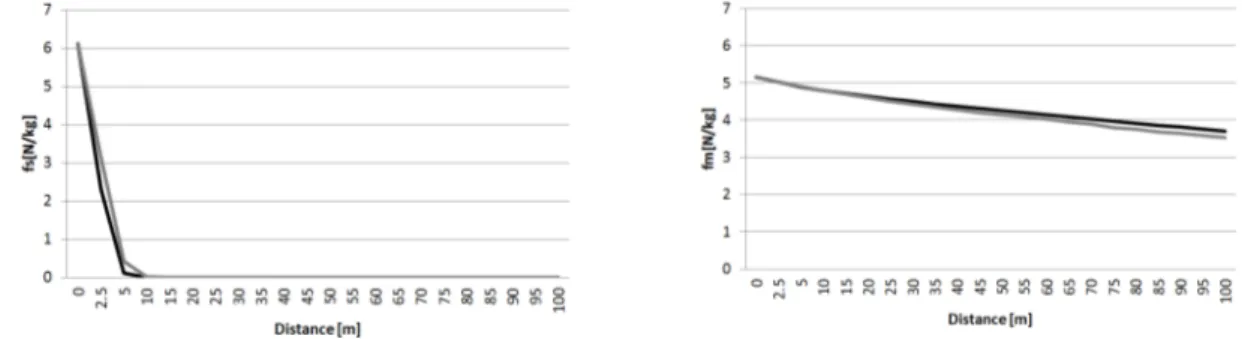
(11) 3. ResultsFigure 1 and 2 depict the four terms in the model to assess the sprinting performance.
After the 5-10m mark the fs can be neglected (fig 1). There is a fade out of the fm over the race (fig 1). The fv and fd, having a
strong relationship with the velocity, are prone to increase till the 30-40m and thereafter showed a steady-state (fig 2).
The fs is the most important term in the first 5m. Over the 5-40m distance, fm is the most determinant term. Beyond the 40m
mark, fv is the main contributor. On the other hand, fd plays a minor partial role over the entire race, in comparison to remaining
terms.
Comparing the two sprinters, the fs in Usain Bolt is kept for 2-3 more meters than in Obikwelu´s race. The decrease in the fm
is higher in Obikwelu. The fv and fd are higher for Bolt. Overall, Obikwelu had a slower start and Bolt a lower deceleration over
the race. The higher fd in Bolt might be related to the speed reached as well as to his anthropometric features.
Fig. 1. Comparison of the drive (fs) and maintenance (fm) terms between Usain Bolt (black line) and Francis Obikwelu (grey line).
Fig. 2. Comparison of the velocity (fv) and darg (fd) terms between Usain Bolt (black line) and Francis Obikwelu (grey line).
4. Discussion
Francis Obikwelu showed a slower start (fs) and Usain Bolt a lower rate of deceleration (fm). Bolt’s last 2s of race are rather
different of his profile throughout the remaining event. This is not necessarily due to biomechanical or physiological constraints, but his celebration before crossing the finish line. He turns his head to the left and to the right to check the position of the remaining contenders. Right before crossing the finish line he looks at a stopwatch on the right side of the track.
Similar event did happen earlier on at Beijing 2008 final. There are estimations that without these changes, the final race time would have been 9.55±0.04s [8]; whereas the the official final race time in 2008 was 9.69s.
Overall the main difference between these two sprinters was the performance delivered in the first 25-30m. As far as we are aware, there is not available in the literature papers employing the same quasi-physical model in Olympic medalists. Hence, it is challenging to benchmark our results with others. For what is worth, most papers report the sprinting kinematics or stiffness characteristics [4,5,9]. Comparing our data with the results reported by Mureika [1] is the only solution available. With no surprise, Bolt and Obikwelu showed better outputs in the terms included in the model than the subjects recruited by Mureika [1] in his original paper.
Trying to level the play field, it is also possible to learn what would have been the final race time in the event of no wind. In these two races, the final time would have been 9.62s for the Jamaican (i.e. a 0.04s impairment) and 9.89s (i.e. a 0.03s impairment) for the Portuguese. This information can also be useful to have an understanding on the performance from one session to another over a competition. For instance, from the hits all the way to the final, when the weather conditions can change meaningfully. It is also possible to benchmark sprinters that race under different weather conditions at the same competition.
In competition settings it is not yet possible to embed or set-up apparatus in the venue (notably, force plates in the track or individual time gates in each lane). Most athletes are not keen to be instrumented with miniaturized IMUs. They claim to be experiencing kinematic constraints and having concerns on their own confront racing. Because of these challenges, the procedures reported in this research are a feasible way for researchers but also practitioners to gather evidence-based information on elite athletes’ performances at major events.
5. Conclusions
It is feasible to employ a quasi-physical model and assess the 100m dash in Athletics, learning what are the determinant factors for an official race time. We showcased this comparing the World and European record holders. The difference in the race times delivered by Bolt and Obikwelu are due to some key-moments of the race and their biomechanics, notably in the first 25-30m. Obikwelu starts slower than Bolt. On top of that, the Jamaican sprinter showed a slower rate of deceleration over the race.
References
[1] Mureika, JR. A realistic quasi-physical model of the 100 m dash. Canadian J Physics 2001;79:697-713
[2] Morin JB, Dalleau G, Kyrolainen H, Jeannin T, Belli A. A simple method for measuring stiffness during running. J Appl Biomech 2005;21:167-80 [3] Heck A, Ellermeijer T. Giving students the run of sprinting models. American J Physics 2009;77(11):1028-38
[4] Hommel H. Scientific research project. Biomechanical analysis at the Berlin 2009 12th
IAAF world championship in Athletics. Darmstadt: German Athletics federation; 2009
[5] Hobara H, Potthast W, Müller R, Kobayashi Y, Heldoorn TA, Mochimaru M. Normative Spatiotemporal Parameters During 100-m Sprints in Amputee Sprinters Using Running-Specific Prostheses. J Appl Biomech 2016 32:93
[6] Gómez JH, Marquina V, Gómez RW. On the performance of Usain Bolt in the 100 m sprint. Eur J Physics 2013;34: 1227. [7] Mureika JR. Back-of-the-envelope wind and altitude correction for 100 metres sprint times. 2000; arXiv preprint physics/0006057 [8] Eriksen HK, Kristiansen JR, Langangen Ø, Wehus IK. How fast could Usain Bolt have run? A dynamical study. Am J Phys 2009;77:224-8.