Mestrado em Bioinformática
Brígida de Meireles
Exploring chemical conversions in
metabolic networks by tracing atoms
transition
Mestrado em Bioinformática
Brígida de Meireles
Exploring chemical conversions in
metabolic networks by tracing atoms
transition
Supervisors:
Sónia Madalena Azevedo Carneiro, PhD Rafael do Castro Carreira
A
CKNOWLEDGMENTSAgradeço aos meus orientadores toda a ajuda e apoio que me deram, pois sem eles eu não teria conseguido realizar este trabalho.
Aos meus amigos e familiares que sempre me aturaram e ajudaram quando precisei, principalmente aos meus pais, irmão, avós, Vinícius, Juliana, Ana, Sofia, Célia, Luciano, Liu, States, Zenha e Sara.
A
BSTRACTUnderstanding the metabolic processes that occur in a cell has been fundamental to rationally design organisms for the production of a desired metabolite. The improvement in biosynthesis of certain metabolites can be supported by tracing the atoms transition in different chemical conversions, and this way tackle which metabolic pathways are more efficient or most promising for manipulation.
In this work, a methodology to construct metabolic maps in which the carbon atom transitions are described was implemented. The carbon atom transition map for the central metabolism of Escherichia coli and Actinobacillus succinogenes were constructed. MetaCyc and KEGG databases were explored to obtain the metabolic information necessary to construct these maps and provided support for validation at some level.
R
ESUMOCompreender os processos metabólicos que ocorrem numa célula tem sido essencial para o desenho de estirpes capazes de sintetizar produtos de elevado interesse. A síntese de um determinado metabolito pode ser avaliada pela transição de átomos ao longo das diversas conversões químicas numa ou mais vias metabólicas, de modo a identificar quais as mais eficientes ou mais promissoras para manipulação.
Neste trabalho foi implementada uma metodologia para a construção de mapas de transição dos átomos de carbono, que pode ser usado conjuntamente com modelos metabólicos. Neste caso, foram construídos os mapas de transição de átomos de carbono para o metabolismo central da Escherichia coli e da Actinobacillus succinogenes. As bases de dados MetaCyc e KEGG foram exploradas para obter as informações metabólicas necessárias à construção destes mapas.
L
IST OF ABBREVIATIONS13C-MFA 13C-metabolic flux analysis
2PG 2-phosphoglycerate
3PG 3-phosphoglycerate
6PG 6-phospho gluconate
AcCoA Acetyl-CoA
Ace Acetate
AcP Acetyl phosphate
Acp Acceptor
Ald Acetaldehyde
ATM Atom transition model
cis-Aco cis-Aconitate
Cit Citrate
CO2 Carbon dioxide
DHAP Glycerone phosphate
E4P Erythrose-4-phosphate
EtOH Ethanol
F1,6P Fructose-1,6-bisphosphate
F6P Fructose-6-phosphate
FBA Flux balance analysis
For Formate Fum Fumarate G1,3P Glycerate-1,3-diphosphate G1,5L6P Glucono-1,5-lactone-6-phosphate G3P Glyceraldehyde-3-phosphate G6P Glucose-6-phosphate GLC Glucose ID Unique-identifier Iso Isocitrate
IUPAC International Union of Pure and Applied Chemistry KEGG Kyoto Encyclopedia of Genes and Genomes
MAL Malate
MFA Metabolic flux analysis
NC-IUBMB Nomenclature Committee of the International Union of Biochemistry and Molecular Biology
NCBI National Center for Biotechnology Information
OAA Oxaloacetate PEP Phosphoenolpyruvate Pi Orthophosphate Pyr Pyruvate R5P Ribose-5-phosphate Rbu5P Ribulose-5-phosphate S7P Sedoheptulose-7-phosphate Suc Succinate SucCoA Succinyl-CoA
TCA Tricarboxylic acid cycle
X5P Xylulose-5-phosphate
T
ABLE OFC
ONTENTS1. SCOPE AND MOTIVATION ... 8
2. OBJECTIVES ... 10
3. INTRODUCTION ... 11
3.1.GENOMIC SCALE MODELS ... 11
3.2.METABOLIC PATHWAYS AND DATABASES ... 13
3.3.FLUX ANALYSIS... 15
3.4.CASE-STUDIES ... 19
3.4.1.ESCHERICHIA COLI ... 19
3.4.2.ACTINOBACILLUS SUCCINOGENES ... 19
4. METHODOLOGY ... 21
5. RESULTS AND DISCUSSION ... 30
5.1.CARBON ATOMS MAPPING MODEL OF E. COLI ... 30
5.2.CARBON ATOMS’ MAPPING MODEL OF A. SUCCINOGENES ... 39
6. CONCLUSIONS ... 44
7. BIBLIOGRAPHICAL REFERENCES ... 46
APPENDIX A – DATABASES ... 1
APPENDIX B – DATA RESULTED FROM ALGORITHM FOR ASUS ... 2
1. S
COPE AND MOTIVATIONThe cellular metabolism is a highly coordinated system consisting of two basic types of biomolecules: enzymes and metabolites, which interact to provide energy and building blocks for cellular growth, maintenance and other activities (Jeong et al. 2000; Nelson & Cox 2008). This system is often represented as a metabolic network that is a collection of biochemical reactions that represent metabolic conversions between chemical compounds. These networks can be used to explore the production of a biochemical compound from a given set of starting compounds through several biochemical reactions (Alberts et al. 2014). The analysis of those metabolic conversions is very important to understand the cellular metabolism and to explore novel metabolic pathways for the synthesis of chemical compounds. The possibility of promoting the production of a compound in a certain biological system is very appealing to the industry.
With advances in biochemical techniques, chemical reactions occurring in biological systems have been characterized and catalogued within metabolic databases, such as MetaCyc (Caspi et al. 2010) and KEGG (Kyoto Encyclopedia of Genes and Genomes (Goto et al. 2000)); and associated with metabolic pathways, like glycolysis, pentose phosphate and the tricarboxylic acid cycle, usually know as TCA (Papin et al. 2003). In addition, “-omics” data are expanding information regarding these molecular interactions, providing snapshots of the metabolism under specific conditions, increasing the biochemical and physiological information available (Durot et al. 2009).
In this work, the identification and investigation of chemical reactions and their metabolic information was central, thus databases and information resources mentioned above were key resources. Furthermore, the reconstruction of a metabolic network is based in the genomic, chemical and network information provided by these bioinformatics web resources, therefore by exploring those a compilation of a wide range of metabolic information may be fulfilled. The analysis of the reconstruction of a metabolic network is very important to define strategies to improve or inhibit the production of a metabolite.
For a better understanding of metabolic systems, the network structure and flux distribution analyses of metabolic networks have been explored (Stefan et al., 2012; Trang et al., 2012; Kurata et al., 2007; Chen et al. 2009). In particular, isotopically labeled substrates have been used to trace the transition of atoms and estimate the flux distribution in a metabolic network. The use of stable isotopes, such as 13C, allows tracing the carbon atoms among various metabolic
intermediates within a metabolic pathway or between pathways.
In such studies, the representation of atoms transitions in biochemical reactions is essential to investigate how the carbon labeling is distributed throughout the network. Therefore, a methodology for constructing atom transition maps corresponding to the metabolic reactions comprised in these networks was developed. These maps will, ultimately, integrate procedures for the flux analysis in model microorganisms (e.g. Escherichia coli (E. coli)) through
2. O
BJECTIVESThis work aims to implement a methodology to construct atom transition maps that can be used to trace atom transition patterns in metabolic networks. To achieve this goal it is crucial to explore the chemical conversions associated with these metabolic activities and assess the changes in atom’s position among the metabolic intermediaries involved in those conversions.
Databases such as KEGG and MetaCyc allow to extract specific data regarding the transition of atoms from substrates to products in biochemical reactions. The main objectives in this work were to construct a metabolic atom transition map for the central carbon metabolism of E. coli, which was compared to a previously published map, and then, to construct an atom transition network for the central carbon metabolism of Actinobacillus succinogenes (A. succinogenes). The first case-study is intended to validate the implemented methodology to construct atom transition maps, while the second provides evidence for the application of this methodology to other case-studies.
3. I
NTRODUCTION3.1.
G
ENOME-
SCALE MODELSThe cellular metabolism is a global network of all biochemical reactions, which is based on molecular interactions in metabolic processes (Nelson & Cox 2008). Systems biology studies the interactions between metabolites, enzymes and regulatory factors, and how they influence the behavior of a cell. Through computational methods, systems biology is able to model the metabolic system and predict the effect of these specific interactions in cells phenotype. The metabolism is very coordinated, complex and a dynamic process, where the enzymatic reactions convert metabolites into others that are necessary to support cell survival. Therefore the identification and representation of all metabolic activities of a system are fundamental to understand the metabolism of a cell and how it can be controlled. Using this information, the metabolic engineering attempts to select key metabolic targets and manipulate them to produce value-added compounds (Blazeck & Alper 2010).
Recent findings in the systems biology field support that robustness of many cellular processes is engrained in the dynamic interactions among its constituents, like proteins, DNA and small molecules. Improved capability to identify these constituents that participate in such a complex system has been fundamental. Genomic sequencing and metabolic information were necessary to integrate pathway-genome that provide connectivity maps of metabolic and cellular networks (Jeong et al. 2000). Through the progressive advances in genetics and high-throughput techniques, metabolic information has been growing, precisely characterized and catalogued (Papin et al. 2003; Bairoch et al. 2000). These catalogues has been helping to identify the constituents and how their interactions can be manipulated (Patil et al. 2004). Whether it is intended to increase or decrease the production of a particular component or metabolite in a cell, it is necessary to identify the metabolic processes involved and understand their limitations (Schilling et al. 1999) (Heath et al. 2010).
Many organisms have now their genomes sequenced, particularly microorganisms that are considered industrially relevant. For instance, E. coli is
the most characterized and studied bacterium that is used to produce recombinant proteins, such as biosynthetic human insulin (Goeddel et al. 1979). A first E. coli model was developed to predict the cellular phenotype under different conditions (Edwards & Palsson 2000). Similarly, the genome of Saccharomyces cerevisiae (S. cerevisiae), a yeast commonly used in industry for ethanol, alcoholic beverages, leavening production and also considered a food additive for human (Lin & Tanaka 2006), has been completely sequenced since 1997 (Goffeau et al. 1996). Since yeasts are capable to produce several compounds of industrial interest and are easy to manipulate and maintain on a large scale in laboratory, there was an interest to have a complete genome sequence and to assess their gene functions, namely metabolic capabilities. This information has been also used to reconstruct genome-scale metabolic models that are used to represent and model the cellular metabolism (Patil et al. 2004; Nielsen & Olsson 2002; Nelson & Cox 2008).
Due to their industrial relevance, these and other genome-scale metabolic models have been developed and widely applied within Metabolic Engineering projects. For instance, Cintolesi and co-workers (Cintolesi et al. 2012) have identified key metabolic targets in E. coli that can be manipulated in order to enhance the production of glycerol.
Metabolic Engineering approaches are used to find the best alterations in the complex metabolic network that may increase the production of a specific target, either by introducing genetic controls that allow to manipulate the level of expression of several enzyme-coding genes or deleting those genes (Blazeck & Alper 2010). These approaches have received increasing interest due to some successful applications in industrial biotechnology (Rocha et al. 2010; Patil et al. 2004). For example, microalgae have the ability to produce hydrocarbons and molecular hydrogen in large quantities (Zaslavskaia et al. 2001). For this reason it is considered a potential source for renewable fuels. With different strains and growth conditions, up to 75% of the biomass can be hydrocarbons (Gavrilescu & Chisti 2005). Another example is pharmaceutical synthesis. In the work developed by Savile et al. (Savile et al. 2010) a chemical process for an efficient
biocatalytic to product sitagliptin, an antidiabetic compound, in a large scale was replaced.
3.2.
M
ETABOLIC PATHWAYS AND DATABASESThe cellular metabolism is the collection of many interconnected reactions sequences that are regulated by some enzymes in order to provide the needs of a cell. The enzymes work together in sequential pathways to catalyze the reactions to obtain specifics metabolites. The enzymes are present as multi-enzyme complexes in the cell, responsible for important transformations in organic chemistry and biocatalysts, greatly enhancing the rate of specific reactions in the cell (Drauz et al. 2012; Nelson & Cox 2008).
The enzymes are classified according to the reactions they catalyze. The name of each enzyme has the suffix “-ase” preceded by the name of the main substrate or a term that describes its general activity. An international classification, also known as Enzyme Commission number (E.C. number), has be adopted to categorize enzymes into six classes:
1. Oxidoreductases: oxidation-reduction
Catalyze the transfer of electrons (hydride ions or H atoms) acting on the reduction of C=O and C=C groups; the reductive amination of C=O; oxidation of C-H, C=C, C-N, and C-O; cofactor reduction/oxidation;
2. Transferases: chemical group transfers
Catalyze the transfer of functional groups such as amino, acyl, phosphoryl, methyl, glycosyl, nitro, and sulfur-containing groups;
3. Hydrolases: hydrolytic bond cleavages
Catalyze the hydrolysis of chemical bonds (i.e., transfer of functional groups to water): hydrolysis of esters, amides, lactones, lactams, epoxides, nitriles, etc;
4. Lyases: nonhydrolytic bond cleavages
Catalyze the bonds by addition or removal of the functional groups (for example C=C, C=N and C=O);
Catalyze the transfer of groups within molecules to yield isomeric forms – isomerizations, such as racemizations, epimerizations, and rearrangement reactions. The isomerization has an important role in the overall chemistry of some pathways, for example in the glycolysis, because the rearrangement of the carbonyl and hydroxyl group. The isomers can differ in the arrangement of their carbonyl group (α and β) or are mirror images of each other (L and D);
6. Ligases: joining together two or more molecules
Catalyze the condensation of two molecules. Similar to lyase but enzymatically active only when combined with ATP cleavage (Copeland 2004).
Despite various enzymatic studies, it is still difficult to define the properties of most enzymes, but it is already evident that enzyme catalyzes chemical conversion of functional groups involving distinct mechanisms that are mostly conserved among biological systems (Ramanathan & Agarwal 2011).
Most of the required knowledge provided by experimental studies on metabolic networks to construct a metabolic model is scattered in literature and databases (see Table 3.1 and in Appendix A for further information). Particularly, databases are repositories with well-characterized pathways, reactions, enzymes, etc., that span most of the metabolic capabilities that we can find in nature (Blazeck & Alper 2010). Metabolic databases (Table 3.1) normally dispose biochemical reactions in pathways or modules that contextualize the metabolic capabilities of different organisms.
Many databases allow to access different levels of information, like KEGG that contains genomic, chemical and functional information associated with each molecular level within an organism system. This allows having a more comprehensive overview of the metabolic structure and coordination of most processes occurring in a particular system (Kanehisa et al. 2014).
Through the cataloging of the results of biochemical experiments, the reactions are associated to one or more pathways, like glycolysis, pentose phosphate and the TCA pathways, the metabolites are organized by reactions
and enzymes according to their catalytic role involving those metabolites (Papin et al. 2003; Bairoch 2000).
Table 3.1 – Databases most explored for metabolic data. Each database is represented with their name, their web address and with a small description.
3.3.
F
LUX ANALYSISWith the advent of “omics” technologies, like genomics, transcriptomics, proteomics, metabolomics and fluxomics, a new systems-wide knowledge has been generated. Systems biology attempts to understand the cellular metabolic networks and predict how metabolism behaves in particular conditions through mathematical modeling and computational methods (in silico simulation) (Park et al. 2009; Paul Lee et al. 2010). The increasingly large amounts of data
Metabolic databases
CheBI Ebi.ac.uk/chebi Dictionary of molecular entities (constitutionally or isotopically distinct atom, molecule, ion, ion pair, radial, radial ion, complex…) focused on “small” chemical compounds. This database incorporates an ontological classification (the relationships between molecular entities or classes of entities and their parents/children are specific) and follow the rules of international scientific bodies, IUPAC and NC-IUBMB;
PubChem Pubchem.ncbi.nlm.nih.gov Repository for chemical structures and their biological test results. It is organized as three linked databases: Substance contains contributed sample descriptions; Compound, contains unique chemical structures derived from subtracts; and BioAssay, contains biological tests. This database can be accessed through the NCBI Entrez system.
KEGG Genome.jp/KEGG Bioinformatic resource for understanding the functional meaning and the utilities of the cell or the organism from its genome information. This database contains information regarding molecular interaction networks like pathways and complexes – protein network (Pathway database), genes and proteins generated by genome projects – gene universe (Genes database) and biochemical compounds and reactions – chemical universe (Compound/Reaction database).
MetaCyc Metacyc.org Universal reference of metabolic pathways, verified experimentally, and enzymes information curated from the scientific literature. Is a non-redudant database of small-molecule metabolism and contains pathways involved in both primary and secondary metabolism, and their association to metabolites, reactions, enzymes and genes.
concerning metabolic networks provide the information required to computational identification of pathways with biological relevance, which are necessary to applications like metabolic engineering, metabolic network analysis and metabolic network reconstruction (Heath et al. 2010).
In order to adapt the huge quantity of data and integrate the genetic and biochemical processes, computer models are generated. The stoichiometric model is an example and a pioneer approach (Sanford et al., 2002).
Two main mathematical representations of metabolic models have been used to describe the cellular metabolism: kinetic models and stoichiometric models. Briefly, kinetic models consider the dynamic proprieties of metabolic reactions, combining stoichiometric information and kinetic parameters. On the other hand, the stoichiometric models define the metabolic network as a set of stoichiometric equations that represents all intracellular biochemical reactions (Christensen et al. 2002; Patil et al. 2004).
To quantitatively analyze the cellular metabolism it is necessary to understand how enzymes catalyze the reactions that compose the cellular metabolism. The catalysts can be controlled at the enzymatic level through inhibitors, often metabolites being produced by the catalyst itself. This and other regulatory layers need to be represented when the global control of cellular metabolism is described (Copeland 2004). Unfortunately, for many enzymes the availability of information regarding kinetic parameters is scarce, which is essential to estimate catalytic rates – fluxes (Winter & Krömer 2013).
A crucial feature to find meaningful metabolic pathways is the atom mapping. The atom mapping track the atoms through the metabolic networks and the tracking results are essential to obtain insights about meaningful and functional pathways. One of the applications of atom mapping is to assess the transition of a selected atom, usually carbon atoms, from one compound into another. It is useful to select pathways biologically relevant because eliminates false connections. The atoms mapping can also track atoms in the isotope labeling experiments that are used to elucidate metabolic pathways (Latendresse et al. 2012; Heath et al. 2010).
Without the measurement of the fluxes, the ability to quantitatively analyze the metabolism is limited. As a result, different approaches have been developed to estimate fluxes, such as constraint based metabolic flux analysis (MFA) and flux balance analysis (FBA) (Winter & Krömer 2013).
Flux analysis combines metabolic fluxes measurements with stoichiometric network models to determine the distribution of metabolic fluxes (Sauer 2006; McKinlay et al. 2007). MFA and FBA approaches assume a steady state to examine phenotypic alterations in a microorganism under different environmental and genetic conditions (Rocha et al. 2010). The MFA has been used to characterize the flux distribution, through internal fluxes estimation combining isotope labeling techniques and mathematical analysis. Normally, FBA is applied to estimate the cellular growth rate under certain conditions through a linear objective function (Covert et al. 2001). But, FBA can also use alternative objective function, such as the maximization of ATP or reducing power, and the maximization of a single biochemical reaction. Therefore, the objective function depending on the purpose can be applied to maximize the growth rate or minimize one product formation (Park et al. 2009).
FBA is able to determine an optimum metabolic flux distribution, without requiring details of enzyme kinetics or metabolite concentrations, in a genome-scale network, but has some limitations to predict fluxes for reversible reactions and parallel reaction (Wiechert 2001).
The metabolic fluxes are related to the relative isotopic abundances of different metabolites. Typically, carbon isotopes, either radioactive 14C or stable 13C (most used) are used to estimate these fluxes using mapping matrices, which
trace those isotopes, also known as isotopomers, that are differently labeled variants of the same molecule. Originally it was exemplified as atom-mapping matrices that trace the carbon atom transitions from reactants to products (Latendresse et al. 2012). Most recently, it was simplified as isotopomer mapping matrices that enumerate all possible product isotopomers that can be created from each reactant isotopomers (Ravikirthi et al. 2011; Zupke & Stephanopoulos 1994).
13C-metabolic flux analysis (13C-MFA) has been developed to overcome some
of the limitations found in FBA and stoichiometric MFA, namely the measurement of intracellular metabolic fluxes, the determination of fluxes in parallel pathways and reversible reactions (Crown & Antoniewicz 2013). With this approach, the input from carbon atom transitions along with measurements of metabolic fluxes provides information to impose restrictions to the optimization problem, allowing to obtain more consistent and reliable prediction of flux distributions (Wiechert 2001; Stephanopoulos et al. 1998). In the past few years, experiments with isotopic labelling have shown to be very valuable to analyze and discover metabolic pathways (Niittylae et al. 2009). Some examples are the work by Lanfermann and co-workers that uses 13C-labelled precursors
and 18O-water to elucidate the metabolism of the amino acids and to prove the
activity of an oxygenase in the pathway to sotolon (Lanfermann et al. 2014); also the work developed by Rattray and co-workers, where they explore the possible biosynthetic pathways of ladderane lipids in anammox bacteria through the use of 2-13C-labelled acetate (Rattray et al. 2009).
Carbon isotope-labelling experiments have been valuable to estimate metabolic fluxes (Jouhten et al. 2009). For instance, Jouhten et al. used a computational carbon path analysis to reconstruct the biosynthetic pathways of amino acids for Trichoderma reesei (T. reesei). The intracellular metabolic flux ratios in the central carbon metabolism were determined using a partial 13C
labelling and metabolic flux ratio analysis (Jouhten et al. 2009).
Another example, McKinlay et al. (2007) grew Actinobacillus succinogenes (A. succinogenes) with [1-13C] glucose and used these data to infer metabolic fluxes
based on the mass isotopomer distributions of amino acids, organic acids and glycogen monomers. With this experiment, important aspects of the A. succinogenes metabolism were found, namely the carbon flux distribution toward succinate production and the formation of alternative products and their biosynthetic pathways (McKinlay et al. 2007).
Software tools and resources emerged to integrate the high throughput data, the system complexity and the knowledge, for metabolic analysis (Weitzel et al. 2013; Quek et al. 2009; Zamboni et al. 2005). OptFlux is an example of a powerful
computational tool for in silico metabolic engineering applications. On top of this software, the CBFA tool has been developed (Carreira et al. 2014). This tool can be used to perform stoichiometric metabolic model simulations under different environmental and genetic conditions, in order to trace desired compounds, improve their production and analyze the resulting flux distribution, given a set of flux measurements and constraints through the application of MFA methods (Rocha et al. 2010).
3.4.
C
ASE-
STUDIES3.4.1. ESCHERICHIA COLI
E. coli is a prokaryotic model-organism, perhaps the best characterized and well-studied bacterium with relevance for industry. This organism is present in the lower intestine of humans, facility grown in a laboratory setting and is readily ease to be manipulated genetically. Due to the interest in this gram-negative bacterium, in silico modeling of its cellular behavior has been helpful (Milne et al. 2009). Most of the metabolic data for this organism was experimentally verified and so, the current reconstructions of E. coli metabolic network are the best representation of the metabolic capabilities of this organism (McCloskey et al. 2013; Edwards & Palsson 2000; Edwards et al. 2001). These models have been used to design E. coli strains through in silico analyses to increase the production of target metabolites, like lycopene, lactic acid, ethanol, succinic acid, L-valine, L-threonine and more (Feist & Palsson 2008). E. coli K-12 is the most widely studied strain of E. coli and so, a reference for this species which is used in numerous works (Richmond et al. 1999).
3.4.2. A
CTINOBACILLUS SUCCINOGENESIn this work the metabolism of the Actinobacillus succinogenes (A. succinogenes or Asus), a gram-negative capnophilic (i.e. grows with high concentrations of carbon dioxide), bacterium isolated from the bovine’s rumen was analyzed. This bacterium is one of the most promising succinate producers,
can accumulate large quantities of succinate and so such is considered an industrially relevant biocatalyst (Guettler et al. 1999; Mckinlay et al. 2010). Succinate is an attractive chemical platform for the production of various value-added derivatives, such as 1,4-butanediol (precursor of “stronger-than-steel” plastics), ethylenediamine disuccinate (a biodegradable chelator), diethyl succinate (a green solvent for replacement of methylene chloride), and adipic acid (nylon precursor) (Mckinlay et al. 2005). On rumen, it is a relevant metabolic intermediate and also a source of energy for many bacteria (Mckinlay et al. 2010).
Among several microorganisms, A. succinogenes is one of the best producers described so far. This organism to produce highest concentrations of succinate also produces a formate and acetate. Since succinate is the product of interest, several studies have been done to improve the homofermentative production of succinate by decreasing or inhibiting the production of other by-products (Lin et al. 2008).
Succinic acid is an end-product of microbial fermentation. Metabolic engineering combined with genetic engineering explore the different pathways and due to its peculiar ability to produce this acid naturally from a vast source of carbons (Lin et al. 2008), this organism can be used for analyzing the metabolic control effects of CO2 and the reducing power on flux distribution between PEP,
pyruvate, OAA and malate (McKinlay et al. 2007).
The glucose-6-phosphate is catabolized in PEP and then converted in fermentation products that are split in two branches: C3 pathway (leading to
formate, acetate, ethanol) and C4 pathway (leading to succinic acid); with malic
enzyme and OAA decarboxylase catalyze reversible reactions between these pathways (Mckinlay et al. 2010).
The metabolic map of this organism will be very important to MFA and to apply engineering designs for understand and optimize chemical production. For a better understanding of how the metabolism of A. succinogenes works, 13C
labeling experiments to measure intracellular metabolic fluxes can be applied (Mckinlay et al. 2005).
4. M
ETHODOLOGYA Java-based generic tool was implemented to map the transition of carbon atoms in biochemical reactions, such as the ones in the central carbon metabolism of E. coli and A. succinogenes. The previously published carbon atom transitions model for E. coli (Latendresse, Malerich, Travers, & Karp, 2012) served as a reference in this work and was compared to the reconstructed model for E. coli using the implemented methodology as a proof-of-concept. The carbon atom transitions model for the central carbon metabolism of A. succinogenes was then constructed comprising the following metabolic pathways: glycolysis, pentose phosphate pathway, TCA cycle and pyruvate metabolism.
To facilitate and automate the construction of such atom transition models, a Java algorithm was designed and implemented in order to extract, process and compile information from different biological databases (i.e. KEGG and MetaCyc) and construct the atom transitions for the defined set of metabolic reactions. Procedures are detailed next and Figure 4.1 shows a schematic illustration of the overall procedure:
1. Definition of the reactions set. The set of reactions associated with the previously mentioned pathways were assembled. For each reaction a unique identifier, either a KEGG ID or a MetaCyc ID was associated (Figure 4.2). If a KEGG ID is associated, the corresponding MetaCyc ID was retrieved using a previously compiled file with a list of reactions and the corresponding cross-references to MetaCyc ID. Otherwise, a MetaCyc ID could be directly associated by manual curation.
Figure 4.1 – Methodology pipeline. The reactions set was used as an input file, where a list of reactions with a corresponding ID, either KEGG ID or MetaCyc ID was used to extract and obtain the required information from MetaCyc files (e.g., “Reaction file” and “MolFile”). If an ID is not provided, manual curation to attribute a MetaCyc ID is required. For each reaction it is retrieved the reactants, products, atoms mapping for products, directionality and IDs from others databases (external IDs sources). The reactants and products with their number of atoms and their atoms position (acquired with the respective “MolFile”) are extracted and, using the atoms mapping for products the carbon atoms mapping is reconstructed. The MetaCyc ID, the reactants the products, the carbon atom transitions, the direction of the reaction and the external IDs sources obtained, were organized for each reaction. All reactions mapped are complied and added to the input file.
Figure 4.2 – File format of the corresponding KEGG IDs and the MetaCyc IDs for each reaction. This csv format file is divided in two columns, the first with KEGG ID (1) and the second the corresponding MetaCyc ID (2).
2. Collection of data from KEGG (Version updated in September 1, 2014) and MetaCyc (Version 18.1 updated in June 23, 2014). Information regarding the chemical conversions and enzymes associated with the defined reactions set was retrieved. A “Reactions file” and “Molfiles” from MetaCyc were used to retrieve information associated with reactions previously defined. The “Reactions file” contains the reaction atom–atom mapping and is structured as follows (see Figure 4.3): each reaction is identified by a unique-identifier (1) with several attributes like atoms mapping (2), reactants (by order), products (by order), external links (3) and reactions directionality (4). Each compound has a corresponding “Molfile” (Figure 4.4), which is provided only by MetaCyc, that contains information regarding atoms, bonds, connectivity and coordinates of a molecule (depicted as 2 in Figure 2).
Figure 4.3 – Example of the information associated to each reaction in the Reactions file.
The information contained in the file follows the same structure comprising the following attributes: the unique-identifier (1), the atoms mapping (2), the reactants (2), the products (2), the external links (3) and the reaction directionally (4), which are the attributes of interest.
Figure 4.4 – Example of a Molfile structure. All the compounds have a corresponding Molfile comprising the following information: the name of the compound (1) in the first line; and two blocks of information corresponding to the atoms position, bonds, connectivity and coordinates of a molecule. The information used in this work is depicted by (2) corresponding to the atoms position.
3. Data integration (Figure 4.5a). For each reaction in the input file, the reaction ID was retrieved. It is performed an automatically cross-reference to attribute a MetaCyc ID (if the reaction ID retrieved didn’t belong to MetaCyc). If no cross-references were provided was made a manual research to attribute a MetaCyc ID. The MetaCyc ID is used to
extract and process information from MetaCyc. Reactions that have no corresponding MetaCyc ID were not integrated.
Figure 4.5a – Illustration of a carbon atom’s mapping for the reaction with KEGG ID: R02740. The input file, containing a set of reactions, is imported and verified if a KEGG ID is provided. For the first reaction (R02740) an automatically association is performed, since a MetaCyc ID is associated (MetaCyc ID: RXN-6182). The corresponding data in the “Reaction File” is searched for this ID.
4. Data filtration (Figure 4.5b). The atoms mapping for products, reactants, products, reaction’s directionality and the external sources for each reaction with MetaCyc ID in the “Reactions file” were retrieved:
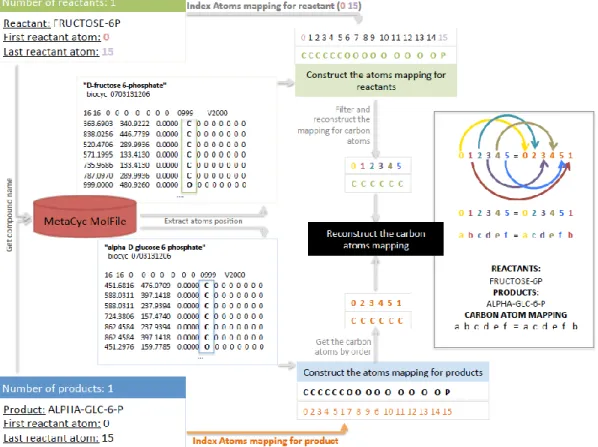
Figure 4.5b – Illustration of a carbon atom’s mapping for the reaction with KEGG ID: R02740. The information available for this reaction is then retrieved. As illustrated, the “ATOM-MAPPINGS” has the information regarding: the atoms mapping for the product (0 2 3 4 5 1 7 8 9 6 10 11 12 13 14 15; the reactant ID (FRUCTOSE-6P) with its number of atoms (0 to 15); the product ID (ALPHA-GLC-6-P) with its number of atoms (0 to 15); the “DBLINKS” containing the external IDs for different databases, such as RHEA and LIGAND-RXN; the “REACTION-DIRECTION” with the directionally of the reaction, in this case the reaction is reversible.
a. Get reaction direction. The directionality of a reaction can be assigned either as right-to-left, left-to-right, reversible or with no information.
b. Extract external IDs sources. The external IDs of a reaction can be from Rhea, Ligand-RXN, Uniprot and/or Pir. A reaction can have more than one external ID and several IDs from the same source, so the external IDs were distributed by source and grouped.
c. Atoms transition maps (Figure 4.5c).
i. Identification of carbon atoms positions. Compounds in a reaction were either identified as reactants or products, and, for each, the position of the first and last atoms was retrieved. Using the “MolFiles” for each compound, all atoms position was identified.
ii. Mapping carbon positions of reactants. To build the carbon
atoms’ mapping for reactants, it was verified the position of the first and last atom of each reactant and, according to its atoms position, the atoms were sequentially added. Yet, only the carbon atoms had their position identified to construct the map.
iii. Mapping carbon positions of products. To build the carbon atoms’ mapping for products, it was verified the position of the first and last atom of each product and, according to the atoms mapping extracted, the positions identified with carbon atoms in the map for reactants were added and the map was reconstructed. If exist two or more atoms mapping in the “Reaction file”, by default only the first is extracted.
iv. Building the carbon atom transitions map. For each carbon position in the reactant map was designated a letter (by order) and, the same letter was designated to the same position in the product map. The reactants, the products and the respective maps were compiled to build a reaction carbon atom transitions map.
Figure 4.5c – Illustration of a carbon atom’s mapping for the reaction with KEGG ID: R02740. The name of the reactant and the product is used to search their corresponding “MolFile”, and then the atoms positions are identified. To construct the carbon atoms map for reactants, the position of the first and last atom of FRUCTOSE-6P that is sequentially (0 1 2 3 4 5 6 7 8 9 10 11 12 13 14 15) is indexed to the atoms position (C C C C C C O O O O O O O O O P). The positions of the carbons are filtered and the map is reconstructed taking in account only the carbon atoms and their numeral position. To construct the carbon atoms map for products, the atoms mapping are extracted (0 2 3 4 5 1 7 8 9 6 10 11 12 13 14 15) and indexed to the atoms position (C C C C C C O O O O O O O O O P), and the position identified with carbon atoms in the map of reactants are filtered and extracted orderly. For each carbon position in the reactant map a letter has been designated (by order) and, the same letter was designated to the same position in the product map (0 = a; 1 = b; 2 = c; 3 = d; 4 = e; 5 = f). The FRUCTOSE-6P and the ALPHA-GLC-6-P have the respective maps (a b c d e f = a c d e f b) compiled to build a reaction carbon atom transitions map.
5. Output file (Figure 4.5d). All the reactions with an associated MetaCyc ID were complied and added to the metabolic information input file. The output file is the input file with additional information – reactants and products, carbon atom transition map, the external IDs and reactions directionality.
Figure 4.5d – Illustration of a carbon atom’s mapping for the reaction with KEGG ID: R02740. The reaction and their reactants and products, carbon atoms mapping, external IDs and directionality are complied and when all reactions are mapped, they are added to the input file to compile the output file.
All these results were validated by manually inspecting the constructed transition maps and information presented in literature and MetaCyc’s webpage.
5. R
ESULTS AND DISCUSSION5.1. C
ARBON ATOMS MAPPING MODEL OFE.
COLIA list of 57 reactions and their carbon atom transitions associated with central carbon metabolic pathways for E. coli was used to validate the developed algorithm (Quek et al. 2009; Ravikirthi et al. 2011). For each reaction a KEGG or MetaCyc ID was associated. However, for most reactions associated to amino acid biosynthetic pathways it was not possible to associate an MetaCyc ID, as these corresponded to lumped reactions, for example the reaction: oxaloacetate = aspartate (see Table 5.1).
Table 5.1 – Reactions presents in the input file and their association with an identifier. Database identifier Number of reactions Percentage
MetaCyc and correspondent KEGG ID 27 49.10 %
None 30 50. 90 %
Total 57 100 %
From the 57 only 27 reactions were associated to a MetaCyc ID and for those it was possible to construct a carbon atom transition and compare it with the published carbon atom transitions. This comparison was performed by manual inspection to guarantee that no errors were included. From the comparison of the 25 reactions only 2 reactions presented a different carbon atom transitions. The two reactions were then inspected (Figures 5.1 and 5.2).
Figure 5.1 – Reaction schema of RXN-6182: D-glucose 6-phosphate ↔ β-D-fructofuranose 6-phosphate,, adapted from MetaCyc database. The enzyme glucose-6-phosphate isomerase (E.C. number 5.3.1.9) catalyzes the reversible isomerization of D-glucose phosphate to β-D-fructofuranose 6-phosphate.
(5.3.1.9)
Figure 5.2 – Reaction schema of TRIOSEPISOMERIZATION-RXN: D-glyceraldehyde 3-phosphate ↔ dihydroxyacetone 3-phosphate, adapted from MetaCyc database. The enzyme triose-phosphate isomerase (E.C. number 5.3.1.1), catalyzes the reversible isomerization of D-glyceraldehyde 3-phosphate to dihydroxyacetone phosphate.
Both are isomerization reactions involving an intramolecular rearrangement of the reactants by the redistribution of electrons within the specific functional groups, yielding isomeric forms. As such, it is plausible that differences in the carbon transitions are due to dissimilar molecular conformations. These stereoisomers can assume different positions in space and according to these rearrangements the position of the carbons can change. In the reaction RXN-6182, the glucose-6-phosphate isomerase transfers the carbonyl group of D-glucose phosphate forming an isomer, β-D-fructofuranose 6-phosphate. In the validation model it is not specified which of the enantiomer it is considered (i.e., D or L) or which epimer it is (i.e., α or β), however this reaction was initially associated to the MetaCyc ID RXN-6182. A second reaction ID (PHOSPHOGLUCMUT-RXN) that it is also associated with this reaction (glucose 6-phosphate ↔ fructofuranose 6-phosphate) was thereafter used and the carbon atom transition resulted is the same as the validation file. Since this reaction has a crucial role in the chemistry of glycolytic pathway, because of the rearrangement of the carbonyl and hydroxyl groups are a prelude to the next steps of the glycolytic pathway, it is important to consider the correct reactants conformation (Nelson & Cox 2008).
In the reaction TRIOSEPISOMERIZATION-RXN (Figure 5.2), the enzyme triose-phosphate isomerase catalyzes the interconversion of D-glyceraldehyde 3-phosphate in dihydroxyacetone 3-phosphate. Using the same method as in the previous example, a manual inspection was performed to attribute an identifier to a reaction with a reactant with a different conformation, but no reaction in the database MetaCyc was found.
D-glyceraldehyde 3-phosphate dihydroxyacetone phosphate (5.3.1.1)
If the set of reactions contains isomerization reactions they need to be identified for when was associated an atom mapping a manual curation be made, in order to confirm if the atom mapping associated is correct.
After this first validation test, a core metabolic model of E. coli was used to map the carbon atom transitions of 74 reactions, where each reaction is identified by a “CoreModel ID” and has information regarding the reactants, products and directionality. Reactions of the input model were manually assigned to a metabolic pathway and to a MetaCyc or a KEGG ID.
Figure 5.3 shows how the 74 reactions in the core model were assigned to individual pathways. 19 reactions were associated with the transport of extracellular metabolites
Figure 5.3 – Representation of the relative number of reactions assigned to individual pathways.
The others pathways have all their reactions associated to a MetaCyc, unless the inorganic ion transport, 2 reactions are related to this pathway but only 1 has a MetaCyc ID associated, and the metabolism and the oxidative phosphorylation, in this pathway 8 of 9 reactions has a MetaCyc identifier.
From the 74 reactions, only 49 reactions were associated to a KEGG ID and 48 were automatically linked by cross-references to a MetaCyc ID. To the 26 reactions without a MetaCyc ID, a manual search in order to attribute more
Reactions in CoreModel of E. coli
Anaplerotic reactions Citric Acid Cycle Glutamate Metabolism Glycolysis/Gluconeogenesis
Inorganic Ion Transport and Metabolism Oxidative Phosphorylation
Pentose Phosphate Pathway Pyruvate Metabolism Transport, Extracellular
identifiers was performed. In total, 63 reactions were associated to a MetaCyc ID and 49 reactions had an associated KEGG ID, indicating that data integration between these two data sources is still poor (Figure 5.4).
Figure 5.4 – Quantity of reactions in the CoreModel with an identifier from MetaCyc and KEGG associated. To a total of 74 reactions presents in the input CoreModel, 63 have an identifier from MetaCyc and 49 an identifier from KEGG.
Although it might seem disadvantageous to use KEGG IDs to link reactions to MetaCyc IDs, this algorithm was designed to take advantage of cross-links often contained in genome-scale models. Because MetaCyc IDs have not been extensively used in genome-scale models as KEGG IDs, this may speed up the initial step of the proposed procedure by simplifying the manual curation step.
0 74 MetaCyc ID Kegg ID Tot al o f re ac tio n s
Table 5.2 – Reactions of the core model of E. coli and the associated carbon atom transitions constructed using the developed algorithm. Reactions in the CoreModel were associated to a metabolic pathway, MetaCyc ID, KEGG ID and the carbon atom transitions.
CoreModel ID MetaCyc ID KEGG ID Reaction Carbon Atoms Mapping
Anaplerotic reactions
R_PPCK PEPCARBOXYKIN-RXN R00341 ATP + OAA -> ADP + PEP + CO2 abcd = abd + c R_ICL ISOCIT-CLEAV-RXN R00479 Icit -> GLX + SUC abcdef = df + abce R_PPC PEPCARBOX-RXN R00345 H +Pi + OAA <-> H20 + CO2 + PEP abc + d = abdc R_ME1 1.1.1.39-RXN R00214 NADH + PYR + CO2 -> NAD + MAL abc+ d = abdc R_ME2 MALIC-NADP-RXN R00216 NADP + MAL -> NADPH + PYR + CO2 abc + d = abdc
R_MALS MALSYN-RXN R00472 H20 + AcCoA + GLX -> H + CoA + MAL abcdefghijklmnopqrstuvw + xy = cbdefghijkmnopqrstuvw + axly Citric Acid Cycle
R_FUM FUMHYDR-RXN R01082 H2O + FUM <-> MAL abcd = badc
R_ICDHyr ISOCITDEH-RXN R00267 NADPH + alphaKG + CO2 <-> NADP + Icit abcdefghijklmnopqrstu + vwxyz + A = abcdefghijklmnopqrstu + wvyxAz R_SUCOAS SUCCCOASYN-RXN R00405 ADP + SucCoA + Pi <-> ATP + CoA + SUC abcdefghijklmnopqrstuvwxz = baefghijklmnqrstuvwxz + cdop
abcdefghijklmnopqrstuvwxz = baefghijklmnqrstuvwxz + dcpo R_ACONTa ACONITATEDEHYDR-RXN R01325 CIT <-> H20 + cis-Aco abcdef = bafdce
R_ACONTb ACONITATEHYDR-RXN R01900 H2O + cis-Aco <-> Icit abcdef = bceafd
R_AKGDH 2-OXOGLUTARATE-SYNTHASE-RXN R01197 CoA + alphaKG + NAD -> SucCoA + CO2 + NADH abcdefghijklmnopqrstu + vwxyz = bawvcdefghijklyxmnopqrstu + z R_CS CITSYN-RXN R00351 H20 + AcCoA + OAA -> H + CoA + CIT abcdef =bd + afce
R_MDH MALATE-DEH-RXN R00342 MAL + NAD <-> H + NADH + OAA abcd = abcd Glutamate Metabolism
R_GLUSy GLUTAMATESYN-RXN R00114 H + GLN + NADPH + alphaKG -> NADP + 2.0*GLU abcde + fghij = fghij + abcde
R_GLUDy GLUTDEHYD-RXN R00248 NADP + GLU + H2O <-> H + NADPH + NH4 abcdefghijklmnopqrstu + vwxyz = abcdefghijklmnopqrstu + vwxyz R_GLUN GLUTAMIN-RXN R00256 GLN + H2O -> GLU + NH4 abcde = abcde
R_GLNS GLUTAMINESYN-RXN R00253 ATP + GLU + NH4 -> ADP + H +GLN + Pi abcdefghij + klmno = abcdefghij + klmno Glycolysis/Gluconeogenesis
R_PDH PYRUVDEH-RXN R00209 NAD + CoA + PYR -> CO2 + NADH + AcCoA abcdefghijklmnopqrstu + vwx = vbacdefghijwklmnopqrstu + x R_TPI TRIOSEPISOMERIZATION-RXN R01015 DHAP <-> G3P abc = abc
R_PGI RXN-6182 R02740 G6P <-> F6P abcdef = acdefb R_PGK PHOSGLYPHOS-RXN R01512 ATP + 3PG <-> ADP + G1,3P abc = abc R_PGM 3PGAREARR-RXN R01518 2PG <-> 3PG abc = abc
RXN-15513 abc = abc
R_GAPD GAPOXNPHOSPHN-RXN R01061 NAD + G3P + Pi <-> H + NADH + G1,3P abc = bca R_FBA F16ALDOLASE-RXN R01068 F1,6P <-> G3P + DHAP abcdef = abc + def R_PFK 6PFRUCTPHOS-RXN R04779 ATP + F6P -> ADP + H + F1,6P abcdef = abcdef R_ENO 2PGADEHYDRAT-RXN R00658 2PG <-> H2O + PEP abc = abc R_PYK PEPDEPHOS-RXN R00200 ADP + H + PEP -> ATP + PYR abc = abc
R_PPS PEPSYNTH-RXN R00199 ATP + H2O + PYR -> AMP + 2.0*H + Pi + PEP abcdefghij + klm = abcdefghij + klm R_FBP F16BDEPHOS-RXN R00762 H2O + F1,6P -> Pi + F6P abcdef = abcdef
Inorganic Ion Transport and Metabolism R_PIt2r H_e + Pi_e <-> H + Pi
R_NH4t RXN-9615 NH4_e <-> NH4
Oxidative Phosphorylation
R_ADK1 ADENYL-KIN-RXN R00127 ATP + AMP <-> 2.0*ADP abcdefghij + klmnopqrst = klmnopqrst + abcdefghij R_SUCDi RXN-14971 q8 + SUC -> FUM + q8h2 abcd = badc
R_FRD7 RXN-14970 FUM + q8h2 -> q8 + SUC abcd = badc
R_NADH16 NADH-DEHYDROG-A-RXN R02163 4.0* H + NADH + q8 .0 -> 3.0*H_e + NAD + q8h2 abcdefghijklmn + opqrstuvwxyzABCDEFGHI = abcdefghijklmn + opqrstuvwxyzABCDEFGHI R_ATPM 3.6.3.52-RXN R00086 ATP + H2O -> ADP + H + Pi abcdefghij = abcdefghij
R_ATPS4r TRANS-RXN-249 ADP + 4.0*H_e + Pi <-> ATP + 3.0*H + H2O R_NADTRHD PYRNUTRANSHYDROGEN-RXN R00112 NADPH + NAD -> NADP + NADH
R_THD2 TRANS-RXN0-277 NADP + 2.0*H_e + NADH -> 2.0*H + NADPH + NAD R_CYTBD R09504 2.0*H + q8h2 + 0.5*O2 -> H2O + 2.0*H_e + q8
Pentose Phosphate Pathway
R_PGL 6PGLUCONOLACT-RXN R02035 H2O + G1,5L6P -> H + 6PG abcdef = abcdef R_G6PDH2r GLU6PDEHYDROG-RXN R02736 NADP +G6P <-> H + NADPH + G1,5L6P abcdef = abcdef
R_TKT2 2TRANSKETO-RXN R01067 E4P + X5P <-> G3P + F6P abc + defghi = adcb + efigh R_GND RXN-9952 R01528 NADP + 6PG -> NADPH + CO2 + Rub5P abcde + f = bdecaf R_RPI RIB5PISOM-RXN R01056 R5P <-> Rub5P abcde = acbde
R_TALA TRANSALDOL-RXN R01827 G3P + S7P <-> F6P - E4P abcd + efghij = heg + fbjdica R_RPE RIBULP3EPIM-RXN R01529 Rub5p <-> X5P abcde = acbde
Pyruvate Metabolism
R_ALCD2x ALCOHOL-DEHYDROG-RXN R00754 NAD + EtOH <-> H + NADH + AcAld ab = ab R_PTAr PHOSACETYLTRANS-RXN R00230 AcCoA + Pi <-> CoA + AcP ab = ab R_PFL PYRUVFORMLY-RXN R00212 CoA + PYR -> FOR + AcCoA abc = ab + c
R_LDH_D DLACTDEHYDROGNAD-RXN R00704 NAD + LAC <-> H + NADH + PYR abcdefghijklmnopqrstu + vwx = abcdefghijklmnopqrstu + vwx R_ACKr ACETATEKIN-RXN R00315 ATP + Ace <-> ADP + AcP abcdefghij + kl = abcdefghij + kl
R_ACALD ACETALD-DEHYDROG-RXN R00228 NAD + CoA + AcAld <-> H + NADH + AcCoA ab = ab Transport, Extracellular
R_FORt2 H_e + FOR_e -> H + FOR R_GLUt2r H_e + GLU_e <-> GLU + H R_PYRt2r H_e + PYR_e <-> H + PYR
R_GLNabc ABC-12-RXN ATP + H2O + GLN_e -> ADP + H +GLN + Pi abcdef = abcdef R_MALt2_2 TRANS-RXN0-451 2.0*H_e + MAL_e -> 2.0*H + MAL abcd = abcd R_ACALDt AcAld_e <-> AcAld
R_H2Ot H2O_e <-> H2O
R_ETOHt2r TRANS-RXN0-546 H_e + EtOH_e <-> H + EtOH ab = ab R_FUMt2_2 2.0*H_e + FUM_e -> 2.0*H + FUM
R_CO2t TRANS-RXN0-545 CO2_e <-> CO2 R_O2t TRANS-RXN0-474 O2_e <-> O2
R_FORti FOR -> FOR_e
R_FRUpts2 FRU_e + PEP -> PYR + F6P
R_ACt2r TRANS-RXN0-571 H_e + Ace_e <-> H + Ace ab = ab R_SUCCt2_2 TRANS-RXN-121 SUC_e + 2.0*H_e -> 2.0*H + SUC abcd = abcd
R_GLCpts GLC_e + PEP -> PYR + G6P R_SUCCt3 H_e + SUC -> SUC_e + H
R_D_LACt2 TRANS-RXN0-515 H_e + LAC _e <-> H + LAC abc = abc R_AKGt2r TRANS-RXN-23 H_e + alphaKG_e <-> H + alphaKG abcde =abcde
From the carbon atom transitions map of the CoreModel, two reactions posed some concerns: R_SUCOAS and R_PGM. R_SUCOAS has associated two different atoms mapping. By default, only the first atom mapping would be extracted, but since these were inspected manually, the two atom mapping were then extracted. The other reaction R_PGM may be associated to two reactions with different MetaCyc ID, 3PGAREARR-RXN and RXN-15513. This reaction: 2-phospho-D-glycerate ↔ 3-2-phospho-D-glycerate (2PG <-> 3PG) can be catalyzed by a phosphoglycerate mutase (2,3-diphosphoglycerate-dependent), which has the identifier RXN-15513, or by a phosphoglycerate mutase ( 2,3-diphosphoglycerate-independent), which the identifier is 3PGAREARR-RXN. This model belongs to E. coli and according to information in MetaCyc, some bacteria, in particular Gram-negative, require as cofactor 2,3-diphospho-D-glycerate. So, is most probable that this reaction is catalyzed by the phosphoglycerate mutase (2,3-diphosphoglycerate-dependent) than the phosphoglycerate mutase ( 2,3-diphosphoglycerate-independent). Since the two enzymes can catalyze this reaction, the two reactions from MetaCyc were associated to the reaction with the CoreModel ID: R_PGM.
The algorithm processed the 63 reactions with an associated MetaCyc ID, as illustrated in Figure 5.5. This figure shows the distribution of reactions by pathway that have an associated carbon atom transition and those without an associated carbon atom transitions. To most reactions from central pathways it was possible to associate a MetaCyc ID and a carbon atom transition, only a few reactions in the others pathways (most related to the transport extracellular) were not associated to a MetaCyc ID and thus, a carbon atoms mapping.
Figure 5.5 – Distribution of each reaction with a MetaCyc ID by pathway that have or not a carbon atom transitions associated. Each bar has a color according to the pathway and the number in top of each bar correspond to the number of reactions that have a carbon atom transitions (bar is full filled) or that don’t have a carbon atom transitions (bar isn’t full filled).
5.2. C
ARBON ATOMS’
MAPPING MODEL OFA.
SUCCINOGENESBased on the published central metabolic model for A. succinogenes (McKinlay et al. 2007; Mckinlay et al. 2010; Förster et al. 2003; Guettler et al. 1999), a new metabolic model with mapped carbon atom transitions was constructed. Reactions considered to represent the central metabolic model were associated
6 8 4 13 5 8 6 7 1 3 2 A na pl er ot i re ac ti on s Ci tr ic A ci d Cy cl e G lu ta m at e M et ab ol is m G ly co ly si s/ G lu co ne og en es is In or ga ni c Io n T ra ns po rt an d M et ab ol is m O xi da ti ve Ph os ph or yl at io n Pe nt os e Ph os ph at e Py ru va te M et ab ol is m T ra ns po rt , Ex tr ac el lu la r
Reactions with carbon atoms transition associated
Yes No
to the following metabolic pathways: glycolysis pathway, pentose phosphate pathway, citrate cycle and pyruvate metabolism.
55 reactions were manually curated to attribute a KEGG ID and 43 reactions were then automatically associated to the respective MetaCyc ID. The carbon atom mapping, reactions directionality and IDs from others databases were then extracted and associated to reactions. For the 9 reactions with no cross-reference and the others 3 reactions that hadn’t an identifier, it was performed a manual exploration in MetaCyc database for each one and, it was possible associate a MetaCyc ID for 3 reactions (Table 5.3).
Table 5.3 – Reactions in the model and their association with an identifier.
Database identifier Number of reactions Percentage
MetaCyc ID 3 5.45 %
KEGG ID 9 16.35 %
MetaCyc and correspondent KEGG ID 43 78.20 %
Total 55 100 %
The list of reactions with a corresponding MetaCyc ID was processed by the algorithm and the carbon atom mapping, the directionality and the ID from others databases, were added to the model (see Table B.1 and Table B.2). As shown in Table 5.4, most reactions have an atom mapping associated, except the reaction with MetaCyc ID SUCCCOASYN-RXN that has two atom mappings (this reaction is the same reaction that have two atom mapping associated in the core model of E. coli, but for this case only the first atom mapping is recorded) and 7 reactions have none.
Table 5.4 – Reactions with a MetaCyc ID associated and their associated atoms mapping.
Atom mapping Number of reactions
None 7
One 38
Two or more 1
Total 46
The pathways glycolysis, pentose phosphate pathway, citrate cycle and pyruvate metabolism provided by KEGG were highlighted where the reactions mapped of the central metabolic model occur (see Appendix C).
To support the constructed modelthe central metabolic model provided by McKinlay and co-workers was used as basis (Mckinlay et al. 2010). The reactions and their metabolic information were considered reliable for the design of a carbon atom transition network for A. succinogenes. In the model, to each reaction a KEGG ID, a MetaCyc ID and a carbon atom transition is displayed. The ATP, ADP, NAD and NADH are irrelevant for the carbon atom mapping but were represented to indicate when a reaction spends or not spends energy. The Figure 5.7 shows in detail the final designed model for the carbon atom transition network for A. succinogenes.
The developed model can be used to trace the transition of carbon atoms of desired compounds. As exemplified in Figure 5.7, if the isocitrate is the compound of interest, a possible pattern of reactions to manipulate the production of this product is highlighted with carbon atoms colored with red. However the pattern chosen has a gap, between the compounds fructose-1,6-bisphosphate and glyceraldehyde-3-phosphate. There are two possible patterns, one reaction (fructose-1,6-bisphosphate glyceraldehyde-3-phosphate) or two
reactions involving another compound (fructose-1,6-bisphosphate glycerone
phosphate glyceraldehyde-3-phosphate). None of them have a carbon atom
transition that can connect the pattern so, it was assumed that the carbon atoms don’t change their previously order. This means that the position of the carbon atom (b) in the reaction glucose-6-phosphate fructose-1,6-bisphosphate is the
same when the pattern restarted in the reaction glycerone phosphate
Figure 5.7 – A. succinogenes carbon atom transition network based on KEGG Pathways and
A. succinogenes central metabolic network on McKinlay et al.. Reactions name represents the
two databases: K_ID, reaction identifier on KEGG; M_ID, reaction identifier on MetaCyc; C_Map, carbon atom transition for each reaction. Metabolites: 2PG, 2-phosphoglycerate; 3PG, 3-phosphoglycerate; 6PG, CPD-2961; AcCoA, acetyl-CoA; Ace, acetate; AcP, acetyl phosphate; Acp, acceptor; Ald, acetaldehyde; Aco, cis-Aconitate; Cit, citrate; CO2, carbon dioxide; DHAP, glycerone phosphate; E4P, erythrose-4-phosphate; EtOH, ethanol; F1,6P, fructose-1,6-bisphosphate; F6P, fructose-6-phosphate; For, formate; Fum, fumarate; G1,3P, glycerate-1,3-diphosphate; G1,5L6P, glucono-1,5-lactone-6-phosphate; G3P, glyceraldehyde-3-phosphate; G6P, glucose-6-phosphate; GLC, glucose; Iso, isocitrate; Mal, malate; OAA, oxaloacetate; PEP, phosphoenolpyruvate; Pi, orthophosphate; Pyr, pyruvate; R5P, ribose-5-phosphate; Rbu5P, ribulose-5-phosphate; S7P, sedoheptulose-7-ribulose-5-phosphate; Suc, succinate; SucCoA, succinyl-CoA; X5P, xylulose-5-phosphate; αKG, 2-oxoglutarate. The atoms that are colored with dark red are an example of a tracing with carbon atom.
6.
C
ONCLUSIONSThe atom mapping of biochemical reactions may have many applications, in particular, the identification of new biochemical pathways. The algorithm developed during this work allows to trace most atom transitions in a metabolic network and to construct atom transition maps that might be successfully implemented in 13C metabolic flux analysis. The algorithm was applied to trace
atom transition patterns in the central metabolism of E. coli and in the central metabolism of A. succinogenes.
The exploration of KEGG and MetaCyc was very instructive for specific data regarding the transition of atoms from substrates to products in biochemical reactions. With the metabolic information available in those databases, it was possible to build a reliable model. However, some reactions were found not having a carbon atom mapping associated, which limits the applicability of those carbon atom transitions.
This algorithm does not provide a complete curation-free approach because if the reaction does not have an identifier (ID) provided by KEGG or MetaCyc, it is necessary a manual inspection to associate an identifier. In a large-scale application this can be a problem because the manual research will consume much time compared to an automatically research.
All the manual labor in this work was very important to increase the efficiency and the robustness of the method developed. Once again, the manual curation was fundamental to attribute an identifier from MetaCyc or KEGG when they weren't provided in the input file. Some cross-referenced errors can occur when the association is made and the manual curation was useful to correct these errors.
The metabolic information, in particular the reactions, obtained in the databases are generic and as the method can be implemented regardless of the organism or the pathway, the transition of the carbon atoms resulting from the algorithm can be applied to any organism or metabolic network.
For a future work, the methodology implemented that has resulted in an accurate carbon atom transition model, can be expanded if some improvements are made, such as automatic integration to reduce manual curation.
The carbon atom model resulted from the algorithm developed can be incremented in a metabolic engineering tool to track desired compounds through the metabolic pathways. The resulting carbon atom maps can be used to perform tasks of 13C metabolic flux analysis in order to better investigate key
aspects of the studied organisms, namely in the case of A. succinogenes, which has not been extensively explored as E. coli. For example, the atoms transition map resulted for A. succinogenes can be used to inspect the partitioning of carbon flux between C3 and C4 pathways.