Pablo Miguel León Vigarinho
Licenciado em Engenharia de Materiais
Caracterização Microestrutural de Compósitos com
Gradiente Produzidos por Fricção Linear (Friction
Surfacing)
Dissertação para obtenção do Grau de Mestre em Engenharia de Materiais
Orientador: Prof. Doutor Alexandre José da Costa Velhinho, Professor
Auxiliar, Faculdade de Ciências e Tecnologia
–
Universidade Nova de
Lisboa
Júri:
Presidente: Prof. Doutor(a) João Pedro Botelho Veiga Arguente(s): Prof. Doutor(a) Rosa Maria Mendes Miranda Vogal(ais): Prof. Doutor(a) Rui Jorge Cordeiro Silva
i
“In theory, practice and theory are the same. In practice they aren‟t.”
iii
Caracterização Microestrutural de Compósitos com Gradiente Funcional Produzidos
por Fricção Linear (Friction Stir Surfacing)
© Copyright Pablo Miguel León Vigarinho, 2013
v
Acknowledgements
First of all I must thank to my parents for their love and support, who through all of these years supported me and my decisions, and without whom I wouldn't be where I am today.
My thanks to Sofia Penim whom by far is the person that in the last years has been my mainstay, supporting me and always helping me make the right choices. I cannot express how much I owe you for the last seven years. To Pedro Prates, long date friend and mate. Thanks for putting up with my bad temper. To Bernardo Toninho, my stream of consciousness, forever sarcastic but always concise and assertive on the advices you gave me. To Manuel Pimenta, thanks „bro for always making me laugh
when the going got tough. Hélio Dolores, Frederico Malheiro, Helena Mafalda, Tânia Silva, Pedro Jorge, Igor Santos, Sónia Seixas, Sara Oliveira and all the persons I cannot enumerate here. You have all my gratitude for being there for me sharing the good, and particularly, the bad times.
My special thanks to my supervisor Professor Alexandre Velhinho, for „choosing‟ and believing in
me and my capabilities to carry out this work, giving me all his support and wise counseling, never without a hint of sarcasm, whenever I needed. To Professors Rui Silva and Guilherme Lavareda, you have my full admiration for your excellent professionalism, always concerned in teaching and caring if your students understood the lesson, coming down to our level and reaching out for us, when we didn't understood. To all, thank you for your friendship throughout this all this years.
I would like to thank the funding of FCT/MCTES. This work has benefited from a junior research grant under Project PTDC/EME-TME/103543/2008, "FRISURF – Technology developments of Friction stir processing to produce functionally graded materials and improve surfaces for advanced engineering applications.
vii
Abstract
The prime objectives of this report are the microstructural and mechanic characterization of Functionally Graded Materials (FGM) MMCs with nano/microstructured ceramic particles, obtained from Friction Stir Processing (FSP).
The characterization techniques used in this work have been Optic Microscopy (OM), Scanning Electron Microscopy (SEM), Energy Dispersive X-Ray Spectroscopy (EDS), X-Ray Fluorescence (XRF) and hardness tests.
ix
Resumo
Este trabalho incide fundamentalmente na caracterização microestrutural e mecânica de compósitos de matriz metálica, com gradiente de funcionalidade (MGF) na forma nano/microestruturada, obtidos a partir de um processamento por fricção linear (PFL).
As técnicas utilizadas para a caracterização dos FGM produzidos são a Microscopia Óptica (MO), Microscopia Electrónica de Varrimento (MEV), Fluorescência de Raios-X (FRX) e ensaios mecânicos (microdurezas).
xi
Keywords
xiii
Palavras-Chave
xv
Table of Contents
ACKNOWLEDGEMENTS --- V
ABSTRACT --- VII
RESUMO --- IX
KEYWORDS --- XI
PALAVRAS-CHAVE --- XIII
TABLE OF CONTENTS --- XV
FIGURES --- XVII
TABLES --- XXI
ACRONYMS --- XXIII
1 INTRODUCTION 1
-2 STATE OF THE ART 3
-2.1 ON FRICTION SURFACING AND ITS ORIGIN --- -3
-2.2 ALUMINUM --- -6
-2.2.1 Aluminum Alloys for mechanical work 7
-2.2.1.1 AA2024T3 8
-2.2.1.2 AA6082T6 8
-2.3 SIC --- -8
-2.4 THERMAL TREATMENTS OF ALUMINUM ALLOYS --- -9
-2.5 MMC --- -10
-2.6 FGM --- -11
-2.7 FS --- -12
-3 EXPERIMENTAL PROCEDURE 15
-3.1 MATERIALS --- -15
Substrate and Rod 15
-3.1.1 Deposition Parameters 15
-3.2 SAMPLE PREPARATION --- -16
-3.2.1 Grinding and Polishing 16
-3.2.2 Etching 17
-3.2.3 Image Analysis 17
-3.2.4 Microhardness 18
-3.2.5 SEMEDS 18
-3.2.6 XRF 18
-4 RESULTS AND DISCUSSION 19
-4.1 STARTING MATERIALS --- -19
-4.1.1 Alloy chemical composition 19
-4.1.2 Microstructure of the Consumable Rod 19
-4.2 SINGLE LAYER DEPOSITION --- -20
-4.2.1 Unreinforced Single Layer FS Material 20
-4.2.2 Reinforced Single layer FS materials 22
-4.2.2.1 Effect of reinforcing particle size 22
-4.2.2.2 Effect of the reinforcing particle concentration 31
-4.3 MULTILAYERED DEPOSITION --- -35
-4.3.1 Nonreinforced Multilayered FS material 35
-4.3.2 Reinforced Multilayered FS Material 38
-5 CONCLUSIONS 47
-6 FUTURE WORK 49
-7 BIBLIOGRAPHY 51
xvii
Figures
Figure 1.1
–
FSP: a) process schematic; b) cross section identifying different zones formed
along the processed area, due to tool translation [1]. ... 4
-Figure 1.2
–
Hardness profile along a weld joint artificially aged [3]. ... 5
-Figure 1.3
–
Mechanical properties of BM and weld joints with and without heat treatment
[4]. ... 5
-Figure 2.4
–
Multi-layering reinforcement sequence. SiC reinforcement hole pattern at the
tip of the rod [28]. ... 12
-Figure 2.5
–
Hole pattern configuration for layer reinforcement in single layer depositions
[28]. ... 13
-Figure 3.6
–
Multi-layer coating production by FS.(a) Experimental set-up, (b) Deposition
by FS, (c) Initial plasticizing period of the second deposition, (d) Third deposition, (e)
Resulting 3layer coating [28]. ... 16
-Figure 4.7
–
Rod picture with a single hole for SiC particles, Sample is etched with
Weck‟s.
... 20
-Figure 4.8
–
Crosssection micrograph on one of the rods used for FS. ... 20
-Figure 4.9
–
P0 cross section macrograph. Left side is the advancing side of the tool. Scale
bar: 5 mm. ... 21
-Figure 4.10
–
P0 layer micrographs. a) Center-Middle and b) Retreating-Base. Scale bar:
20 µm. ... 21
-Figure 4.11
–
P0 horizontal hardness profile for top, middle and base of deposited layer.
Graph origin represents the advancing side. ... 21
-Figure 4.12
–
P0 vertical hardness profile of retreating, middle and advance zones. ... 22
-Figure 4.13
–
Reinforced single
layer sample. Weck‟s etch. Darker areas inside the layer
exhibit SiC particle concentration. Left side represents the advancing side. ... 23
-Figure 4.14
–
P1 deposited layer micrographs. a) Retreating-Top and b) Advance-Middle.
Scale bar: 20 µm. ... 23
-Figure 4.15
–
Detail on the retreating side. High particle concentration is depicted in the
right side, corresponding to a magnifica
tion of the black area. Weck‟s etch. Scale bars: 200
and 100 µm. ... 23
-Figure 4.16
–
Microscopic detail of SiC particle accumulation on the advancing side of the
tool. The upper picture is a m
agnification of the marked area. Weck‟s etching.
... 24
-Figure 4.17
–
Keller‟s etching of the advancing side (base) and the middle (top) of the
deposition. ... 24
-Figure 4.18
–
P1 vertical hardness profile for advancing, middle and retreating side of
deposited layer. ... 24
-Figure 4.19
–
SEM micrograph of reinforced sample (P1) surface analysis. Scale bar: 50
µm. ... 25
-Figure 4.20
–
EDS analysis for the spots depicted in the previous figure. From left to right,
1), 2), 3), 4) and 5). ... 25
-Figure 4.21
–
SEM Secondary Electrons micrographs of a single layer sample (P1). Scale
bars: 5, 2 and 50 µm respectively. ... 26
-Figure 4.22
–
Reinfo
rced single layer sample. Weck‟s etch. Darker areas inside the layer
exhibit SiC particle concentration and higher grain refinement. ... 27
-Figure 4.23
–
Detail on the retreating side of deposition. Scale bars: 50 µm and 5 µm
respectively. ... 27
-Figure 4.24
–
P1 layer micrographs. a) Center-Middle and b) Retreating-Middle. Scale
bar: 20 µm... 27
-xviii
Figure 4.26
–
Reinforced single layer sample. Weck‟s
etch. Darker areas inside the layer
exhibit SiC particle congeries. ... 28
-Figure 4.27
–
P3 vertical hardness profile for advancing, middle and retreating side of
deposited layer. ... 29
-Figure 4.28
–
Cross section macrographs of P2 and P3 (a) and b) respectively). Scale bars
(b), c), e) and f)): 50 µm [28] ... 29
-Figure 4.29
–
a), b) and c) denote the high SiC particles in the interface zone, while c)
shows a micrograph of the Middle-Top, d) in the Middle and e) in the
AdvanceBase. Scale bars: 50, 50 100, 20 and 20 µm respectively. ... 30
-Figure 4.30
–
Cross section macrograph images of SiC reinforced coating and consumable
rod configuration. (a) 12.3 µm SiC reinforced composite coating, (b) Poorly bonded edge, (c)
Fully bonded interface, (d) SiC particles arranged according to material flow patterns [28]. .... -
31
-Figure 4.31
–
P4 cross section macrograph. Scale bar: 5 mm... 31
-Figure 4.32
–
P4 layer micrographs. a) Center-Middle and b) Retreating-Base. Scale bar:
20 µm. ... 32
-Figure 4.33
–
P4 vertical hardness profile for advancing, middle and retreating side of
deposited layer. ... 32
-Figure 4.34
–
Reinforced single layer sample. Weck‟s etch.
... 33
-Figure 4.35
–
P5 layer micrographs. a) Center-Top and b) Advance-Top. Scale bars: 20
µm. ... 33
-Figure 4.36
–
P5 vertical hardness profile for advancing, middle and retreating side of
deposited layer. ... 34
-Figure 4.37
–
Effects of particle concentration. Cross-section micrographs of P4 and P5
(a) and b) respectively) [28]. ... 34
-Figure 4.38
–
Non-reinforced tri
ple layer sample. Weck‟s etch. Material flux is depicted.
. -
35
-Figure 4.39
–
Cross section micrographs of P6 deposition. a) Advancing-Top (L3) and b)
CenterMiddle (L2). Scale bars: 20 µm. ... 36
-Figure 4.40
–
P6 horizontal hardness profile for top, middle and base of deposited layer. .. -
36
-Figure 4.41
–
P6 vertical hardness profile for advancing, middle and retreating side of
deposited layer. ... 37
-Figure 4.42
–
Hardness profile for the non-reinforced multilayer deposition sample. HAZ
influence over the BM and the different layers [28]. ... 38
-Figure 4.43
–
Reinforced triple layer sample. Weck‟s etch. Material flux is in the centre
interface is depicted. ... 39
-Figure 4.44
–
P7 interface micrograph where substrate and the deposited layer mingle
together creating a swirl, thus a sound bonding. Scale bars: 500 µm ... 39
-Figure 4.45
–
FGM multi-layer coating presenting an increasing SiC particle size gradient
along thickness direction [28]. ... 40
-Figure 4.46
–
SEM Secondary Electrons
–
b), c) and d)
–
micrographs and Back Scattered
electrons
–
a)
–
of the multi-layer sample (P7) showing particles agglomeration dispersed
along the. Scale bars: 5 µm, for the Secondary Electron micrographs and 200 µm respectively
for Back Scattered electrons. ... 41
-Figure 4.47
–
Hardness profile and SiC area fraction analysis along coating thickness.(a)
Reinforcement distribution, (b) SiC area fraction determined by image processing, (c) Vickers
hardness profile [28]. ... 42
-Figure 4.48
–
P7 vertical hardness profile for advancing, middle and retreating side of
deposited layer. ... 42
-xix
Figure 4.50 EDS analysis for the spots depicted in the previous figure. ... 43
-Figure 4.51
–
Reinforced triple layer sample. Weck‟s etch. Scale bar 5 mm.
... 44
-Figure 4.52
–
Keller etch denotes high particle concentration over the advancing side.
Scale bar: 5 mm. ... 44
-Figure 4.53
–
Detail on the SiC particles accumulation in P8. Scale bars: 20 and 100 µm. . -
44
-Figure 4.54
–
FGM multi-layer coating presenting an increasing SiC particle size gradient
along thickness direction. Scale bars: a) 50, b) and c) 100 µm [28]. ... 45
xxi
Tables
Table 1.1
–
Mechanical properties of BM, TIG bead, FS weld joint and TIG joint. [3] . 6
-Table 2.2
–
Maximum solubility values in solid solution and main alloying functions [20,
21]. ... 7
-Table 2.3
–
Aluminum alloy classification, based on its primary alloying element(s) [17]. . -
7
-Table 2.4
–
Mechanical properties of SiC [24]. ... 8
-Table 2.5
–
Heat treatment designations for aluminum and aluminum alloys [25]. ... 10
-Table 2.6
–
Generic effects over distinct mechanical properties of MMC‟s, caused by the
increase of various microstructural parameters. The reference to properties evaluated
according to an axial direction allows safeguarding the ability of the reinforcements not being
equiaxed and/or presenting a preferred orientation [26]. ... 11
xxiii
Acronyms
a.g.s – average grain size
AS – Advancing Side
BM – Base Material
ECAP – Equal Channel Angular Pressing
EDS – Energy Dispersive X-Ray Spectroscopy
FGM – Functionally Graded Material
FSP – Friction Stir Processing
FS – Friction Surfacing
FSW – Friction Stir Welding
OM – Optical Microscopy
RS – Retreating Side
SEM – Scanning Electron Microscopy
SPD – Severe Plastic Deformation
- 1 -
1
Introduction
The motivation that led this work was the challenge of understanding the effects of Friction Surfacing on the processed materials microstructures, and how it those effects will influence the mechanical properties of the materials.
This study aims to explore FS technology in the following areas:
1) Understanding the influence of FS on the microstructure of the coatings;
2) Developing strategies for surface modification in order to increase other properties such as fatigue and wear;
3) Explore the manufacturing of FGMs as tech alternative to powder technology.
- 3 -
2
State Of the Art
Up to the present, research has been made, in order to understand how the microstructure refining by FSP can influence the mechanical properties of the materials processed.
Miranda et. al. [5] successfully produced FGM composites through microstructural refining and
mechanical property modification. They concluded that not only it was possible to produce layers of hard materials by FSP in aluminum-based alloys with orthogonal gradients of composition and mechanical behavior, but also that smaller particles lead to higher particle concentration along the bead surface, as well as to smoother concentration gradients both in depth and along the direction parallel to the surface. These authors also found that the thickness of the reinforced layer was below 80 µm, decreasing with increasing particle size.
Ma et. al. [6, 7] studied the effects of FSP in order to achieve a state of superplasticity (as also
studied in [8]) together with low temperature processing. The study achieved ultrafine grains that were very stable at elevated temperatures up to 425 ºC, due to the strong pinning effect of the high density of fine Al3Zr particles. Also, the FSP Al–4Mg–1Z resumed the superplastic condition under the investigated temperature range of 175–425 ºC. These authors also concluded that the optimum strain rate increased with increasing temperature [6]. Furthermore in [7] the conclusions were that fine-grained 2219Al alloys with a grain size of 1.0 and 2.1 µm were produced via FSP at 400 rpm and 100mm/min in water and air, respectively, even if the fine metastable precipitates in the 2219Al-T6 were significantly coarsened. Finally, the relatively low superplasticity observed in the FSP fine -grained 2219Al was attributed to unstable grain structure because the pining Al2Cu particles were easily coarsened at high temperatures.
Other studies were performed, such as the effects of nano-sized particulate inclusions during FSP [9], concluding that with proper control of the working temperature, an ultrafine and uniform grained structure can be achieved, plus the grain boundaries was well defined and the mean grain size could be refined to 100–300 nm from the initial 75 µm by a single FSP pass. Furthermore, the ultrafine-grained structure drastically increased the microhardness from an initial 50 up to 120 HV.
The effect of processing parameter variations was also studied [10], of which resulted in understanding how tool traverse and rotational speeds influenced the microstructure and mechanical properties, or how FSP increased the yield strength of the starting material by about 13% (maximum), while the enhancement in the tensile strength varied between 20% and 50%.
Other works have observed the effect of multi-pass [11], in which porous aluminum with a porosity of approximately 70% was successfully fabricated using A6061 by the FSP route precursor method with 4-pass FSP. Also low processing temperatures [9, 8] and the mechanical properties of processed materials, such as increased toughness and fatigue resistance [12, 13, 14] have been researched, and more recently a new approach was made, using aluminum composite foams [15, 16].
2.1
On Friction Surfacing and its origin
Friction Stir Processing (FSP) is a recent solid state technology that applies the fundamental principles of Friction Stir Welding (FSW). Its prime objective is the improvement and modification of materials intrinsic properties.
FSP uses a rotating tool consisting of a pin and a shoulder. However, a consumable type of tool can be used, in order for the tool‟s material to be deposited throughout the substrate (the material being processed), in which case the process is called Friction Surfacing (FS).
- 4 -
three zones: 1) Thermally Affected Zone, or the Heat Affected Zone (TAZ, or HAZ), 2) Thermo-Mechanically Affected Zone (TMAZ) and 3) dynamic recrystallization zone.
Figure 1.1 – FSP: a) process schematic; b) cross section identifying different zones formed along the processed area, due to tool translation [1].
In the non-consumable procedure (FSP), the tool is identical to the one used for FSW. However, there are no materials to be joined; instead the concept of a „bead on plate‟ may be introduced. As for
the FSW technique the shoulder‟s aim is to assist the mixture of the processed material, by increasing the materials temperature due to surface friction, while the pin actually mixture the softened material, previously taken into a viscoplastic state. This temperature should always be below the melting point, to avoid phase transformations and to prevent inducing or destroying heat treatment due to annealing. The pin geometry will induce different microstructures in the processed area and its surroundings, and will also dictate its wear. The rotating speed and advancing speed, as well as the angle of attack of the tool are the main operatory parameters to optimize.
As for the FS, the tool is usually of a higher hardness than the substrate, so it can be deposited over its surface, due to friction of the tool (rod) above the area to be processed. The microstructure of the deposited material will be dictated by the parameters mentioned before.
Initially, FSP was used as a surface restoration technique, in order to reduce small defects left behind in casting objects, so as to improve the surface‟s characteristics and the part‟s life span. Quickly other applications emerged, such as surface properties‟ modification, in order to improve surface hardness, wear and tear resistance, corrosion resistance and more recently, structural refinement as a way to achieve superplasticity.
Functionally Graded Materials (FGM), obtained by FSP or FS, are nowadays being researched and studied due to the advantages over other techniques, such as Equal Channel Angular Pressing (ECAP) or Centrifugal Casting. There are, however, some problems to be solved, namely, for those cases where ceramic reinforcing particles are used within a metallic matrix, the adhesion between the composite constituents or even the adequate dispersion of the particles1.
Although promising, FSP needs to be further researched and developed, in order to improve knowledge on the influence of deposition parameters on the microstructure.
In the HAZ, grain structure is not affected [2]. On the other hand in TMAZ the grain undergoes drastic changes due to twisting imposed by passage of the. In the dynamic recrystallization zone or nugget the original grain disappears, giving rise to a new and refined grain, created by the severe agitation imposed by the rotation of the pin.
1 It should not be inferred, however, that FGMs are necessarily composite materials. It is perfectly
conceivable to have a non-reinforced material which exhibits controlled gradients of microstructure or chemical composition, which should also be considered FGMs. Furthermore, such materials may easily be produced by FSP, along with composite FGMs.
Dynamic Recrystallization Zone pin
rotatin
g tool to be processed zone
shoulder substrate
Heat Affected Zone Thermomecanically
- 5 -
As in the HAZ present in the fusion welds of precipitation hardened aluminum alloys, heating during processing can result in decreased toughness. Re-solubilization of the precipitates, with reflexes on the aging state of the alloy, may occur during processing, starting from the vicinity of the base material to the center of the bead. Figure 1.2 shows the distribution of hardness of an Al-Mg-Sc alloy 2 mm thick plate from annealed at 350 °C for one hour and subsequently cold-rolled, which underwent two welding processes (GTAW and FSW) Table 1.1 shows the values of the mechanical properties obtained in the study of this alloy. Figure 1.3 now shows the values of the mechanical properties in different parts of an alloy Al-Mg-Sc, and friction stir welded by TIG, with and without heat treatment.
Figure 1.2 – Hardness profile along a weld joint artificially aged [3].
Figure 1.3 – Mechanical properties of BM and weld joints with and without heat treatment [4]. Distance to the center of bead [mm]
- 6 -
Table 1.1 – Mechanical properties of BM, TIG bead, FS weld joint and TIG joint. [3]
Sample Mechanical properties Weld joint
coefficient Failure location
σb [MPa] σ02 [MPa]
Base Material 430 320 -
-Bead 495 398 -
-FSW joint
394 286 0.92 Nugget
advancing side TIG joint (w/o
reinforcement) 332 217 0.77 Melted metal
2.2
Aluminum
Aluminum is the most abundant (8.3% by weight) metallic element on Earth‟s crust and the third
most abundant of all elements (after oxygen and silicon) [17, 16].
More than two decades passed from the element‟s discovery in 1825 until an effective separation process from the mined ore – bauxite was created. It was not until the last decade of the 19th century that a viable, commercial production process was established [17].
Aluminum has only been commercially produced for about 150 years, being a very „recent‟ metal when compared to tin, copper and iron, which have been used for thousands of years; nevertheless, nowadays it‟s by far the most heavily produced of all the non-ferrous metals;.
Pure aluminum, i.e. without alloying elements, is a soft, ductile and light material, even more than titanium with good corrosion resistance and presents approximately a third of steel density. Since aluminum has an FCC crystal structure, its ductility is retained even at very low temperatures. It is non-toxic and that‟s why it can be used in food packages or medical tools and/or prosthesis; it is, however, pyrophoric, due to a highly exothermic oxidation reaction [18]. It is a great heat and electrical conductor, and when polished aluminum has the highest reflectivity in all materials, even higher than mirrored glass. The chief limitation of aluminum is its low melting temperature – 660 ºC –
which restricts the maximum temperature at which it can be used. Nevertheless its mechanical resistance is very low, and therefore is not suited for structural applications.
- 7 -
Mechanical strength of aluminum can be enhanced by cold work or alloying; however, both processes tend to reduce corrosion resistance. Most alloys are obtained from solid solutions of one or more dissolved elements in the base aluminum. These solid solutions are additionally hardened by two routes: [17, 20]
Work hardening, without thermal treatment
Heat treatment hardening, and may or may not include mechanical work in the cycle.
The Aluminum Association established a designation system, adopted by scientific and industrial communities in general, for the mechanical or thermal treatment [21].
Even though many elements bind with aluminum, only a few, alone or in combination with each other, give rise to the properties desired by the industry. Thus, the main alloying elements are copper (Cu), manganese (Mn), silicon (Si), magnesium (Mg), and zinc (Zn). The creation of aluminum alloys depends on the ability to achieve a solid solution in the aluminum primary phase. Maximum solid solubility in aluminum for some alloying elements can be found in Table 2.2.
Table 2.2 – Maximum solubility values in solid solution and main alloying functions [20, 21].
Alloy element
Maximum
solubility [wt. %]
Temperature [ºC]
Main effects
Cu 5.6 546 Strength increase
Mg 14.9 450
Strength increase ; corrosion resistance improvement
Mn 1.8 658
Slight strength resistance increase maintaining a good ductility
Si 1.6 577 Liquidusdecrease temperature
Zn 82.8 383
Strength increase, when combined to Cu and Mg
2.2.1
Aluminum Alloys for mechanical work
Some aluminum alloys are suited for components whose final shape is obtained from metal forming processes such as rolling, extrusion and forging. These alloys are classified with a four digit number (xxxx), where the first digit indicates the alloying or key element, according to Table 2.3 [17, 20, 21].
Table 2.3 – Aluminum alloy classification, based on its primary alloying element(s) [17].
Alloy element
Main functions
1xxx Aluminum, 99,00% min
2xxx Copper 3xxx Manganese 4xxx Silicon 5xxx Magnesium 6xxx Magnesium-Silicon 7xxx Zinc 8xxx Lithium
- 8 -
The meaning of the remaining three digits is as follows: the second, when different from 0, identifies a modification initially made to the alloy; the third and fourth identify a specific aluminum alloy. As an example, AA5054 is an Aluminum-Magnesium Alloy, without any modification. There‟s
an exception to this rule, regarding 1xxx alloys, where the third and fourth digits indicate the purity level of alloy, denoting the decimal significants above 90.00%, i.e. AA1060 possesses at least 90.60% of aluminum [17, 20, 21].
2.2.1.1
AA2024-T3
A Zr + Ti limit of 0.20% maximum may be used with this alloy designation for extruded and forged products only, but only when the supplier or producer and the purchaser have mutually so agreed. Agreement may be indicated, for example, by reference to a standard, by letter, by order note, or other means which allow the Zr + Ti limit. Aluminum content reported is calculated as remainder. Composition information provided by the Aluminum Association and is not for design [22].
2.2.1.2
AA6082-T6
Aluminum alloy 6082 is a medium strength alloy with excellent corrosion resistance. It has the highest strength of the 6000 series alloys. Alloy 6082 is known as a structural alloy. In plate form, 6082 is the alloy most commonly used for machining. As a relatively new alloy, the higher strength of 6082 has seen it replace 6061 in many applications. The addition of a large amount of manganese controls the grain structure which in turn results in a stronger alloy. It is difficult to produce thin walled, complicated extrusion shapes in alloy 6082. The extruded surface finish is not as smooth as other similar strength alloys in the 6000 series. In the T6 and T651 temper, AA6082 machines well and produces tight coils of swarf when chip breakers are used [23].
2.3
SiC
Silicon carbide possesses good mechanical properties, therefore the use of this ceramic reinforcement is interesting from the point of view of MMCs. Some mechanical properties can be observed in Table 2.4
Table 2.4 – Mechanical properties of SiC [24].
Vickers hardness [GPa]
Vickers indentation toughness KIC
[MPa.m1/2]
Elasticity limit deformation %
𝛆0
Ultimate compression strength 𝛔UCS
[MPa]
Total strain catastrophic failure % 𝛆F
Ar-LPS SiC
17.6±0.3 3.3±0.1 ~1.8 630 ~11.4
N2-LPS SiC
- 9 -
2.4
Thermal treatments of aluminum alloys
As mentioned before, aluminum alloys acquire better properties, especially mechanical strength, through thermal treatment and/or plastic deformation.
The precipitation hardening treatment typically consists of a sequence of steps [17]. First, the alloy is submitted to a solubilization heat treatment at high temperature, in order to promote the solid solution of the alloying elements in the aluminum lattice. Treatment temperatures are typically of the order of 530 ºC, between the liquidus and solidus temperatures of the specific aluminum alloy. The
second step consists in quenching, in order to create an over-saturated solution at room temperature. This procedure is followed by ageing at an intermediate (lower than solidus) temperature, in order to
allow a diffusion-controlled precipitation, resulting in the desired final properties. This results in the formation of a finely dispersed network of precipitates, within the solute, which hinder the movement of dislocations during deformation, forcing these to cut or surround particles in order to travel as a response to locally sensed stresses. While the precipitation sequence is liable to occur at room temperature – a process called natural ageing – its accurate control usually demands elevated temperatures (15-25% of the difference between the ambient temperature and the solution annealing temperature above ambient temperature) as a means to shorten the precipitation time span. This premeditated operation is called artificial ageing. Over-ageing, on the other hand, refers to the precipitation of a quantity above the ideal, or overgrowth of the precipitate structures; typically, it results in a reduction of the alloy‟s mechanical strength and corrosion resistance; however there are circumstances which may result in improved corrosion resistance, among other properties.
It is now time to establish the basic designations for hardening treatment [17]:
F, as fabricated – No special control has been performed to the heat treatment or strain hardening after the shaping process such as casting, hot working, or cold working.
O, annealed – This is the lowest strength, highest ductility temper.
H, strain hardened – (applied to wrought products only) Used for products that have been strengthened by strain hardening, with or without subsequent heat treatment. The designation is followed by two or more numbers as discussed below.
W, solution heat treatment – This is seldom encountered because it is an unstable temper that applies only to alloys that spontaneously age at ambient temperature after heat treatment.
- 10 -
Heat treatment designations for aluminum and aluminum alloys can be observed in Table 2.5
Table 2.5 – Heat treatment designations for aluminum and aluminum alloys [25].
Term
Description
T1 Cooled from an elevated temperature shaping process and naturally aged to a substantially stable condition.
This designation applies to products which are not cold worked after cooling from an elevated temperature shaping process, or in which the effect of cold work in flattening or straightening has no effect on mechanical properties
T2 Cooled from an elevated temperature shaping process, cold worked and naturally aged to a substantially stable condition.
This designation applies to products which are cold worked to improve strength after cooling from an elevated temperature shaping process, or in which the effect of cold work in
flattening or straightening does have an effect on mechanical properties.
T3 Solution heat-treated, cold worked and naturally aged to a substantially stable condition. This designation applies to products which are cold worked to improve strength after solution heat-treatment, or in which the effect of cold work in flattening or straightening does have an effect on mechanical properties.
T4 Solution heat-treated and naturally aged to a substantially stable condition.
This designation applies to products which are not cold worked after solution heat-treatment, or in which the effect of cold work in flattening or straightening does not affect mechanical properties.
T5 Cooled from an elevated temperature shaping process and then artificially aged. This designation applies to products which are not cold worked after cooling from an elevated temperature shaping process, or in which the effect of cold work in flattening or straightening does not affect mechanical properties.
T6 Solution heat-treated and then artificially aged.
This designation applies to products which are not cold worked after solution heat-treatment, or in which the effect of cold work in flattening or straightening does not affect mechanical properties.
T7 T7 Solution heat-treated and overaged/stabilized
This designation applies to products which are artificially aged after solution heat-treatment to carry them beyond a point of maximum strength to provide control of some significant characteristic other than mechanical properties.
2.5
MMC
The prime constituents of an MMC usually play different roles. One, the matrix, will act as the basic structure into which another constituent, designated as reinforcement, is embedded. The term reinforcement should not be taken literally, since it does not always assume an effective mechanical strengthening role. In some cases the mechanical resistance of the reinforcement may be lower than that of the matrix. The reinforcement constituent is characterized not only by its chemical composition, but also by its shape, dimensions, volumetric fraction in the composite and its spacial distribution within the matrix.
Thus, the basic functions of each constituent being defined, is possible to establish a classification of composite materials, based on the nature of the matrix. There are the polymeric matrix composites –
- 11 -
It is complex to summarize the way different properties of an MMC are influenced by its microstructural parameters. Table 2.6 summarizes them in a very simplified framework, composed of generic behaviors, and it does not address the mechanisms behind such behaviors [26].
Table 2.6 – Generic effects over distinct mechanical properties of MMC‟s, caused by the increase of various microstructural parameters. The reference to properties evaluated according to an axial direction allows safeguarding the ability of the reinforcements not being equiaxed and/or presenting a preferred orientation [26].
MMC properties
Microstructural
parameters αaxial2 Eaxial 3
σy4
Work hardening rate Creep resistance Toughness (ductility) Reinforcement
content ↑ ↑ ↑ ↑ ↑ ↓
Reinforcement
slenderness ↓ ↑ ↕ ↑ ↑ ↕
Misalignment relative to a preferential direction
↑ ↓ ↕ ↓ ↓ ↕
Reinforcement
dimension – – ↓ ↓ ↑ ↑
Inhomogeneity of reinforcement spacial distribution – – – – ↓ ↓ Interface bond
strength ↓ ↑ ↑ ↑ - ↕
Interface reaction
layer thickness ↕ ↓ ↓ ↓ ↓ ↓
Thermal stresses – – ↓ ↓ ↓ ↓
Matrix porosity ↓ ↓ ↓ ↓ ↓ ↓
Matrix yield
stress – – ↑ ↑ ↑ ↓
In order to have a complete understanding of the mechanical behavior of a composite, it is important to introduce the concept of load sharing between the matrix and the reinforcing phase. In the case of an MMC with two constituents, we can admit that when the material is subject to an external mechanical load, that solicitation will be internally distributed, unevenly, by the matrix and the reinforcements. In the most usual situation, in which the hardness of the reinforcements is higher than that of the matrix, the performance of the reinforcements will be efficient if they can withstand a load higher than that of the matrix [26].
2.6
FGM
A Functionally Graded Material (FGM) corresponds to a group of materials characterized by a controlled variation in properties along at least one direction.
The concept of an FGM must be understood as an extension of the concept of composite material, conjugating properties of different materials, in order to optimize its global properties. The main difference is that, even though conventional composites are materials intrinsically heterogeneous, they
2 Thermal expansion coefficient, along axial direction 3Young‟s modulus along axial direction
- 12 -
can be considered homogeneous at a macroscopic scale, since at a large scale their properties remain
independent of the considered location. In the other hand, the heterogeneity of FGM‟s, manifests at a
macroscopic scale [26].
2.7
FS
FS can be used to produce metal matrix composites, since the severe plastic deformation which characterizes the process locally promotes the mixing of particles with the matrix, thus resulting in an optimal control over particles dispersion inside the microstructure. As a result, it becomes possible to achieve the formation of two coupled particle concentration gradients, which are consistently reproduced all along the tool trajectory (with the exception of the initial deformation stage): both in the transverse direction to the tool path and, provided multiple passes are undertaken, along the depth of the processed volume.
As the tool moves along its linear trajectory, two distinct zones are created, as a result of the coupling of the tool translation motion with its rotational motion. On the advancing side (AS), both velocities have the same orientation, hence the resulting tool velocity relative to the processed material is higher than on the retreating side (RS), where the rotational component is oriented backwards, and is then to be subtracted from the translational component. This difference also results in different viscoplastic conditions, which in turn tend to be reflected in the microstructure of the processed material, giving rise to the transverse functional gradient.
It should be remarked that, from the point of view of functionality, the coexistence of two orthogonally oriented gradients are desirable for some specific applications, and the search for effective ways to achieve such results have mobilized the scientific community in the field for some years [27]. The multi-pass procedure results in a layered FGM in which properties can be modified from the interior to the surface.
In a study for which the present thesis has been a contribution, Gandra et al. [28] demonstrated
that the most effective reinforcement hole patterns to perform the single and multi-layering depositions, were the ones depicted in Figure 2.4.
Based on results obtained, the most promising reinforcement distributions were achieved for consumable rods packed with SiC particles in holes at a distance of 3 mm from the centre. Moreover, in order to avoid the high degree of particle expulsion observed for peripheral holes (Figure 2.5), several additional configurations were tested, featuring holes equally spaced from the centre of the consumable rod.
- 13 -
The silicon carbide (SiC) reinforcements were packed inside 2 mm diameter holes, drilled with a 20 mm depth according to several patterns, as shown by Figure 2.5. In order to investigate several reinforcement strategies, single FS depositions were performed with a number of holes from 1 to 4, aiming to increase the SiC reinforcement concentration within the coating. When using multiple holes, these were placed at a 3, 6 and 8 mm radial distance from the centre. SiC with 118.8, 37.4 and 12.3 µm median sizes were used to assess the effect of reinforcement particle size on their distribution. Deposition without SiC particles was also performed [28].
- 15 -
3
Experimental Procedure
3.1
Materials
Substrate and Rod
For the purpose of this work, the following materials were used for the preparation of the samples:
AA2024-T3 (Rod)
AA6084-T6 (Substrate)
The choice of these materials consisted on the intrinsic properties presented by each of the alloys, as AA2024 possesses good mechanical resistance, whereas AA6084 has a good corrosion resistance [29].
3.1.1
Deposition Parameters
FS was performed using an ESAB LEGIO
TM3UL numeric control machine equipped with
AA 6082-T6 aluminium alloy consumable rods, measuring 20 mm in diameter and 60 mm
long. AA 2024-T3 plates with a 4.8 mm (0.190 ") thickness were used as substrates.
FS deposition parameters for single-layer samples are presented in Table 3.7, and Table 3.8 summarize deposition parameters for multi-layer samples. It should be noted that, most experiments consisted in the deposition of a mixture of metal / ceramic mixture, no SiC particle reinforcement was added during the production of samples P0 and P6.
Table 3.7 – Single layer sample FS deposition parameter.
Single-layer sample
P0 P1 P2 P3 P4 P5
Track number 1 1 1 1 1 1
Travel speed [cm/min] 35 35 35 35 35 35
Angle of attack [º] 0 0 0 0 0 0
Plunging speed5 [mm/s] 0.3 0.5 0.5 0.5 0.5 0.5
Rotation speed [rev/min] 3000 3000 3000 3000 3000 3000
Pressure applied [kg] 500 700 700 700 700 700
Rod consumption6 [mm/min] 1 1 1 1 1 1
Rod diameter [mm] 20 20 20 20 20 20
SiC particle size [m] 12.3 37.4 118.8 12.3 12.3
Number of holes in the rod 0 1 1 1 2 3
- 16 -
Table 3.8 – Multi-layer sample FS deposition parameter.
Multi-layer sample
P6 P7 P8
Track number 1 2 3 1 2 3 1 2 3
Travel speed [cm/min] 35 35 35 35 35 35 35 35 35
Angle of attack[º] 0 0 0 0 0 0 0 0 0
Lowering speed7 [mm/s] 0.5 0.5 0.5 0.5 0.5 0.5 0.5 0.5 0.5
Rotation speed [rev/min] 3000 3000 3000 3000 3000 3000 3000 3000 3000
Pressure applied [kg] 700 700 700 700 700 700 700 700 700
Rod consumption8
[mm/min] 1 1 1 1 1 1 1 1 1
Rod diameter [mm] 20 20 20 20 20 20 20 20 20
SiC particle size [µm] 12.3 12.3 12.3 12.3 37.4 118.8
Number of holes in the rod 0 0 0 1 2 3 1 1 1
Figure 3.6 depicts the experimental set-up for FS used in this work. In order to attain a good adhesion, consumable rods and substrates had to be degreased prior to deposition, as substrate surface cleaning and degreasing is crucial to achieve sound depositions [28].
Figure 3.6 – Multi-layer coating production by FS.(a) Experimental set-up, (b) Deposition by FS, (c) Initial plasticizing period of the second deposition, (d) Third deposition, (e) Resulting 3-layer coating [28].
3.2
Sample Preparation
In order to attain a good polishing result, all samples were mounted in an epoxy based resin.
3.2.1
Grinding and Polishing
Grinding was performed using a PRESI Mecatech 234 automated polishing machine, ranging from P180 until P800 SiC paper for planarity. Fine polishing started from P1000 to P4000. Subsequent uspension polishing was carried out manually on a PRESI Mecatech 333 with alumina suspension,
- 17 -
ranging from 1 m to 0.3 m. Final polishing was performed using a 0.04 m silica colloidal suspension.
Used Materials:
Abrasive grinding paper: PRESI P180, P320, P400, P600, P800, P1200, P2400, P4000
Polishing cloths: Buehler WhiteFelt®
Polishing suspension: Buehler MicroPolish II 1 µm, Buehler MicroPolish II 0.3 µm Buehler OP-S Colloidal Silica 0.04 µm
Polishing Machine: PRESI Mecatech 234 and Mecatech 333
Sample mounting: Buehler EpoKwick® Epoxy
In the Annex section,
Table 8.18 and Table 8.19 register the procedures used for grinding/polishing, automatically and manually, respectively.3.2.2
Etching
In order to reveal grain structure Weck‟s reagent was used. On the other hand Keller‟s etch was
used evidence SiC particle concentration, for its reactivity with Si.
The etching procedure is crucial to correctly reveal the grain borders, since over-etching usually requires posterior alumina polishing. Numerous etching procedures were used, changing prior sample surface cleaning with acetone/alcohol/distilled water, exposure times to Weck‟s reagent and
immersion / swabbing / cotton scrub.
Best results were achieved with fresh 50 ml distilled water, 2 g KMnO4 and 0.5 g NaOH etching solution.
The procedure found to provide the best results for image analysis was:
1. After fine sample polishing (0.04 µm), rinse with distilled water and remove any smudge with pure alcohol. Softly apply with cotton.
2. Pour enough Weck‟s reagent into a Petri crystal dish, to immerse the sample surface top down without touching the bottom.
3. Immerse for 15 seconds.
4. Quickly rinse with distilled water and dry sample surface. Observe at microscopy in order to verify etching is homogeneous along the entire surface.
5. Immerse once again for 10 seconds and rinse with distilled water.
3.2.3
Image Analysis
All samples were cross sectioned and prepared for metallographic analysis. Microstructural analysis was divided in two steps, where Optical Microscopy – OM – and image acquiring was performed using a Leica DMI5000M, using Leica Application Suite and image treatment was made
with ImageJ software.
Average grain size was calculated based on Feret diameters criteria, whereas slenderness factor calculations were based on maximum and minimum Feret non orthogonal diameters.
- 18 -
3.2.4
Microhardness
Regarding the micro-hardness profiles a Mitutoyo HM-112 equipment was used. Indentations in height were made with approximately, three diagonals minimum spacing, whereas the width measures had 1.5 mm spacing. A 0.2 g load was used for the testing.
3.2.5
SEM-EDS
The SEM-EDS trials were made on a Zeiss DCM 962 and the results are shown in the subsequent figures.
3.2.6
XRF
- 19 -
4
Results and discussion
4.1
Starting Materials
Given the intense deformation to which the material is subjected during processing, it was
important to know the initial microstructure of the material in the consumable rod.
Concerning the plate, the same kind of information was not considered so relevant, as the
influence of the FS process over the plate microstructure was negligible.
4.1.1
Alloy chemical composition
Results of the most relevant alloying species, obtained with XRF analysis, for each alloying elements can be observed in Table 4.9.
Table 4.9 – Alloys composition based on XRF analysis.
Element
(wt. %) Al Cu Cr Fe Mg Mn Si
Other elements
AA2024 85.0 5.0 0,5 0.5 9.0 rem.
AA6082 95.0 1.0 2.0 1.0 1.0 rem.
4.1.2
Microstructure of the Consumable Rod
The AA2021-T3 extruded rod used as a consumable tool for deposition presented an approximately 5 µm grain size, as registered in Table 4.10.
Table 4.10 – Rod average grain size and respective slenderness.
Grain size [µm] Slenderness [max/min]
Centre Centre
AA 6 0 8 2 -T6
- 20 -
Figure 4.7 depicts a single hole SiC particle holder rod, used in most depositions, whilst Figure 4.8 shows its microstructure. The hardness value measured for the rod as in received condition was 105 HV.
Figure 4.7 – Rod picture with a single hole for
SiC particles, Sample is etched with Weck‟s. the rods used for FS. Figure 4.8 – Cross-section micrograph on one of
From Figure 4.8 it is noticeable that an equiaxed grain is present all over the rod microstructure. This equiaxed microstructure is formed from a predominant primary phase, with some precipitates (blue and black).
4.2
Single Layer deposition
4.2.1
Unreinforced Single Layer FS Material
These samples were considered as a reference for the study of the composite FS materials to be analyzed under section 4.3.
P0 is a non-reinforced FS sample, and therefore full width and height hardness profiles were successfully measured, free from the influence of SiC particles interference on the microstructure of the metallic matrix. The average grain size and grain slenderness for P0 are shown in Table 4.11.
Table 4.11 – P0 average grain size and grain slenderness.
Grain size [µm] Slenderness [max/min]
Retr. side Middle Adv. side Retr. side Middle Adv. side
Po
sitio
n Top 3.313±0.086 5.618±0.091 4.820±0.099 1.605±0.009 1.757±0.010 1.817±0.013
Mid 7.404±0.138 6.495±0.116 9.040±0.214 1.766±0.018 1.783±0.016 1.862±0.017
Base 5.845±0.129 7.480±0.225 6.497±0.095 1.738±0.012 2.019±0.019 1.651±0.011
- 21 -
Figure 4.9 depicts a sample macrograph, in which it is possible to observe the HAZ beneath the deposited layer (ellipsoidal zone with lighter contrast). Blue zones denote higher level of grain refinement. Grain boundaries on these areas reacted more extensively to the etch solution.
The use of this characterization procedure is far from perfect, as the grain definition obtained for image analysis may induce measuring errors.
Figure 4.9 – P0 cross section macrograph. Left side is the advancing side of the tool. Scale bar: 5 mm.
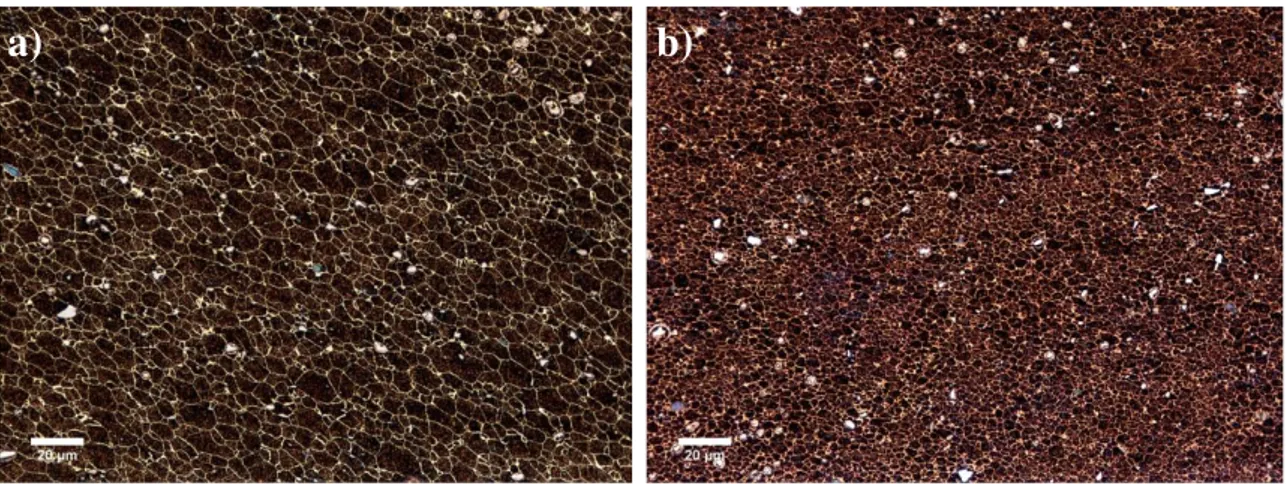
Detail on P0 microstructure is shown in Figure 4.10. A fine grain microstructure was achieved near the interface with BM on the retreating side of the coating.
Figure 4.10 –P0 layer micrographs. a) Center-Middle and b) Retreating-Base. Scale bar: 20 µm.
Figure 4.11 and Figure 4.12 exhibit the hardness profile along sample‟s layer width and height,
respectively. There is a clear increase in sample hardness along layer‟s height, just the same way as when moving towards the surface of the deposition. Top and base hardness profiles for P0 have slight variations along width.
Figure 4.11 – P0 horizontal hardness profile for top, middle and base of deposited layer. Graph origin represents the advancing side.
- 22 -
The peak hardness value for the top of the processed zone was 100 HV, while middle zone recorded 85 HV and finally the base of the coating had a peak value of 70 HV.
As seen in the Figure 4.12, retreating side possesses a higher hardness value over the mid and advancing side.
Figure 4.12 – P0 vertical hardness profile of retreating, middle and advance zones.
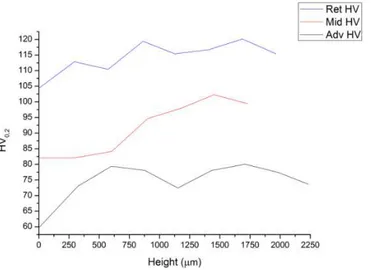
Regarding the height hardness measured for three different zones of the deposition, values as high as 120 HV, 100 HV and 80 HV (approximated values) were measured for retreating, middle and advancing side of the deposited single layer.
When compared to the initial rod hardness value (105HV) in the as received condition, it is noticeable a hardness decrease along the middle and advancing side of the deposited layer.
4.2.2
Reinforced Single layer FS materials
4.2.2.1
Effect of reinforcing particle size
P1, P2, P3 samples were obtained with a single pass deposition, featuring different SiC particle sizes (12.3, 37.4 and 118.8 µm respectively).
In the analyzed cross-section of sample P1, particles remained mainly located on the sides and the top of the sample, something that can be confirmed in Figure 4.13. Average grain size, along with slenderness for P1 is summarized in Table 4.12.
Table 4.12 – P1 average grain size and grain slenderness.
Grain size [µm] Slenderness [max/min]
Retr. side Middle Adv. side Retr. side Middle Adv. side
Po
sitio
n Top 5.720±0.089 5.298±0.073 6.030±0.102 1.770±0.012 1.721±0.010 1.763±0.012
Mid 6.185±0.105 7.689±0.192 6.642±0.144 1.769±0.012 1.728±0.014 1.801±0.017
Base 6.174±0.094 6.237±0.099 6.334±0.140 1.894±0.013 1.877±0.013 1.769±0.013
- 23 -
Figure 4.13 –Reinforced single layer sample. Weck‟s etch. Darker areas inside the layer exhibit SiCparticle concentration. Left side represents the advancing side.
Figure 4.14 shows the deposited layer microstructure. No refinement was achieved in this deposition.
Figure 4.14 – P1 deposited layer micrographs. a) Retreating-Top and b) Advance-Middle. Scale bar: 20 µm.
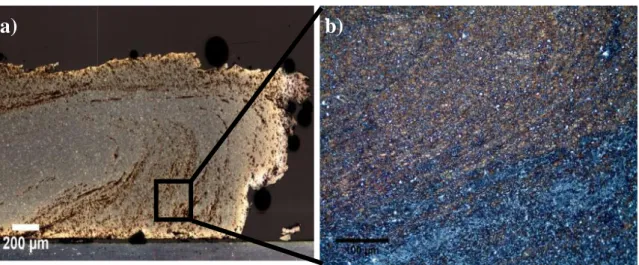
A detail of the SiC particle concentration, as well as the material flux, along the retreating side is presented in Figure 4.15
Figure 4.15 – Detail on the retreating side. High particle concentration is depicted in the right side,
corresponding to a magnification of the black area. Weck‟s etch. Scale bars: 200 and 100 µm.
a)
b)
- 24 -
Figure 4.16 and Figure 4.17 present different details of the deposition. In the first image (Figure 4.16a)) it is possible to observe a SiC agglomeration at the interface of layer-substrate, whilst the second one, etched with Keller‟s solution, depicts the concentration over the retreating and top of the deposited layer (Figure 4.17a) and b) respectively).
Figure 4.16 – Microscopic detail of SiC particle accumulation on the advancing side of the tool. The upper picture is a magnification of the marked area.
Weck‟s etching.
Figure 4.17 – Keller‟s etching of the advancing
side (base) and the middle (top) of the deposition.
Values for hardness range from 75 to 112 HV (approximated values) from minimum of the advancing side to maximum of retreating side (Figure 4.18).
Figure 4.18 – P1 vertical hardness profile for advancing, middle and retreating side of deposited layer.
a)
b)
a)
- 25 -
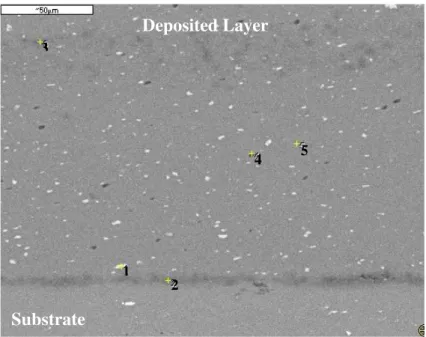
The area depicted in the photograph (Figure 4.19) is the deposited layer–substrate interface (horizontal region at the bottom). A particle agglomeration acting as boundary between the substrate and the deposited layer is noticeable.
Figure 4.19 – SEM micrograph of reinforced sample (P1) surface analysis. Scale bar: 50 µm.
Figure 4.20 presents the chemical analysis obtained by EDS technique. Each image represents a numbered point of Figure 4.19 and identifies the chemical elements detected by the SEM-EDS.
Figure 4.20 – EDS analysis for the spots depicted in the previous figure. From left to right, 1), 2), 3), 4) and 5).
The results are consistent with those obtained in the XRF analysis of the starting alloys (Table 4.9).
1 2 3
4 5
Substrate
- 26 -
Figure 4.21 exhibits the SEM images obtained from sample P1, showing that the ceramic particles tend to cluster in a separate layer that acts as a boundary between the substrate and the deposited metal.
Figure 4.21 – SEM Secondary Electrons micrographs of a single layer sample (P1). Scale bars: 5, 2 and 50 µm respectively.
P2 features 37.4 µm SiC particles, stored in one particle holder, inside the rod. A large grain size was observed for P2 in the middle zone, along with a high slenderness value for top and base (Table 4.13). Due to bad image properties, a.g.s. for some zones became impossible to calculate.
Table 4.13 – P2 average grain size and grain slenderness.
Grain size [µm] Slenderness [max/min]
Retr. side Middle Adv. side Retr. side Middle Adv. side
Po
sitio
n Top N/A 5.710±0.083 4.944±0.042 N/A 2.087±0.016 1.936±0.011
Mid 4.978±0.121 8.8379±0.226 7.280±0.148 1.722±0.011 1.843±0.019 1.711±0.013
Base N/A 8.236±0.164 6.288±0.105 N/A 2.174±0.021 2.083±0.017
No refinement was achieved when compared to the rod initial grain size. Slenderness, at some zones, is slightly higher than then the measured in previous samples.
Deposited Layer
Substrate
a)
b)
- 27 -
Figure 4.22 shows a macrograph, where is possible to verify that particles were mainly located along the top of the coating.
Figure 4.22 – Reinforced single layer sample. Weck‟s etch. Darker areas inside the layer exhibit SiC
particle concentration and higher grain refinement.
Analyzing the retreating side of the deposition (Figure 4.23) large dimension particles where found in this region.
Figure 4.23 – Detail on the retreating side of deposition. Scale bars: 50 µm and 5 µm respectively.
Details on the microstructure are depicted in Figure 4.24. It is noticeable the higher grain dimension achieved for the Center-Middle area, unlike the refinement obtained in the Retreating-Middle Zone.
Figure 4.24 – P1 layer micrographs. a) Center-Middle and b) Retreating-Middle. Scale bar: 20 µm.
As observed in Figure 4.25, the higher hardness values are found in the retreating side of the deposition. The lower value in the end of retreating side may be explained to interaction of the SiC particles in the surrounding, and the end of the deposition.
- 28 -
Figure 4.25 – P2 vertical hardness profile for advancing, middle and retreating side of deposited layer.
The data for the retreating side of the sample are scarce, as the height of the sample didn‟t allow
further measurements. Still a peak value of about 120 HV was reached within this zone. As for the middle and advancing side of the coating, a maximum 95 and 80 HV were achieved.
Sample P3 was reinforced by 118.8 µm particles and Table 4.14 summarizes a.g.s values of some areas of this deposition. Values for other zones were impossible to obtain due to the tarnish left over by the etching solution, making it impossible to achieve a visible grain boundary.
Table 4.14 – P3 average grain size and grain slenderness.
Grain size [µm] Slenderness [max/min]
Retr. side Middle Adv. side Retr. side Middle Adv. side
Po
sitio
n Top N/A N/A N/A N/A N/A N/A
Mid 7.074±0.225 N/A 6.883±0.137 1.882±0.021 N/A 2.248±0.020
Base N/A 6.595±0.134 N/A N/A 1.875±0.017 N/A
The scarce data obtained for this sample, indicates high grain size, along with an increase in slenderness factor, when compared to previous samples.
In the macrograph depicted in Figure 4.26 it is clear that the adhesion over the retreating side of
the deposition wasn‟t the ideal. The origin of this phenomenon is the high SiC particles concentration between the layer and de BM (Figure 4.28), some with approximately 50 µm.
- 29 -
The retreating side, once again, presents a higher hardness values than the ones measured in the rest of the sample (Figure 4.27), a clear trend in all samples in general.
Figure 4.27 – P3 vertical hardness profile for advancing, middle and retreating side of deposited layer.
As for this sample, the retreating side has a top value of about 117 HV, whilst middle and advancing side reached top values of approximately 107 and 90 HV respectively.
The micrographs presented in Figure 4.29 show in detail the size of the particles allocated over some areas of the sample. Some refinement of SiC particles was achieved, compared to their initial size (118.8 µm).
In [28] Gandra et. al. used Keller‟s solution to create a map, identifying different regions where
high dimension particles became allocated (Figure 4.28). A bad adhesion and high particle concentration is observed in the retreating side (right).
- 30 -
Figure 4.29 – a), b) and c) denote the high SiC particles in the interface zone, while c) shows a micrograph of the Middle-Top, d) in the Advance-Middle and e) in the Advance-Base. Scale bars: 50, 50 100, 20 and 20 µm respectively.
![Figure 1.1 – FSP: a) process schematic; b) cross section identifying different zones formed along the processed area, due to tool translation [1]](https://thumb-eu.123doks.com/thumbv2/123dok_br/16698137.743900/32.892.169.696.182.367/figure-process-schematic-section-identifying-different-processed-translation.webp)
![Figure 1.3 – Mechanical properties of BM and weld joints with and without heat treatment [4]](https://thumb-eu.123doks.com/thumbv2/123dok_br/16698137.743900/33.892.264.698.628.887/figure-mechanical-properties-bm-weld-joints-heat-treatment.webp)
![Table 2.2 – Maximum solubility values in solid solution and main alloying functions [20, 21]](https://thumb-eu.123doks.com/thumbv2/123dok_br/16698137.743900/35.892.156.770.443.732/table-maximum-solubility-values-solid-solution-alloying-functions.webp)
![Figure 2.5 – Hole pattern configuration for layer reinforcement in single layer depositions [28]](https://thumb-eu.123doks.com/thumbv2/123dok_br/16698137.743900/41.892.278.658.230.532/figure-hole-pattern-configuration-layer-reinforcement-single-depositions.webp)