Diana Ferreira Franco
Licenciada em Ciências de Engenharia Mecânica
Wobbling laser beam welding of copper
Dissertação para a obtenção do Grau de Mestre em Mestrado Integrado em Engenharia Mecânica
Diana Ferreira Franco
Licenciada em Ciências de Engenharia Mecânica
Wobbling laser beam welding of copper
Dissertação para a obtenção do Grau de Mestre em Mestrado Integrado em Engenharia Mecânica
Orientador:
A
GRADECIMENTOS
Em primeiro lugar, gostaria de agradecer à minha orientadora, Professora Rosa Miranda, por quem nutro a mais profunda admiração. Agradeço imenso a oportunidade que me proporcionou e, sobretudo, o apoio e orientação constantes.
Ao engenheiro Phil Carr quero agradecer por me ter aceite na sua empresa, Carrs Welding Technologies, e por me ter proporcionado esta fantástica experiência. Quero deixar um especial agradecimento ao engenheiro João Silva, que me apoiou durante o meu estágio. Deixo, ainda, um obrigado à Alison Holland e à Evelina Guduke por toda a simpatia e amabilidade com que sempre me trataram. Por fim, gostaria ainda de agradecer à Pat Gibson pela forma calorosa com que me acolheu durante a minha estadia em Inglaterra.
Agradeço também ao IPG Photonics por me permitirem desenvolver todo o conteúdo experimental nas suas instalações. Ao Nil Reinermann agradeço a partilha constante de conhecimento e disponibilidade. Os meus sinceros agradecimentos ao Doutor João Oliveira pela contribuição ao nível das análises de XRD e pelo constante aconselhamento.
Ao Professor Rui Silva pelo apoio nas análises SEM bem como ao Professor Alexandre Velhinho na metalografia um sincero obrigado.
O meu obrigada ao Professor Telmo Santos pelo apoio e orientação no desenvolvimento das análises de condutividade eléctrica.
À minha família agradeço o apoio incondicional e a oportunidade que me deram de delinear o meu futuro. Quero agradecer em especial à minha mãe, o meu porto de abrigo, ao meu pai, cujos olhos transbordam de orgulho sempre que fala de mim, e à minha prima, que tanto carinho me dá.
Ao meu namorado, Pedro Ramos, agradeço todo o apoio, palavras de encorajamento, dedicação e amor. Obrigada por estares e teres estado sempre ao meu lado. Não há consultor financeiro que perceba mais de soldadura laser de cobre que tu.
Quero deixar um agradecimento muito especial à minha afilhada, Catarina Brites, que, para além de ser uma amiga importantíssima foi, também, uma das pessoas que mais me ajudou e apoio ao longo desta etapa.
A
CKNOWLEDGEMENTS
First, I would like to thank my thesis supervisor, Professor Rosa Miranda, whom I deeply admire. I would never had accomplished my goal if it wasn´t for her providing me a chance to develop and carry a research in this field, believing in me, for her counselling and support.
To Eng. Phill Carr, I would like to thank for welcoming me at his company, Carrs Welding Technologies. He provided me with an amazing experience and opportunity. A special thanks to Eng. João Silva who supported me through the whole process and during my stay at the company. I also leave a big thanks to Alison Holland and Evelina Guduke for the sympathy and kindness they shown me every day. Finally, to Pat Gibson for the kindness of welcoming me at her house during the time I was in England.
I thank to IPG Photonics for supplying the facilities for my experiments and to Nil Reinermann for all the time and availability during the process.
My heartfelt thanks to Doctor João Oliveira for his contribution to the XRD analysis and for the constant advisory.
To Professor Rui Silva I thank for the helping with SEM analysis and to Alexandre Velhinho in metallography.
To Professor Telmo Santos thank him for all the guidance and support during the development of the electrical conductivity analysis.
To my family, a special and unique thanks to the unconditional support and the opportunity of choosing and tracing my own future. To my mum, my every day shelter, to my dad which the eyes overflow pride every time someone mentions my name and to my cousin for all the love and affection.
To my boyfriend, Pedro Ramos, I thank him for all the support, encouraging me during the rough times, dedication and love. Thank you for being always available for me and at my side. There is no financial consultant that knows more about laser welding than you!
I leave a very special thanks to my University goddaughter, Catarina Brites. On top of being a very important friend, she had a major contribution during this thesis.
R
ESUMO
O aumento de componentes eletrónicos na indústria automóvel e a expansão das energias renováveis conduziram à necessidade de um processo fiável e produtivo de soldadura de cobre. A soldadura laser satisfaz estes requisitos, mas é um desafio devido à elevada condutividade térmica do cobre e à sua baixa absortividade da radiação. Contudo, desenvolvimentos recentes sugerem que estes problemas podem ser ultrapassados através da modulação espacial da distribuição de intensidade de potência do laser. O presente trabalho, desenvolvido na empresa Carrs Welding Technologies, visou estudar a viabilidade da soldadura laser de componentes a baterias em cobre. O principal objectivo foi determinar a combinação de parâmetros que permitiam obter um cordão de soldadura sem defeitos, sem perda de condutividade eléctrica e com uma profundidade de 1,5 mm.
Foram produzidas soldaduras com laser de fibras em diferentes combinações de parâmetros e com diferentes modulações que foram analisadas por metalografia e com ensaios de condutividade eléctrica, de forma a determinar a influência de cada parâmetro na geometria e propriedades dos cordões. Posteriormente, realizaram-se soldaduras com lasers diferentes de modo a comparar fibras simples e multimodo.
Verificou-se que a modulação do feixe permite suprimir porosidades e defeitos de forma do cordão. Uma penetração igual ou superior a 1,5 mm foi observada para potências acima de 4 kW, velocidades de soldadura entre 3,5 e 4 m/min, diâmetros de rotação entre 0,6 a 1 mm para uma frequência de rotação de 100 Hz com uma modulação circular. Os valores de dureza sugerem que não existe uma variação significativa na resistência mecânica da zona soldada quando comparada com o material base. Os ensaios de Correntes de Eddy mostraram que a soldadura não afecta a condutividade eléctrica do material.
A
BSTRACT
The increase of electrical components in automotive industry and the expansion of renewable energy generation lead to a rising need of a reliable and highly productive welding process for copper. Laser beam welding of copper has been a challenge due to the high thermal conductivity of Cu and its low absorptivity of laser radiation. However, recent developments suggest that these problems can be overcome by power spatial modulation of the beam.
This research work was developed at Carrs Welding Technologies, UK, aiming to study the feasibility of fiber laser to weld electrolytic copper components to batteries. The main goal was to determine the parameter combination that allows to obtain a welded seam free of porosity and other weld defects with a penetration of 1.5 mm without losing electrical conductivity which was a mandatory requirement. In a first stage, multiple weld beads with different welding parameter combinations were produced in order to determine the influence of each parameter in the process. In the second stage, single-mode and multimode fiber lasers were compared. The outcome of these two stages were examined using metallography and electrical conductivity tests, namely, Eddy Currents.
The results have shown that power spatial modulation can supress porosities, weld shape defects and spatter. A penetration of 1.5 mm can be achieved for a multimode beam power above 4 kW, welding speed between 3.5 and 4 m/min with a circular spatial modulation with a beam rotation of 0.6 to 1 mm diameter at 100 Hz frequency. The hardness measured suggest that there is no significant variation of mechanical resistance of the joins compared to the base material. Electrical conductivity measurements showed there is no variation in the welds.
P
ALAVRAS
-
CHAVE
Soldadura de cobre electrolítico Soldadura laser
Modulação laser Laser Wobbling
Condutividade eléctrica
K
EYWORDS
Electrolytic Copper welding Laser beam welding
L
IST OF CONTENTS
Agradecimentos ... v
Acknowledgements ... vii
Resumo ... ix
Abstract ... xi
Palavras-chave ... xiii
Keywords ... xiii
List of contents ... xv
List of Figures ... xvii
List of tables ... xxiii
Abbreviations ... xxv
Symbols ... xxv
Chapter 1 – Introduction... 1
1.1. Motivation ... 1
1.2. Objectives ... 2
1.3. Structure ... 2
Chapter 2 – Literature review ... 3
2.1. Copper and its properties ... 3
2.1.1. Electrolytic tough pitch copper ... 7
2.2. Laser beam welding ... 9
2.2.1. Basic laser fundamentals ... 9
2.2.2. Fiber laser beam welding... 10
2.2.3. Welding process ... 13
2.2.4. Operating parameters ... 16
2.2.5. Wobbling LBW ... 18
2.2.6. LBW defects on pure copper ... 21
3.2. Laser System ... 28
3.3. Fixturing system ... 31
3.4. Welding tests ... 32
3.4.1. Preliminary experiments ... 33
3.4.2. Multimode fiber ... 33
3.4.3. Single-mode fiber ... 35
3.5. Characterization techniques ... 36
3.5.1. Visual inspection ... 36
3.5.2. X-Ray inspection ... 36
3.5.3. Metallographic analysis ... 36
3.5.4. SEM/EDS analysis ... 36
3.5.5. X-Ray Diffraction analysis ... 37
3.5.6. Hardness testing ... 37
3.5.7. Electrical conductivity testing ... 37
Chapter 4 – Results and discussion ... 39
4.1. X-ray inspection ... 39
4.2. Visual inspection ... 40
4.2.1. Multimode fiber ... 40
4.2.2. Single-mode fiber ... 50
4.3. Wobbling effect on the weld depth ... 53
4.4. Metallographic analysis ... 56
4.5. SEM/ EDS analysis ... 66
4.6. XRD analysis ... 70
4.7. Hardness measurement ... 72
4.8. Electrical conductivity testing ... 77
L
IST OF
F
IGURES
Figure 2.1 - Grain structure of Cu-ETP containing several annealing twins [1]. a) Microstructure of a wrought tough pitch copper sample heated in hydrogen (300x); b) Microstructure of wrought and
annealed tough pitch copper (250x). ... 4
Figure 2.2 - Thermal conductivity of pure copper. ... 5
Figure 2.3 - Absorptivity of different metal groups at room temperature as a function of wavelength [5]. ... 6
Figure 2.4 - Thermal conductivity and absorptivity as a function of temperature for copper at a wavelength of 1070 µm [6]. ... 6
Figure 2.5 - The effect of oxygen content on the microstructure of copper-oxygen alloys [1]. Oxygen content: a) 0.024%; b) 0.05%; c) 0.09%; d) 0.18%. (100x). ... 7
Figure 2.6 – Samples of Cu-ETP [1]. a) Longitudinal section shows equiaxed grains and well-dispersed, slightly elongated Cu2O particles (dark dots) (250x); b) Copper cold-rolled bar, annealed and then tungsten arc welded in two passes (2x). ... 8
Figure 2.7 – Effect of the copper oxides in Cu-ETP [1]. a) The hydrogen diffused into copper reacted with Cu2O at the grain boundaries, formed steam and force grains apart, causing embrittlement and porosity (75x); b) Voids caused by hydrogen presence (250x). ... 8
Figure 2.8 - Comparison of the power density of various welding processes [8]. ... 9
Figure 2.9 - Schematic of a high-power, double-clad fiber laser [21]. ... 11
Figure 2.10 - Single-mode and multimode fibers, laser intensity and beam diameter. ... 11
Figure 2.11 – Beam divergence [16]. ... 13
Figure 2.12 - Influence of the power density on the welding mode. ... 14
Figure 2.13 - Conduction-limited welding (on the left) [8] and keyhole welding (on the right) [18]. .. 14
Figure 2.14 - Laser welding system. Horizontal input variables, vertical fixed input parameters and process output parameters. ... 16
Figure 2.15 – Difference between positive and negative focal point positioning [26]. ... 17
Figure 2.16 – Reflectivity during LBW for keyhole and conduction mode. [27] ... 17
Figure 2.17 - Schematic of the wobble welding technique [28]. ... 19
Figure 2.18 - Most common wobble shapes used [55]. ... 19
Figure 2.21 - Laser beam welded copper sample, Cu-ETP (laser power = 1500 W, welding speed = 50 mm/s, rotation frequency =200 Hz) [42]. ... 22 Figure 2.22 – Porosity formation [41]. ... 22 Figure 2.23 - Spatter and surface void formation [41]. ... 22 Figure 3.1 - Intensity distribution and beam profile of the fiber laser for 50 mm beam diameter (800 W). ... 29 Figure 3.2 - Intensity distribution and beam profile of the fiber laser for 100 mm beam diameter (1500 W). ... 29 Figure 3.3 - Experimental set-up. ... 30 Figure 3.4 - Experimental set-up. a) Control equipment; b) Shielding device and beam angle. ... 31 Figure 3.5 – Jig designed to the experimental trials. ... 32 Figure 3.6 - Wobbling laser beam welding scheme. ... 32
asdfg
L
IST OF TABLES
Table 2.1 – Electrical conductivity values for various metals [1]. ... 4 Table 2.2 – Tensile properties of pure copper [1]. ... 6 Table 2.3 – Hardness properties of pure copper [7]. ... 7 Table 2.4 - Beam quality and wavelength for several commercial lasers [11]. ... 10 Table 2.5 – Advantages and disadvantages of conduction and keyhole LBW [17]. ... 15 Table 2.6 - Chemical behaviour and physical proprieties of laser welding gases. ... 18 Table 2.7 – Major developments in LBW of pure copper. ... 23
espaço
A
BBREVIATIONS
BM – Base material
Cu-ETP – Electrolytic tough pitch copper FZ – Fusion zone
HAZ – Heat affected zone LBW – Laser beam welding
Nd:YAG – Neodymium-doped yttrium aluminium garnet
S
YMBOLS
1.1.
Motivation
Nowadays, copper is frequently used for the current-carrying components of batteries, power modules, industrial motors, etc. Due to the increasing demand of electrical components in the automotive industry and the expansion of renewable energy generation, the consumption of copper for fabrication of electrical components increases.
In modern industrial production, automatic and highly productive manufacturing processes are required. Laser welding meets these requirements and is now commonly used. A laser light beam with high intensity is focused into a small spot size and this concentrated heat source enables fine, deep welding at high welding speeds.
A notable progress in high-power and high-brightness lasers has been seen in recent years. At the same time applications have been developed in difficult-to-weld materials, like copper. When welding copper, it is difficult to form a melt pool because copper has not only a high thermal conductivity, but also a high reflectivity to solid state lasers emitting at 1 µm wavelength.
Thus, beam scanning has been tried to overcome these drawbacks. Different techniques have been experimentally tested, namely rapid rotation of the beam around its axis while it travels along the joint at a very high speed. The results reported, so far, show this may be a technique to overcome welding problems, as porosities, spatter, increasing the beam/material coupling.
1
C
H
A
P
T
E
R
Chapter 1 – Introduction
1.2.
Objectives
This thesis was developed at Carrs Welding Technologies in the UK aiming to study the feasibility of fiber laser to weld electrolytic copper plates. The laser welding of copper plates for join electrical connections on batteries has been a challenge due to the high thermal conductivity and low absorptivity of the material. Carrs Welding Technologies has been welding copper plates with Nd:YAG pulsed lasers which produce irregular and inconstant weld seams with a large amount of spatter and occasional drilling. Additionally, Nd:YAG lasers have lower efficiency when compared to fiber lasers.
The company was seeking to access the feasibility of multimode fiber laser for this particular application where sound welds with no loss of electrical conductivity were mandatory.
Therefore, the main objective was to investigate the influence of major process parameters (laser power, welding speed, focal point position, rotation diameter, rotation frequency and beam trajectory) on the weld geometry (weld width and penetration) and soundness. So, metallographic analysis and electrical conductivity testing were performed to assess the welds. Additionally, single-mode and multimode fibers have been also tested for comparison.
1.3.
Structure
This thesis was structured in five chapters.
Chapter 2 provides an overview of the state of the art which is divided in two main sections. The first one concerns the material studied, while the most relevant findings and breakthroughs reported in literature are summarized in the second section. This chapter aims to establish both a theoretical basis and a framework for result analysis and discussion throughout this thesis.
Chapter 3 describes the experimental methodology and characterization techniques adopted. A description of the base material and the welding equipment characteristics are included. The tested range of process parameters is presented.
Chapter 4 presents and discusses the results achieved in light of the literature reports. This chapter was organized according to the characterization techniques performed.
Chapter 2 – Literature review
2.1. Copper and its properties
Copper was first used to fabricate tools and weapons since about 3500 years BC.Nowadays, it is one of the most used materials for electrical current-carrying components in batteries, power modules, industrial motors, etc., because of its excellent electrical and thermal conductivities and high formability. Pure copper is soft, ductile and easily worked but can only be strengthened by cold working. It does not undergo phase changes in solid state, so it cannot be hardened by heat treatment. Pure copper contains more than 99.3% and has the highest electrical and thermal conductivity. Impurities like phosphorus, tin, selenium, tellurium, and arsenic are detrimental to properties such as electrical conductivity and recrystallization temperature [2].
At all temperatures below the melting point, copper exhibits the face-centered cubic (FCC) structure. In FCC metals, the {111} octahedral planes and the <110> directions are the most packed atomic systems and, therefore, constitute the most active slip systems. Copper lattice has 12 possible slip systems which ensure an excellent deformation and formability. Due to its FCC structure, copper tends to easily form twins, to accommodate deformation arising from recrystallization following cold work. Thus, the presence of twins in the microstructure is evidence that the metal has been mechanically deformed prior to annealing [1]. Typical microstructures of cold worked pure copper are shown in Figure 2.1.
Twinning is an important process to strengthen copper, once twinning causes an effective decrease in slip barrier spacing, which reduces the linear dimensions over which internal stress concentrations may accumulate: an increased applied stress is required to initiate further plastic flow. Additionally, twinning brings into play auxiliary deformation systems that work harden the material to prevent the accumulation of stress concentrations. The interfaces of deformation twins represent effective obstacles to slip [3].
2
C
H
A
P
T
E
R
Chapter 2 – Literature review
Copper density is about 8.90-8.95 g/cm3, depending on its thermomechanical history. Density initially
decreases with increasing degrees of cold work owing to the generation of vacancies and dislocations. Therefore, it increases to a value higher than that of a recrystallized copper, which has been explained by the presence of subgrain boundaries [1].
Electrical Conductivity
As shown in Table 2.1, just silver has a higher electrical conductivity than copper. The electrical conductivity scale established in 1913 was based on a copper standard defined as 100%, and the electrical conductivity of any material is still expressed as a percentage of IACS (International Annealed Copper Standard), equal to 100 times the ratio of the volume resistivity of the annealed copper standard
(0.017241 μΩ∙m) at 293 K to the value measured for the material concerned. The highest purity copper produced today (99.999% Cu) has been found to be 103 % IACS [1].
Table 2.1 – Electrical conductivity values for various metals [1].
Material % IACS
Pure silver 106
Pure copper (99.999% Cu) 103.06
C10100 (oxygen-free electronic, OFE) 101 C11000 (electrolytic tough pitch, ETP) 101 C12000 (phosphorus deoxidised, DLP) 98
Pure gold 73.4
a) )
b) )
Figure 2.1 - Grain structure of Cu-ETP containing several annealing twins [1]. a) Microstructure of a wrought tough pitch copper sample heated in hydrogen (300x); b) Microstructure of wrought and
Chapter 2 – Literature review
Electrical conductivity is sensitive to temperature: for copper, it drops from 800% IACS at –33 K to 38% IACS at 698 K. However, it is independent of its crystal orientation and does not vary significantly with grain size. Cold working an annealed copper to about 90% reduction can cause a drop of 2 to 3% IACS. Copper composition is also important since all additives reduce its electrical conductivity [1]. Although decreasing the electrical conductivity, oxygen and hydrogen are used in small and controlled amounts because they remove from solution impurities such as iron that are far more detrimental [2].
Thermal Conductivity
Copper is a good conductor of heat as well. Thermal conductivity is the rate at which heat flows through a material. Materials with high thermal conductivity dissipate heat rapidly resulting in a relatively uniform temperature profile in the material. Changes in thermal conductivity generally follow those in electrical conductivity in accordance with the Wiedemann-Franz relationship, which states that thermal conductivity is proportional to the product of electrical conductivity and temperature [1]. Figure 2.2 shows the influence of temperature on the thermal conductivity of pure copper.
Absorptivity
Figure 2.3 shows the absorption behaviour of copper and gold compared to other two important groups of metals, aluminium and iron based materials. As it can be seen, the absorptivity of copper is very low for the typical wavelength of solid-state lasers and diode lasers compared to frequency doubled lasers [5]. At a wavelength of 1070 µm the absorptivity is approximately 3%, whereas at a wavelength of 532
μm the absorptivity is nearly 40%. 100
200 300 400 500
0 250 500 750 1000 1250 1500 1750 2000 2250 2500
T herm a l Co nd utiv it y (W/m ∙K ) Tempertature (K)
Chapter 2 – Literature review
Absorptivity of copper also depends on the temperature. Figure 2.4 shows the relation between absorption and temperature at a wavelength of 1070 μm. It is possible to identify an abrupt increase of the absorptivity in copper during the phase change from solid to liquid. As soon as the threshold for the welding of copper material is overcome and liquid melt is available, the absorptivity of copper increases [6].
Mechanical properties
Copper is considered a soft and ductile metal. Tensile properties for both annealed and cold-drawn coper are listed in Table 2.2.
Table 2.2 – Tensile properties of pure copper [1].
Tensile strength (MPa)
Yield strength at 0.5% extension (MPa)
Elongation (%)
Reduction in area (%) Annealed
209 33 60 92
0 10 20 30 40 50
0 500 1000 1500 2000 2500
Abs o rpt iv it y ( %) Temperature (K) Melting point
Figure 2.3 - Absorptivity of different metal groups at room temperature as a function of wavelength [5].
Chapter 2 – Literature review
Unlike ferrous materials, the relationship between hardness and tensile strength is not constant. Table 2.3 shows typical hardness values for a range of tempers.
Table 2.3 – Hardness properties of pure copper [7].
Hardness (HV) Annealed 60 max. Half-hard 70-95
Hard 90 in.
2.1.1. Electrolytic tough pitch copper
There are three separate grades of pure copper: oxygen-free copper (with less than 0.02% oxygen); tough pitch copper (that contains <0.1% of oxygen) and phosphorous deoxidised copper (with 0.05% P up to 0.05% arsenic). The influence of oxygen content on the microstructure of copper-oxygen alloys are shown in Figure 2.5.
Electrolytic tough pitch copper (Cu-ETP) is a commercially pure high-conductivity copper of any origin that has been refined by electrolytic deposition, then melted, oxidized, and brought to tough pitch or controlled low oxygen content, and finally cast into cakes, billets, wire bars, and so on, suitable for hot or cold working, or both [2].
The typical grain boundaries of pure copper are sharply defined due to twinning, as shown in Figure 2.6 a). In Figure 2.6 b) it is possible to identify columnar grains resulting of the welding process. Columnar grains are usually developed with a preferred crystal orientation in the direction of heat flow and with the grain boundaries parallel to this direction [1].
a) b) c) d)
Chapter 2 – Literature review
The copper oxides in tough pitch copper can result in embrittlement of the heat affected zones due to oxide films forming on the grain boundaries. Weld metal porosity, even when using fully deoxidised filler metals, is also a major problem caused by the dissociation of the copper oxide, particularly when hydrogen is present [4]. If oxygen-bearing copper is heated above approximately 400 °C in a hydrogen containing atmosphere (or in some cases other reducing gases), the hydrogen dissolves readily in the copper and then diffuses rapidly. On encountering the Cu2O particles, the following reaction occurs:
2 𝐻 + 𝐶𝑢2𝑂 ↔ 2 𝐶𝑢 + 𝐻2𝑂
The H2O molecules formed combine readily into gas (steam) pockets, as these molecules are insoluble
in the copper. This gas pockets evolve to voids during solidification [1]. The influence of hydrogen content on the microstructure of electrolytic tough pitch copper are shown in Figure 2.7.
Figure 2.6 – Samples of Cu-ETP [1]. a) Longitudinal section shows equiaxed grains and well-dispersed, slightly elongated Cu2O particles (dark dots) (250x); b) Copper cold-rolled bar, annealed and then tungsten arc
welded in two passes (2x).
a) b)
Chapter 2 – Literature review
2.2.
Laser beam welding
2.2.1.
Basic laser fundamentals
Laser is one of the greatest innovations of the second half of the 20 century. The initial foundation of laser theory was laid by Einstein, in 1916, with the theory of light emission. Years later, Schawlow and Townes invented the maser, a device that produced consistent electromagnetic waves through amplification by stimulated emission. In 1960, Mainman developed the first working laser, a ruby laser [8, 9].
Light amplification by stimulated emission of radiation (laser) is a coherent, convergent and monochromatic beam of electromagnetic radiation. Laser can deliver very low (∼mW) to extremely high (1–100 kW) focused beam power with a precise spot size/dimension and interaction/pulse time (10−3 to 10−15 s) onto any kind of substrate through any medium. As a result, laser has wide applications
in engineering as automotive, aeronautics or aerospace but also in other fields such as communication, metrology, reprography, military, chemical, medical, etc. [9].
Laser beam welding
Chapter 2 – Literature review
In a solid-state laser, a single crystal is doped with small concentrations of transition or rare earth elements. The electrons of the dopant element can be selectively excited to higher energy levels upon exposure to high-intensity flash lamps. Lasing occurs when these excited electrons return to their normal energy state. In gas laser, a gas mixture is continuously excited by electrodes connected to the power supply and lasers. Besides solid-state and gas lasers, semiconductor-based diode lasers are also used in engineering [8].
Each type of laser has a characteristic wavelength which is determined by the energy difference between excited and fundamental energy levels [8]. There are several types of laser with different excited species but, for material processing, CO2, Nd:YAG and fiber lasers are the most popular systems. Table 2.4
summarizes the typical beam quality and wavelength of several commercial lasers.
Table 2.4 - Beam quality and wavelength for several commercial lasers [11].
2.2.2.
Fiber laser beam welding
Fiber lasers are solid-state lasers, with high power efficiency and beam quality. The first use of fiber lasers dates from the early 1960s, when low power lasers were used in optical amplifiers. In 2000, a fiber laser with 100 W was produced for materials processing [11] and a rapid increase in output power was seen since then.
The basic structure of a fiber laser is shown in Figure 2.9. In fiber laser, the active medium (most commonly, silica) is doped with a rare-earth element. The beam pump is launched longitudinally along the fiber length and it may be guided by the core itself. The active medium doped with erbium (1540-1560 µm), ytterbium (1070-1080 µm) or thallium (1800-2000 µm), is excited by battery of diode lasers [8, 9]. Two Bragg gratings (thin layers of different refractive index), which reflect a predetermined narrow or broad range of wavelengths of light incident on the grating while passing all other wavelengths
Laser type Typical beam quality BPP (mm∙mrad)
Wavelength (µm)
CO2 3.7 10600
Lamp pumped Nd:YAG 25 1060
Diode pumped Nd:YAG 12 1060
Yb fiber laser (IPG YLR7000) 18.5 1070
Yb fiber laser (IPG YLR10000) 11.6 1070
Chapter 2 – Literature review
The high power fiber lasers present several advantages, including: high efficiency, compared to lamp or diode pumped rod lasers; compact design, which simplifies installation; good beam quality, due to the use of small diameter fibers, and consequently a small beam focus diameter; and a robust setup for mobile applications [11]. Additionally, maintenance costs are virtually zero. The lifetime of the pumping diodes exceeds the lifetime of other diode pumped lasers [2], which leads to low long-term costs. High power fiber lasers can be used for deep penetration welding in a vast diversity of materials since the low wavelength that characterizes these lasers allows its absorption by almost all metals and alloys, and the fiber delivery system provides the necessary flexibility for positioning the beam [11].
Single-mode and multimode fiber lasers
When a ray travels down a fiber, it can follow many paths or modes. For example, it can follow the axis of the core or it can reflect off the core-cladding interface. Fiber cables can be divided in two categories: single-mode and multimode. Figure 2.10 illustrates the differences between single-mode and multimode fibers.
Intensity
Beam diameter
SM
MM
Single-mode (SM)
Multimode (MM) Cladding
Core
Chapter 2 – Literature review
Single-mode fiber is an optical glass fiber with a core diameter so small it has only one mode for light to travel. It usually has a core size between 8 and 9 µm and, because of this straight path, dispersion is negligible [13]. Sigle-mode cables are used in long-distance and extremely high bandwidth applications. This type of fiber produces a narrow and high intensity beam that can be focused down to a very small spot size.
Multimode fiber has a core with a relatively large diameter (50 to 200 µm) and light rays can travel along many modes and paths. This causes dispersion and limits the distances and bandwidth of multimode cable. The dispersion can be considerably reduced using a graded-index multimode where the core-cladding boundary is gradual rather than a sharp transition [13]. The resulting beam of multimode fibers has lower intensity and larger focused spot sizes.
Multimode fibers are commonly used for welding purposes. Multimode fiber laser beam more equally distributes its intensity across the weld, resulting in more stable welding conditions. It is less sensitive to gaps between welding surfaces, and its larger flat top intensity profile melts more base material volume, effectively bridging gaps as needed. However, there are some cases where single-mode fiber lasers can be implemented effectively in welding applications; high speed lap welding, for example, or very close-fitting joints that can be welded with significantly lower laser power, but still achieve a certain penetration over multimode lasers [14].
Beam quality
In high-power beam laser, the ability to focus the beam is critical, because good focusability means a smaller spot size, higher power density and larger depth of field. When focusability is good, focusing optics with a longer focal length can be used, which in turn leads to a large work clearance. The focusability of a laser beam is often referred to as the beam quality, and can be measured in various ways [8]. According to ISO standard 111146:1999, the parameters to quantify the beam quality of a laser beam are:
- The beam parameter product (BPP), i.e., the product of the beam radius at the beam waist (𝑑𝑤𝑎𝑖𝑠𝑡/2) with the far field beam divergence angle (𝛩) and is defined by equation 1:
Chapter 2 – Literature review
- The M2 factor, that represents the degree of variation of a beam intensity from the ideal Gaussian beam.
It is defined as the beam parameter product dived by the corresponding product for a diffraction-limited Gaussian beam with the same wavelength (𝜆) as defined in equation 2. Gaussian beams have the highest possible beam quality, which is associated to lower beam parameter products and corresponds to M2=1.
𝑀2= 𝐵𝑃𝑃 ∙𝜋
𝜆
- The K factor, defined by equation 3, is the inverse of M2 factor and is high (ideally 1) for high quality
beams.
𝐾 =𝑀12
The fundamental propagation modes of fibers are generally not exactly Gaussian, but also not too far from that shape. Therefore, a Gaussian beam can usually be launched into a single-mode fiber with high efficiency (80% or larger), provided that suitable optics are used [15].
2.2.3.
Welding process
There are three welding modes with a laser: conduction, transition and keyhole as shown in Figure 2.12. The first occurs when the power density is insufficient to cause metal vaporization at a given welding speed. The weld pool has strong stirring forces driven by Marangoni currents resulting from the variation in surface tension and density with the temperature. The Marangoni forces are related to surface-tension-temperature-gradient-driven fluid flow, where the flow at the weld pool surface progresses from regions of low surface tension to regions of high surface tension [8].
Figure 2.11 – Beam divergence [16].
(2)
Chapter 2 – Literature review
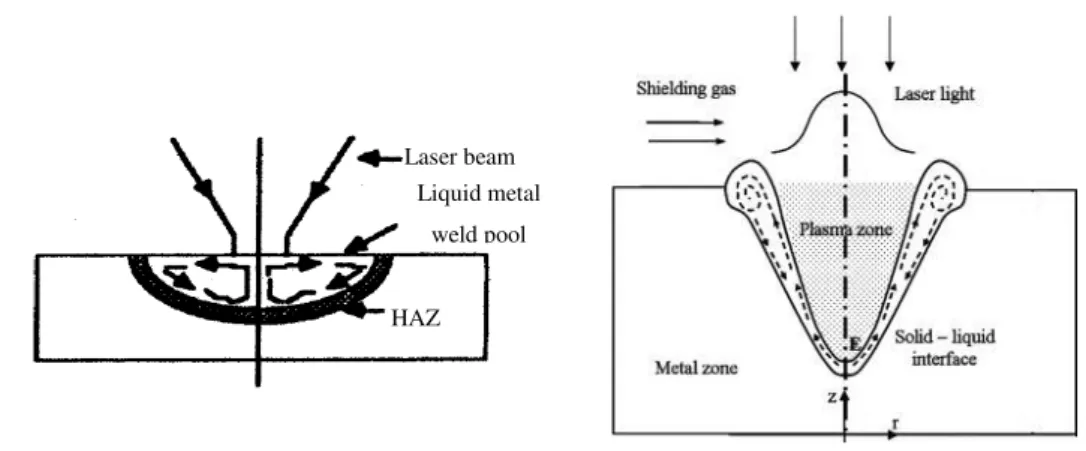
Opposite to this is keyhole welding mode, in which there is sufficient energy per unit length to cause vaporization and hence a capillary of vaporized metal forms in the melt pool. This capillary is stabilised by the balance of pressures from the vapour being generated. In some high-power plasma welds, there is an apparent hole, but this is mainly due to gas pressures from the plasma or cathode jet rather than from evaporation. The ‘keyhole’ behaves like an optical black body in that the radiation enters the hole and is subjected to multiple reflections before being able to escape [8, 9].
For the keyhole to remain open continually, to permit the transfer of energy necessary for welding to take place, various forces must interact. The vapour presses from inside onto the wall of the keyhole, and thus also acts against the hydrostatic pressure and surface tension of the molten envelope. The upward and downward flowing vapour applies a force to the inner wall of the molten envelope by friction against which the weight of the molten material reacts, these forces thus support the weight of the molten metal. In addition, there is a considerable amount of movement of the molten metal generated
Laser beam
HAZ Liquid metal
weld pool
Figure 2.13 - Conduction-limited welding (on the left) [8] and keyhole welding (on the right) [18]. Power density W eld d ep th C on du ct io n T ran sitio n Ke yh ole C ut tin g
Chapter 2 – Literature review
The mixed mode regime or the transition mode between conduction and keyhole occurs when the power density is enough to heat the material and just above the vaporization threshold the keyhole is not stable and does not extend beyond the melt front.
The weld bead geometry, such as the width and the penetration depth, are key factors when assessing the weld quality. Indeed, insufficient penetration reduces weld strength resulting in a poor weld quality. Moreover, the instability and eventual collapse of the keyhole is considered as a possible cause of porosity in laser welding due to the entrapment of vaporized alloying elements or shielding gas [20]. The advantages and disadvantages of conduction and keyhole in LBW are presented in Table 2.5.
Table 2.5 – Advantages and disadvantages of conduction and keyhole LBW [17].
Process Advantages Disadvantages
Conduction laser welding
- No porosity, no cracking and no undercut on the welds;
- No spatter;
- Stable process;
- Control of the heat input;
- Applicable to laser systems with any beam quality;
- Good gap bridging ability due to the large beams used.
- High energy;
- Slow process;
- Low productivity;
- Low coupling efficiency.
Keyhole laser welding
- High productivity;
- Deep penetration welds with a high aspect ratio;
- Low distortion;
- Narrow HAZ.
- High amount of spatter;
- Unstable process;
- High levels of porosity;
- Degradation of mechanical properties;
Chapter 2 – Literature review
2.2.4.
Operating parameters
To obtain a good weld, several process parameters must be controlled. Parameters such as wavelength and beam quality depend on the selected laser source and cannot be changed. Others, like laser power, welding speed, focusability, material properties and focus spot should be adjusted to improve the weld quality. Laser beam parameters are resumed in Figure 2.14.
Laser power:The depth of penetration with laser welding is directly related to the power density of the laser beam and is a function of incident laser power and beam diameter. For a constant beam diameter, penetration typically increases as the laser power is increased [28].
Welding speed: As the welding speed increases the pool flow pattern and size change. At slow welding speeds, the pool is large and wide and may result in dropout. In this case the surface tension is not enough to keep the pool in place and so it drops out of the weld, leaving a hole or depression. At higher welding speeds, the strong flow towards the centre of the weld in the wake of the keyhole has no time to redistribute and is hence frozen as a central ridge and an undercut at the sides of the weld [8]. Focal point: The focal point, which is the active width of the laser beam in touch with the workpiece, can be adjusted by changing either the collimation lens length or the focal lens length. The focal point size and laser power determines the power density and hence the penetration ability [8].
The fiber laser can be more finely focused than the more traditional lasers and hence the penetration for
Laser welding system Welding speed Power Focal point Focal position Absorptivity Bead width Weld depth Weld quality W av elen gth B ea m q ualit y
Chapter 2 – Literature review
Focal position: The focal point positioning distance is the distance between the focal point and the workpiece surface. Negative values for focal point positioning means positioning of laser beam focal plane below the workpiece surface and positive values means positioning of laser beam focal plane above the workpiece surface [24], as can be seen in Figure 2.15.
Changing the focal position leads to a variation on the power density which affect the weld geometry. As positive focal point positioning increases or negative focal point positioning decreases, the beam power density decreases. However, positive and negative focal point positioning doesn't affect equally the power density.
Absorptivity: The efficiency of LBW depends on the absorption of light energy by the workpiece. Any heat transfer calculation for laser processing is based on the energy absorbed by the workpiece.
Owing to the high absorptivity within the “keyhole” there is little operational difference when welding
with long or short wavelengths. When welding with a conduction-limited weld, the surface reflectivity becomes paramount and the lower reflectivity with the shorter wavelengths gives a distinct advantage [8]. This differences are illustrated in Figure 2.16.
Chapter 2 – Literature review
However, there is another factor affecting absorption and that is the plasma formed owing to the very hot gases coming from the keyhole. The plasma will have three effects: the electrons in the plasma are free to absorb photons and hence the plasma is going to block the beam depending upon the electron density, i.e., the temperature; the hot plasma will cause density changes and hence changes in the refractive index, which will disperse the beam; and there will be condensate and particles caught up in the fast-moving plasma, which will have associated scattering effects [8].
The absorption coefficient (αbremm=n2ʎ2T3/2,where n is the gas density, λ is the wavelength and T is the
absolute temperature of the plasma) shows that for shorter wavelengths there will be less absorption and hence cooler and less absorbing plasma [8].
Shroud gas: It is also important to pay attention to the gas shroud, which is necessary for the protection of the molten and control the cooling weld. This gas can affect the formation of plasma, which may block or distort the beam and thus the absorption of the beam into the workpiece [8]. The most common gases used in LBW are listed in Table 2.6.
Table 2.6 - Chemical behaviour and physical proprieties of laser welding gases.
The formation of plasma occurs through the reaction of the hot metal vapours from the keyhole with the shroud gas. If the plasma is near the workpiece surface or in the keyhole, it is beneficial. If, however, the plasma becomes thick or leave the surface, it will block or disperse the beam. Because of this plasma effect it is usual to weld with a side-blown jet to help blow the plasma away. If the shroud gas is slightly reactive with the weld metal, then a thin film of oxide may form which will enhance the optical coupling [8].
2.2.5.
Wobbling LBW
Laser welding
gas
Molecular
weight (g/mol)
Thermal conductivity at
1 bar, 15ºC (W/m∙K)
Ionization
energy (eV)
Density
relative to air
Chapter 2 – Literature review
laser beam welding by superposing an oscillation movement to the feed direction is gaining more and more importance for these hard to weld materials.
The technique of wobble welding influences the temperature field during welding, creating a larger molten pool and minimizing plasma formation [8]. A scan-head is used to rapidly rotate the beam position around its axis along the welding direction using specified amplitude and frequency (Figure 2.17).
This relative movement between the laser beam and the workpiece results from spatial modulation that allows to superpose an oscillation movement to the weld direction [42].
According to [30] spatial modulation can affect the welding process by influencing the keyhole geometry (interface gaseous-liquid), the weld pool geometry (interface liquid-solid) and the temperature gradient in the weld pool. Different weld shapes can be produced, the most common ones are disposed in Figure 2.18. The beam shape can be circular, elliptical, linear or more complex like infinity.
Chapter 2 – Literature review
The path defined by the laser beam depends on the welding speed, rotation amplitude and frequency and vary in time. The resulting path of superposing a circular oscillation can be described by the vectorial relation shown in equation 4.
(𝑥𝑦) = (−𝑎 ∙ cos(2 ∙ 𝜋 ∙ 𝑓 ∙ 𝑡) + 𝑣 ∙ 𝑡 + 𝑎−𝑎 ∙ sin (2 ∙ 𝜋 ∙ 𝑓 ∙ 𝑡) )
The degree of overlap, n, is defined as
𝑛 = 𝑥𝑥𝑚𝑎𝑥,𝑝𝑒𝑟𝑖𝑜𝑑1− 𝑥𝑚𝑖𝑛,𝑝𝑒𝑟𝑖𝑜𝑑2
𝑚𝑎𝑥,𝑝𝑒𝑟𝑖𝑜𝑑1− 𝑥𝑚𝑎𝑥,𝑝𝑒𝑟𝑖𝑜𝑑1
where 𝑥𝑚𝑎𝑥 and 𝑥𝑚𝑖𝑛 are the local maxima and minimum of the laser movement in feed direction and
𝑛 =
√4𝑎2− ( 𝑣
𝜋 ∙ 𝑓)
2
− ( 𝑣2𝜋 ∙ 𝑓) ∙ (3𝜋 + 2 ∙ arcsin (−2𝜋 ∙ 𝑓 ∙ 𝑎))𝑣
√4𝑎2− ( 𝑣
𝜋 ∙ 𝑓)
2
− ( 𝑣2𝜋 ∙ 𝑓) ∙ (𝜋 + 2 ∙ arcsin (−2𝜋 ∙ 𝑓 ∙ 𝑎))𝑣
where 𝑎 is the rotation diameter, 𝑓 is the rotation frequency and 𝑣 is the welding speed [31]. The geometric meaning of this definition is shown in Figure 2.19.
Overall, the wobble technique allows for better temperature control of the part during welding since the
Figure 2.19 – Graphical definition of overlap (v = 50 mm/s; a = 1 mm; f = 1 kHz); a) path in feed direction over time displaying the local extrema; b) path in X and Y direction showing the same local extrema as in a) [31].
a) b)
(4)
Chapter 2 – Literature review
2.2.6.
LBW defects on pure copper
The primary difficulties with LBW of copper are the low absorptivity at 1 μm wavelength and the high
thermal conductivity of copper. Figure 2.20 shows the thermal conductivity and absorptivity as a function of temperature for pure copper.
Due to the high thermal conductivity, the energy input is rapidly dissipated. Therefore, to melt copper, the energy input must be high enough so that the heat losses by conduction can be overcome. The absorption coefficient of copper depends on the temperature which changes abruptly when going through the solid-liquid phase change. A similar behaviour is seen in the thermal conductivity, however with an opposite sign. This means that, when melting, the absorption of laser radiation increases, while the thermal conductivity decreases, leading to a very fast increase of the local material temperature when the input laser power remains constant. Without the right parameters, the process very quickly runs into evaporation of copper at the centre of the spot weld, and, soon afterwards, into an uncontrollable keyhole welding regime [6], where the beam is not absorbed.
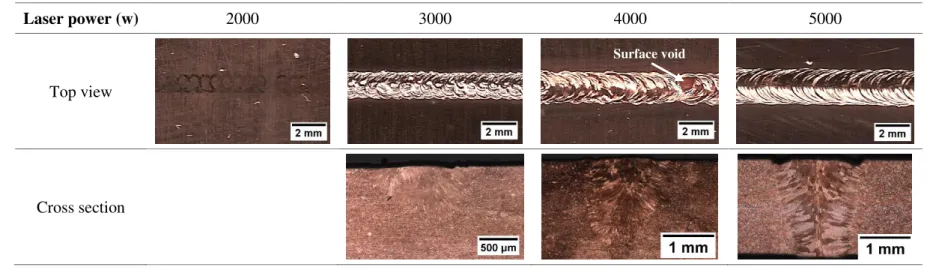
Laser welding of copper materials often results in defective welds. Such weld seams suffer from many ejections and porosity [22, 47]. Also, a strong fluctuation of the penetration depth along the weld seam can often be seen. Figure 2.21 shows the top view and cross section of a laser beam welded copper sample.
Chapter 2 – Literature review
The cause for both pores and melt ejections can be seen in a closure of the keyhole [23]. When the molten metal load based on large volume is larger than the keyhole expansion pressure, at the moment the keyhole shrinks, the porosity can be formed by separating from the bottom of the keyhole [41], as it can be seen in Figure 2.22.
On the other hand, a melt ejection might suddenly occur if the vapour pressure is higher than the closing forces. When the inside pressure of the keyhole exceeds the weld pool load, a keyhole expulsion occurs and molten metal is ejected from the weld pool as a spatter (Figure 2.23). A large void is left on the surface and a new keyhole is formed [41].
Figure 2.21 - Laser beam welded copper sample, Cu-ETP (laser power = 1500 W, welding speed = 50 mm/s, rotation frequency =200 Hz) [42].
Figure 2.22 – Porosity formation [41]. Top view
Cross section Rotation
Chapter 2 – Literature review
2.2.7.
Laser welding of Cu-ETP
As previously mentioned, with the increase use of Cu and the need to join it both in similar and dissimilar joints, several research groups have focused on LBW of copper. Table 2.7 summarizes major developments reported by those groups.
Table 2.7 – Major developments in LBW of pure copper.
Author Year Results and conclusions
Safdar et al. 2007 Investigated the effect of laser beam geometry on temperature distribution, heating/cooling rates and fluid flow.
Petring et al. 2011 Studied the influence of beam power, intensity and material properties on welding depth and seam width versus speed in copper welding.
Heider et al. 2011
Analysed the influence of laser power modulation during welding on weld imperfections. They reported that melt pool ejection for Cu-ETP can be reduced drastically (at 500 Hz) and the penetration depth can be increased by sinusoidal power modulation. They have also shown that the welding process becomes unstable at lower feed rates because of a small angle of the keyhole front wall and that a significantly more regular surface can be seen at the modulated welds.
Hess et al. 2011
Reported that using a combination of 1030 nm and 515 nm wavelength lasers for copper welding enables a deeper weld penetration than using the 1030 nm wavelength laser. The combined laser process also reduced the occurrence of melt pool ejection. Combining laser welding of different wavelengths is effective for avoiding dramatic changes of laser absorption based on the difference of 1 µm laser absorption in liquid and solid copper.
Kraetzsch et al. 2011
Determined that the use of brilliant fiber laser and high-speed scanning head with power modulation allows the welding of Al-Cu without cracking, compared to electron beam.
Heider et al. 2013
Chapter 2 – Literature review
Liebl et al. 2014
Conducted welding experiments using multimode fiber lasers on pure copper, and concluded that the occurrence of melt pool ejection depends on laser power and welding speed: at laser powers over 3 kW, melt pool ejection was suppressed with welding speeds over 8–9 m/min. They described that while for smaller welding velocities melt ejections and melt spatters occur, higher welding velocities produce high quality weld seams without pores visible in the cross sections. They also reported that melt pool ejections are less likely to occur with helium gas than without gas because of changes in the surface tension and in the heat dissipation. With the use of helium, the penetration depth and the cross section decrease, whereas the seam width increases.
Miyagi et al. 2015
Studied the influence of laser power, welding speed and focal point position in LBW of pure copper. They reported that the welding quality improved as the laser power increased in a range between 1000 and 5000 W. Additionally, that the welding quality improved significantly as the welding speed increased over 10 m/min. They concluded that the welding defects decreased significantly at 2 mm focal point position because the welding mode shifted to conduction.
Reisgen et al. 2016
Reported that the process stability (formation of spatter and surface voids) at a welding speed between 0.5 and 2 m/min can be increased by the reduction of the ambient pressure.
Miyagi et al. 2017
Chapter 2 – Literature review
weld surface. The simulations produced confirmed the existence of a direct relationship between oscillatory scanning strategy and three-dimensional shape of the weld seam. The difference in path speed was identified as cause for the varying penetration depth, since locally varying scanning velocities induce different values of line energy. Consistently, the diminishing variation of the penetration depth at increasing degrees of overlap can be interpreted by the decreased difference in path speed that is combined welding speed and rotation diameter and frequency.
2.2.8.
Conclusions
Due to excellent electrical performance and high formability of copper, it is one of the materials most frequently used in electrical engineering and electronics industry. To follow the modern industrial production needs, an automatic and high productive welding technology is required. Fulfilling these requirements, laser beam welding has been implemented in many industrial applications and fields. However, copper high thermal conductivity and low absorptivity makes it hard to obtain high quality laser beam welds. Dissolved oxygen from constitution also represents a limitation in Cu welding leading to porosities difficult to avoid.
Chapter 3 – Experimental procedure
This chapter presents the experimental methodology and characterization techniques to assess the quality of Cu laser welds. The set-up, the main equipment used and the base material are described.
3.1. Material characterization
The base material used on the LBW trials was Cu-ETP (pure copper) with 2 and 2.5 thick. All samples were cut to 100x50 mm in order to avoid different heat transfer conditions due to board effect since copper is a high thermal conductive material.
Tables 3.1 and 3.2 show the chemical composition and the physical and mechanical properties of Cu-ETP.
Table 3.1 - Chemical composition of the base material (material certificate available in annex A1).
Element Cu P Pb S Fe Ni Te As Sb Ag Se
% wt 99.96 0.001 0.005 0.001 0.005 0.005 0.005 0.005 0.005 0.003 0.005
3
C
H
A
P
T
E
R
Chapter 3 – Experimental procedure
Table 3.2 - Physical and mechanical properties of the base material [54].
3.2. Laser System
An IPG YLS 5000 CW Multi Axis System fiber laser with a maximum power of 5 kW was used in all experiments. The laser was available at Burbach, Germany, at IPG Photonics. In the first stage of the experiments, it was used a multimode optical fiber with 100 μm of diameter, 150 mm of collimation, 300 mm of focal length and 200 μm of spot size. In the second stage, it was used a single mode optical fiber with 50 μm of diameter, 150 mm of collimation, 300 mm of focal length and 100 μm of spot size
to comparison purposes. All welding experiments were carried out with the laser beam focused on the material surface. Table 3.3 depicts the characteristics of the laser beam used.
Table 3.3 - Characteristics of the laser.
Optical Set-up IPG FLW-D50 Wobble Head
Set-up Fiber diameter (µm) Collimator (mm) Focal length (mm) Spot size (µm) Focus location
YLS 5000 mm/ IPG Multi Axis System
100
150 300
200
On top
50 100
Properties Copper C101
Crystal structure Face-centered cubic
Density 8.92 g/cm3
Melting point 1083 ºC
Thermal conductivity 391.1 W/m·K Thermal expansion coefficient 16.9x10⁶ K-1
Electrical resistivity 0.0171x10⁻⁶Ω∙m
Yield Tensile Strength 195 MPa Ultimate Tensile Strength 250 MPa Modulus of elasticity 117 GPa
Chapter 3 – Experimental procedure
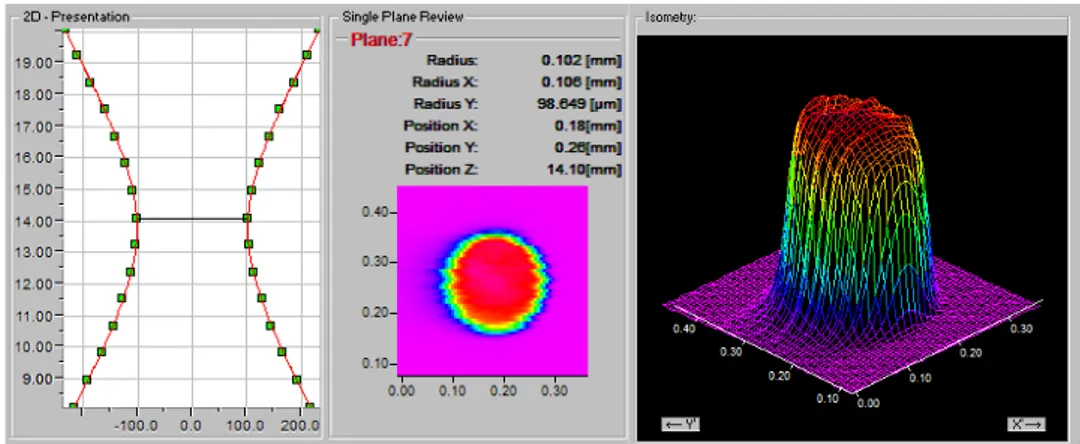
The beam profiles were measured using a PRIMES FocusMonitor FM. They are mostly top hat profiles as shown in Figure 3.1 and in Figure 3.2 for 800 and 1500 W, respectively. The properties of both laser beam fibers are shown in Table 3.4.
Table 3.4 - Beam properties of different optical fibers.
Fiber diameter
(µm) K M
2 BPP
(mm∙mrad)
Rayleigh length (mm)
Divergence angle (mrad)
50 0.18 5.64 1.902 2.091 60.313
100 0.11 9.50 3.206 2.851 67.073
Figure 3.1 - Intensity distribution and beam profile of the fiber laser for 50 mm beam diameter (800 W).
Chapter 3 – Experimental procedure
Figure 3.3 shows the IPG 4-axis workcell used to produce the welds. The work table travels in the X, Y and Z direction and the FLW-D30 Wobble head allows the rotation in the X axis. The tilt angle could be manually set from 0 to 90º.
Shielding device
Collimator
Focal lens Optical fiber
Laser head
Jiging system
Multi axis translation stage
Chapter 3 – Experimental procedure
The welding path is predefined by an IPG program that can be changed using the control equipment shown in Figure 3.4 a). The shielding gas device and its angle in relation to the base material are displayed in Figure 3.4 b). This allows a full protection with a constant gas flow during the entire length of the weld. The flow rate used in all experiments was 35 l/min.
3.3. Fixturing system
To ensure the repeatability, accuracy and interchangeability between all experiments, a jig was designed (drawings are shown in annex A2). It allowed to keep the working piece completely restricted, preventing any movement during the welding process and avoiding plate warping.
Figure 3.5 shows the jig used in all trials. The steel base plate has main two cavities: one to fit the welding plates, which constrain lateral movement, and other to avoid steel contaminations during the welding process for full penetration welds. This base was bolted to the work table by four screws. Vertical movement was constrained by a steel plate bolted to the base plate. The superior plate has a cavity to allow the welding process.
Figure 3.4 - Experimental set-up. a) Control equipment; b) Shielding device and beam angle. 53º
10º
Chapter 3 – Experimental procedure
3.4. Welding tests
To evaluate the effect of major welding parameters on the weld characteristics and soundness and to determine the best window of parameters to obtain a weld penetration of 1.5 mm, a set of trials was run. The welding tests were divided in 3 stages. The preliminary one enabled to identify the effect of shielding gas and tilt angle on the weld penetration and seam aspect. In the second stage, a comprehensive study about the influence of laser power, welding speed, focal point position, rotation diameter, rotation frequency and beam trajectory was performed. Finally, single-mode and multimode fiber lasers were compared. Figure 3.6 illustrates the wobbling laser welding with a circular trajectory.
Figure 3.6 - Wobbling laser beam welding scheme. Figure 3.5 – Jig designed to the experimental trials.
Rotation diameter Rotation direction
Welding direction
Chapter 3 – Experimental procedure
3.4.1. Preliminary experiments
A preliminary study was conducted to assess the influence of the shielding gas and the tilt angle on the weld seam and the weld penetration. For this, a multi-mode optical fiber with 100 μm of diameter was
used. The range of laser parameters tested is shown in Table 3.4. The focal point position, rotation frequency, rotation diameter and beam trajectory were kept constant and these were: focal point position= 0 mm; rotation diameter = 1 mm, rotation frequency = 100 Hz, beam trajectory = circular.
Table 3.4 - Range of laser parameters tested.
Number of trials 18 Tilt angle 0-10º Laser power (W) 2000-5000 Welding speed (m/min) 2-5
3.4.2. Multimode fiber
A multimode optical fiber with 100 μm of diameter was used. Argon was the shielding gas and the tilt laser angle was 10º (to avoid back reflection). The welds were made on 2.5 mm thick plates. In this phase laser power, welding speed, focal point position, rotation frequency, rotation amplitude and beam trajectory were tested to predict their influence on the weld depth. The laser parameters range are displayed in Tables 3.5 to 3.10.
Table 3.5 – Laser parameters used to study the influence of laser power (welding speed = 4 m/min, focal point position = 0, rotation diameter = 1.0 mm, rotation frequency = 100 Hz, beam trajectory = circular).
Table 3.6 - Laser parameters used to study the influence of welding speed (laser power = 4000 W, focal point position = 0, rotation diameter = 1.0 mm, rotation frequency = 100 Hz, beam trajectory = circular).
Weld ref. Laser power (W)
3B 5000
3C 2000
3D 3000
3E 4000
Weld ref. Welding speed (m/min) 4A 2.0
Chapter 3 – Experimental procedure
Table 3.7 - Laser parameters used to study the influence of focal point position (laser power = 4000 W, welding speed = 4 m/min, rotation diameter = 1.0 mm, rotation frequency = 100 Hz, beam trajectory = circular).
Table 3.8 - Laser parameters used to study the influence of rotation diameter (laser power = 4000 W, focal point position = 0, rotation frequency = 100 Hz, beam trajectory = circular).
Table 3.9 - Laser parameters used to study the influence of rotation frequency (laser power = 4000 W, focal point position = 0, rotation diameter = 1.0 mm, beam trajectory = circular).
Weld ref. Focal point position (mm)
5A -2
5B -1
5C 1
5D 2
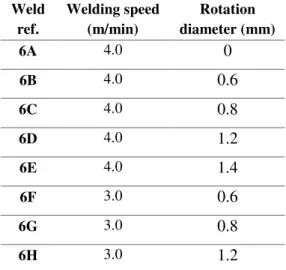
Weld ref. Welding speed (m/min) Rotation diameter (mm) 6A 4.0 0 6B 4.0 0.6 6C 4.0 0.8 6D 4.0 1.2 6E 4.0 1.4 6F 3.0 0.6 6G 3.0 0.8 6H 3.0 1.2
Chapter 3 – Experimental procedure
Table 3.10 - Laser parameters used to study the influence of beam trajectory (laser power = 4000 W, welding speed = 4 m/min; focal point position = 0, rotation diameter = 1.0 mm, rotation frequency = 100 Hz).
3.4.3. Single-mode fiber
The third phase aims to analyse the difference between multimode and single-mode fibers in the welding process. In this set of experiments, a single mode optical fiber with 50 μm of diameter was used. Argon was used as shielding gas and the tilt angle was 10º. The welds were made on 2 mm thick plates. The initial values considered were based on previous knowledge at IPG Photonics. The parameters analysed were laser power, welding speed, rotation diameter and rotation frequency as shown in Table 3.11 and Table 3.12.
Table 3.11 - Laser parameters used to study the influence of laser power and rotation frequency (welding speed = 2.0 m/min, focal point position = 0, rotation diameter = 0.7 mm, beam trajectory = circular).
Table 3.12 - Laser parameters used to study the influence of rotation diameter and rotation frequency (laser power = 3100 W, welding speed = 2.5 m/min, focal point position = 0, beam trajectory = circular).
Weld ref. Beam trajectory
8A Linear |
8B Horizontal infinity ∞
8C Vertical infinity 8
8D Horizontal infinity ∞
8E Vertical infinity 8
Weld ref. Laser power (W)
Rotation frequency (Hz) 10A 2700 500 10B 2700 700 10C 2700 200 10D 2700 300 12A 2500 500 12B 2500 200
Weld ref. Rotation diameter (mm)
Chapter 3 – Experimental procedure
3.5. Characterization techniques
3.5.1.
Visual inspection
Visual inspection was performed to identify uneven weld width, melt ejections, weld penetration and surface and root defects.
3.5.2.
X-Ray inspection
The X-ray inspection was conducted as a non-destructive test to assess the occurrence of internal defects along the weld seam, such as pores. This inspection was performed at ISQ, the Portuguese Welding and Quality Institute with an Andrex CP 160kV unit with a tube voltage of 120 kV and an exposure time of 2.0 mA min.
3.5.3.
Metallographic analysis
Cross sections of all welds were mechanically removed, mounted in resin, mechanically polished and etched with ferric chloride reagent.
Metallographic analysis of the welds was performed using a Leica DMI 5000 M inverted optical microscope. This analysis enabled to identify the different zones of the welds and their extension, the structural modifications in each zone, the grain morphology and size and the existence of internal defects (size and distribution).
3.5.4.
SEM/EDS analysis
A deeper analysis using Scanning Electron Microscope was performed on dedicated samples to identify the solidification structure, pores or inclusions, the grain microstructure and the chemical composition of the base material, the HAZ and the FZ.
Chapter 3 – Experimental procedure
3.5.5.
X-Ray Diffraction analysis
X-Ray Diffraction was performed at DESY facilities (HEMS - High Energy Materials Science beamline) at PETRA III in Hamburg, Germany. It was used a wavelength of 0.1430 Å (87 keV). A 2D detector was used and the tests were held at room temperature (21 °C). The sample to detector distance also varied from 1.04 to 1.41 mm.
This analysis was performed to identify microstructural modifications during the weld.
3.5.6.
Hardness testing
Vickers hardness measurements were performed using a Mitutoyo HM-112 under a load of 2 N. The hardness profile was evaluated on the cross section of the weld along to a horizontal line at mid thickness of the copper plate. The distance between indentations was 250 µm.
These measurements enable to evaluate changes due to thermo-mechanical cycle present in the processed material and heat affected zone (HAZ) and predict mechanical behaviour.
![Figure 2.1 - Grain structure of Cu-ETP containing several annealing twins [1]. a) Microstructure of a wrought tough pitch copper sample heated in hydrogen (300x); b) Microstructure of wrought and](https://thumb-eu.123doks.com/thumbv2/123dok_br/16556491.737396/34.892.279.613.853.1090/figure-structure-containing-annealing-microstructure-wrought-hydrogen-microstructure.webp)
![Figure 2.4 - Thermal conductivity and absorptivity as a function of temperature for copper at a wavelength of 1070 µm [6]](https://thumb-eu.123doks.com/thumbv2/123dok_br/16556491.737396/36.892.162.732.970.1090/figure-thermal-conductivity-absorptivity-function-temperature-copper-wavelength.webp)
![Figure 2.6 – Samples of Cu-ETP [1]. a) Longitudinal section shows equiaxed grains and well-dispersed, slightly elongated Cu 2 O particles (dark dots) (250x); b) Copper cold-rolled bar, annealed and then tungsten arc](https://thumb-eu.123doks.com/thumbv2/123dok_br/16556491.737396/38.892.135.759.110.329/samples-longitudinal-equiaxed-dispersed-slightly-elongated-particles-annealed.webp)


![Figure 2.20 - Thermal conductivity and absorptivity as function of temperature for copper at 1064 µm [6].](https://thumb-eu.123doks.com/thumbv2/123dok_br/16556491.737396/51.892.178.717.264.537/figure-thermal-conductivity-absorptivity-function-temperature-copper-µm.webp)