USING REGRESSION TREE ANALYSIS
Carlos Augusto Zangrando Toneli1, Luis Marcelo Tavares de Carvalho2 (received: July 2, 2009; accepted: May 27, 2011)
ABSTRACT: Sub-pixel analysis is capable of generating continuous fi elds, which represent the spatial variability of certain thematic classes. The aim of this work was to develop numerical models to represent the variability of tree cover and bare surfaces within the study area. This research was conducted in the riparian buffer within a watershed of the São Francisco River in the North of Minas Gerais, Brazil. IKONOS and Landsat TM imagery were used with the GUIDE algorithm to construct the models. The results were two index images derived with regression trees for the entire study area, one representing tree cover and the other representing bare surface. The use of non-parametric and non-linear regression tree models presented satisfactory results to characterize wetland, deciduous and savanna patterns of forest formation.
Key words: Remote sensing, mapping, cerrado.
ESTIMATIVA SUBPIXEL DA COBERTURA ARBÓREA E SUPERFÍCIE EXPOSTA UTILIZANDO ANÁLISE POR ÁRVORE DE REGRESSÃO
RESUMO: A análise subpixel é capaz de gerar campos contínuos que representam a variabilidade intrínseca das classes temáticas. Neste trabalho, objetivou-se desenvolver um modelo numérico para representar a variabilidade de cobertura de dossel e de superfície exposta dentro de cada formação fl orestal. Este estudo foi conduzido em área de amortecimento ao longo da sub-bacia no médio São Francisco em MG, Brasil. Foram usados imagens dos satélites Landsat TM, e IKONOS, e o algoritmo GUIDE para ajustes dos modelos. Os resultados foram duas imagens índices, uma de cobertura arbórea e outra de superfície exposta para toda a área estudada, utilizando o modelo de árvore de regressão. O uso de modelos não-paramétricos e não-lineares por árvore de regressão apresentou resultados satisfatórios na representação de padrões de formações fl orestais aluviais, deciduais e savânicas.
Palavras-chave: Sensoriamento remoto, mapeamento, cerrado.
1Forest Engineer, M.Sc. in Forest Science – Terra Vision Geo – Alameda do Ingá,89 – Vale do Sereno – 34000-974 – Nova Lima, MG, Brasil –
2Forest Engineer, Professor DS in Geoscience and Environment – Departamento de Ciências Florestais/DCF – Universidade Federal de Lavras/UFLA –
Cx. P. 3037 – 37200-000 – Lavras, MG, Brasil – [email protected] a.br
1 INTRODUCTION
Many human applications are concerned with the subdivision of landscapes according to thematic classes of land cover, e.g: urban areas, grassland, forest, water bodies etc. Nevertheless, there is a crescent need to understand the variability of certain aspects of these thematic classes leading to a more complex problem analysis. Land cover represented as continuous fi elds may provide a better framework to understand this variability than the traditional crispy classification schemes.
One approach to soft classifi cation is regression tree analysis (LOH, 2002). Xu et al. (2005) demonstrated that regression tree analysis may be used to produce considerably higher soft classifi cation accuracy when compared to the conventional soft maximum likelihood classifi er and supervised fuzzy c means, especially when the data contain a large proportion of mixed pixels.
One strategy for deriving tree cover density at a spatial resolution of 30 m from high-resolution reference images was developed by Huang et al. (2001). The authors found that regression trees were more robust than multiple linear regression for estimating tree cover density using ETM+ images. Smith (2000) modelled impervious surface cover using regression tree analysis and GIS data to estimate sub-pixels densities.
The density of a certain type of land cover, e.g. forest trees, within a grid of certain spatial resolution might be easily derived by counting the number of pixels representing tree crowns in a co-registered grid of higher spatial resolution that fall within each pixel of the coarser resolution grid.
Goetz et al. (2003) suggested the practical utility of IKONOS imagery, particularly for impervious surface, tree cover, and riparian buffers, all of which are related to stream health. The results of their work provided very specifi c guidelines for predicting stream health ratings, which allows for targeted and adaptive protection and restoration management decision-making.
The present work was motivated by the common assumption that land cover classes are considered internally homogenous. This assumption of internal homogeneity will never be completely true (JONG et al., 2004). Multiscale mapping systems take into account multiresolution imagery, which can be used to estimate the internal spatial variability of land cover classes.
The detection of land cover changes might be improved by the representation of land cover based on continuous fi elds where the surface attributes vary continuously in space and time, at the seasonal and interannual scales. In this case, one needs repetitive and spatially explicit measurements of biophysical surface attributes, such as vegetation cover, biomass, surface moisture etc. (LAMBIN; LINDERMAN, 2006).
Hence, the general objectives of this work were: to use 3 m resolution images as samples to improve soft
classifi cation of 30 m resolution images by regression tree algorithms, to characterize vegetated areas by using indices of tree cover and bare surface within transitions between forest formations.
2 MATERIAL AND METHODS 2.1 Study area
The study area is a riparian buffer of about 5 km from the margins of the São Francisco River in the sub-watershed SF9 illustrated in Figure 1. This area comprised mixtures of different kinds of forest formations: forested wetlands, deciduous forest, savannas and others. 2.2 IKONOS and Landsat TM imagery
The data set used in this comparative study was composed by two IKONOS images from different locations within the study area and one Landsat TM image covering the whole study area.
IKONOS images were available as pan-sharpened to 1 m spatial resolution. This resolution was used to help the recognition and individualization of tree cover by visual interpretation. All images were from September 2006 during leaf-off conditions.
The images were resampled to 3 meters in order to facilitate direct comparison with the Landsat TM, which has 30 m of spatial resolution. Thus, the processing using high-resolution images can be express as on direct percentage of the low-resolution image.
2.3 Strategy
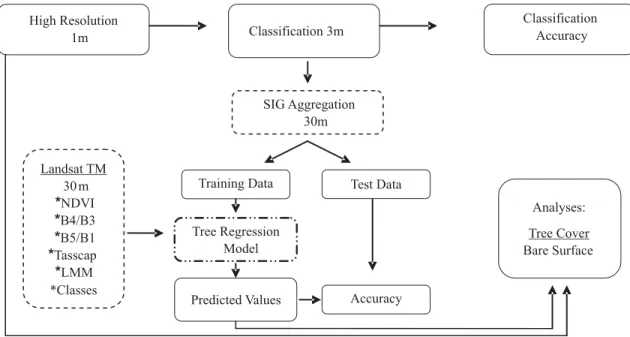
The approach used in this paper for mapping continuous fi elds of tree cover and bare surface variables is outlined in Figure 2.
2.4 Data pre-processing
For this work, the analysis excluded clouds and respective shadows removing them from all data images sets. The Landsat TM image was geometrically corrected according to an orthorectifi ed mosaic reference image from the Minas Gerais State Forest Inventory (SCOLFORO; CARVALHO, 2006) and registered to the UTM projection zone 23, WGS 84 Datum. The IKONOS images were registered to the same coordinate system. The Landsat TM Image was converted to apparent radiance prior to model input according to provided metadata fi les.
In additional, other attributes were derived to compose the multiresolution data set of independent variables for the numerical regression parameterization. It was used the normalized difference vegetation index
(NDVI) and band ratios calculated from the refl ectance values of the Landsat TM image (band 4/band 1) and (band 5/band 1). These indices were added as indicators for discriminating among features in the landscape.
The Linear Mixture Model (LMM) procedure was used to estimate the class proportions of vegetation, water and bare surface within each pixel. Endmembers of the LMM were selected by direct visual interpretation of the IKONOS image. Three indices derived from the Tasseled Cap transformation, brightness, greenness, and wetness, were also used to compose the fi nal data set of independent variables for the decision tree regression algorithm. 2.5 IKONOS and Landsat TM classifi cation
IKONOS images were classifi ed using extensive visual interpretation in three main classes: tree cover, bare surface and others. On the tree cover class, the data comprised trees from native vegetation as well as from planted crops, like banana, mango etc. For bare surface estimation, training data comprised all non-vegetated features, except water. These included urban areas, roads, bare soil, rocks and among others called bare surface.
The Landsat TM image was also classified using the maximum likelihood algorithm according to a reference published project, Minas Gerais State Forest Inventory (SCOLFORO; CARVALHO, 2006).
Figure 2 – Flow charts of the strategy for deriving 30 m tree cover and bare surface data.
2.6 Derivation of model sample areas
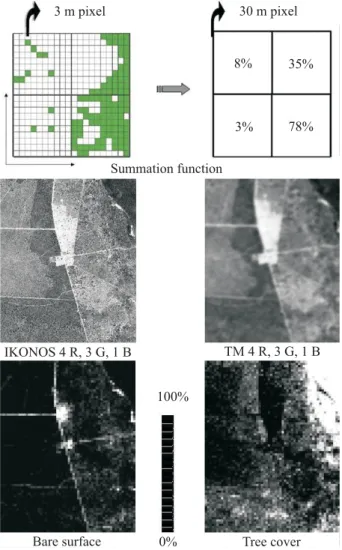
Two continuous images of tree cover and bare surface were derived for the areas covered by IKONOS classifi cation images illustrated in Figure 3. This was achieved by simply counting the number of high resolution pixels (3 m) of tree cover and bare surface occurring in every medium resolution pixel (30 m).
These estimates of tree cover and bare surface data derived from the IKONOS classification image were diveded into 11 strata (0%, 1-10%, 11-20%... up to 91-100%). Random samples were collect in each stratum to be used as training and testing data for the regression tree algorithm.
2.7 Regression tree algorithm
A regression tree is a piecewise constant or piecewise linear estimate of a regression function, constructed by recursively portioning the data and sample space. Initially, the entire training sample is used to determine the structure of the tree. At each stage, the binary split partition that minimizes the total sum of the squared errors (SSE) is selected. The splitting process is then applied to each of the new branches. The process continues until each node reaches a user specifi ed minimum node size (i.e. number of training samples at the node) and becomes a terminal node (XU et al., 2005).
The current study used a regression tree algorithm called GUIDE, developed by Loh (2002) and implemented in the IDL programming language. This algorithm controls bias by employing a chi-square analysis of residuals and a bootstrap calibration of signifi cance probabilities. This approach allows fast computation speed, natural extension to data sets with categorical variables, and direct detection of local two-variable interactions.
3 RESULTS AND DISCUSSION 3.1 Classifi cation of IKONOS Imagery
The fi nal IKONOS classifi cations were compared to the independent test data and accuracies were calculated from a confusion matrix. This comparison showed that global accuracy was 92.4% and the Kappa Index was 0.86. The producer and user accuracies are presented in Table 1. Table 1 – Producer’s and user’s errors derived from confusion matrix with global accuracy equal to 92.40% and Kappa index equal to 0.86 concerning the IKONOS image.
Tabela 1 –Erros do produtor e do usuário derivados de matriz de confusão com acurácia global de 92,40% e indice Kappa de 0,86 relativos à imagem IKONOS.
Classes Producer´s Acc. % User Acc.%
Tree Cover 90.94 95.99
Bare surface 88.1 84.73
Others 94.36 92.11
Figura 3 – Derivation of tree cover and bare surface images. Figure 3 – Derivação das imagens de cobertura arbórea e superfície exposta.
3.2 Classifi cation of the Landsat TM image
study area (Table 2). This fact could be explaining by the complex landscape structure characterized by different classes found in the area.
dataset were used to assess the accuracy of model results. The correlation result between predicted and reference values were 72.56% of global accuracies for tree cover model and 68.78% for bare surface model.
These results showed that estimates of tree cover presented better results than those obtained for bare surface. This trend was probably caused by the more complex spatial patterns observed for bare surfaces. 3.4 Patterns of tree cover and bare surface for different vegetation types
Figure 4 illustrates the usefulness of information about the spatial variability within crisp classifi cation results. For example, the tree cover and bare surface indices may represent particularities of different physiognomy formations.
As expected, grassland areas presented lower values of tree cover 25.9% and higher values of bare surface 46.26%. Note that in the case of Deciduous Forest 2 it was verifi ed a decrease in tree cover from 36.46 to 30.24% and an increase in bare surface from 5.50 to 19.35% when compared to Deciduous Forest probably due to a higher degree of disturbance in the former. Savanna formations presented the higher deviation of tree cover, 17.43%, probably because of the variation in vertical structure. On the other hand, forest wetlands showed low density of bare surface 4.99% due to the dense tree Table 2 – Producer’s and user’s errors derived from confusion
matrix with global accuracy equal to 75.80% and Kappa index equal to 0.71 concerning the Landsat image.
Tabela 2 –Erros do produtor e do usuário derivados de matriz de confusão com acurácia global de 75,80% e indice Kappa de 0,71 relativos à imagem Landsat
Classes Producer´s Acc % User Acc.%
Deciduous Forest 54.97 88.68
Deciduous Forest 2 85.64 55.56
Mixed Formation 45.24 76
Water 96.63 98.85
Grassland 82.35 81.67
Forested Wetland 72.56 83.8
Savanna 75 64.71
Agricultural 86.27 100
Figura 4 – Spatial variability within crisp classifi cation. Figure 4 – Variabilidade espacial dentro de temáticas. 3.3 Model calibration and evaluation
cover of this physiognomy. Mixed formations, which are characterized by savanna patches within deciduous forest areas, presented high values of tree cover and low variation of bare surface. Finally, agricultural areas presented the lowest deviation of tree cover due to the control of spacing between plants.
4 CONCLUSION
This study proposed the estimation of tree cover and bare surface indices combining IKONOS and Landsat TM imagery. These indices provided important parameters to characterize the internal variability of each mapped class in the riparian buffer area of our study site. The method could be further improved by incorporating independent variables derived from multitemporal imagery, especially within areas of pronounced seasonality. Finally, this approach might be useful as a complement to studies concerning the health of rivers and associated riparian areas.
5 REFERENCES
GOETZ, S. J.; WRIGHT, R. K.; SMITH, A. J.; ZINECKER, E.; SCHAUB, E. IKONOS imagery for resource management: tree cover, impervious surface, and riparian buffer analyses in the mid-Atlantic region. Remote Sensing of Environment, New York, v. 88, p. 195-208, 2003.
HANSEN, M. C.; DEFRIES, R. S.; TOWNSHEND, J. R. G.; SOHLBERG, R.; DIMICELI, C.; CARROLL, M. Towards on operational MODIS continuous fi el of percent tree cover algorithm: exaple using AVHRR and MODIS data. Remote Sensing of Environment, New York, v. 83, p. 303-319, 2002.
HUANG, C.; YANG, L.; WYLIE, B.; HOMER, C. A strategy for estimating tree canopy density using landsat 7 ETM+ and high resolution images over large areas. In: CONFERENCE ON GEOSPATIAL INFORMATION IN AGRICULTURE AND FORESTRY HELD IN DENVER, 2001, Colorado. Proceedings... Sioux Falls: Raytheon, 2001. CD-ROM.
JONG, S. M.; PEBESMA, E. J.; MEER, F. D. van der. Spatial variability, mapping methods, image analysis and pixel. In: STEVEN, M.; JONG, M.; FREEK, D. van der. Remote sensing image analysis: including the spatial domain. Boca Raton: CRC, 2004. p. 17-35.
LAMBIN, E. F.; LINDERMAN, M. Time series of remote sensing data for land change science. IEEE Transaction on Geoscience and Remote Sensing, New York, v. 44, n. 7, 2006. Special issue.
LOH, W. Y. Regression trees with unbiased variable selection and interaction detection. Statistica Sinica, Madison, v. 12, p. 361-386, 2002.
SCOLFORO, J. R. S.; CARVALHO, L. M. T. Mapeamento e inventário da fl ora nativa e refl orestamentos de Minas Gerais. Lavras: UFLA, 2006. 288 p.
SMITH, A. J. Subpixel estimation of impervious surface cover using landsat TM imagery. College Park: University of Maryland, 2000. 28 p.