CLINICAL SCIENCE
Prediction of large esophageal varices in
cirrhotic patients using classification and
regression tree analysis
Wan-dong Hong,I Le-mei Dong,IZen-cai Jiang,IIQi-huai Zhu,I Shu-Qing JinI
IDepartment of Gastroenterology and Hepatology, the First Affiliated Hospital of Wenzhou Medical College, Wenzhou, China.IIDepartment of General
Surgery, The Second Affiliated Hospital of Wenzhou Medical College, Wenzhou, China.
OBJECTIVES: Recent guidelines recommend that all cirrhotic patients should undergo endoscopic screening for esophageal varices. That identifying cirrhotic patients with esophageal varices by noninvasive predictors would allow for the restriction of the performance of endoscopy to patients with a high risk of having varices. This study aimed to develop a decision model based on classification and regression tree analysis for the prediction of large esophageal varices in cirrhotic patients.
METHODS:309 cirrhotic patients (training sample, 187 patients; test sample 122 patients) were included. Within the training sample, the classification and regression tree analysis was used to identify predictors and prediction model of large esophageal varices. The prediction model was then further evaluated in the test sample and different Child-Pugh classes.
RESULTS: The prevalence of large esophageal varices in cirrhotic patients was 50.8%. A tree model that was consisted of spleen width, portal vein diameter and prothrombin time was developed by classification and regression tree analysis achieved a diagnostic accuracy of 84% for prediction of large esophageal varices. When reconstructed into two groups, the rate of varices was 83.2% for high-risk group and 15.2% for low-risk group. Accuracy of the tree model was maintained in the test sample and different Child-Pugh classes.
CONCLUSIONS:A decision tree model that consists of spleen width, portal vein diameter and prothrombin time may be useful for prediction of large esophageal varices in cirrhotic patients.
KEYWORDS: Classification and regression tree analysis; Tree model; Esophageal varices; Predictor; Cirrhosis.
Hong WD, Dong L, Jiang Z, Zhu Q, Jin SQ. Prediction of large esophageal varices in cirrhotic patients using classification and regression tree analysis. Clinics. 2011;66(1):119-124.
Received for publication onAugust 7, 2010;First review completed onSeptember 17, 2010;Accepted for publication onOctober 24, 2010
E-mail: [email protected]
Tel.: 8613868465258
INTRODUCTION
Variceal hemorrhage is a leading cause of morbidity and mortality in cirrhosis.1Primary prophylaxis with nonselec-tive beta-blockers and endoscopic band ligation may reduce the risk of variceal bleeding.2Therefore, it is recommended that patients with cirrhosis should undergo endoscopic screening for esophageal varices (EV) at the time of diag-nosis.3 If no varices are observed on initial endoscopy in patients with compensated cirrhosis, endoscopy should be repeated in 3 years; in decompensated cirrhotic patients, it should be repeated annually.3As a result of the cost and invasive nature of endoscopic screening, there is interest in developing a noninvasive predictor of the presence and development of varices that would decrease the
number of endoscopies performed.1Predicting the presence
of esophageal varices by non-invasive means would restrict the performance of endoscopy to those patients with a high probability of having varices. A number of studies have addressed the issue of identifying patients with varices by non-invasive means with the aim of avoiding endoscopy in those at low risk of having varices.4-7 Several prediction models such as combination of platelet count and Child-Pugh class,8platelet count and splenomegaly,9,10and spleen
width and portal vein diameter11 were also investigated. However, different studies performed in cirrhotic patients have yielded different results.1,5,12 This may be owing to differences in the population selection or the proportion of different etiologies of cirrhosis.
The classification and regression tree (CART) analysis is a nonparametric method based on binary recursive partition-ing of data. The results of CART analysis are presented as a decision tree that is intuitive and facilitates the allocation of patients into subgroups by following the flow-chart form that is simple to interpret and may be applied at the bedside. CART has been shown to be competitive with other
traditional statistical techniques such as logistic regression analysis.13To the best of our knowledge, CART analysis has
not been used up until now in the assessment of predictors of large esophageal varices (LEV) in cirrhotic patients without a history of variceal bleeding. It is well known that LEV have a significantly higher risk of bleeding than small varices.14 It is presumed that a certain combination of factors yields a more effective prediction of outcome than when factors are used singly. The aim of the present study was to use CART analysis to develop a simple tree model for predicting the presence of LEV in cirrhotic patients.
MATERIALS AND METHODS
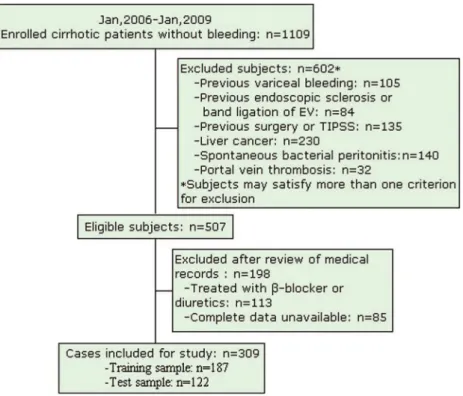
Cirrhotic patients who presented at our hospital between January 2006 and January 2009 were eligible, irrespective of the etiology and stage of live disease. Exclusion criteria included: previous variceal bleeding; previous endoscopic sclerosis or band ligation of EV; previous surgery for portal hypertension or transjugular intrahepatic porto-systemic stent shunt placement. None of the patients were treated with b-blockers or diuretics. Hepatocellular carcinoma, spontaneous bacterial peritonitis or portal vein thrombosis were excluded from the study.
Age, gender and biochemical parameters were recorded. All patients underwent ultrasonographic examination of the upper abdomen, including measurement of spleen width and portal vein diameter.15 The presence and degree of ascites and encephalopathy were assessed according to Child-Pugh criteria.16 The presence and size of EV were determined and recorded for each patient. The size of varices was subdivided into two classes – small and large – according to the criteria proposed at the Baveno I Consensus Conference.17Diuretics therapy was not commenced before endoscopy and ultrasonography was performed. The study
protocol was approved by the Ethics Committee of the First Affiliated Hospital of Wenzhou Medical College.
A Shapiro-Wilk test was used to evaluate whether the continuous data was normal distribution. According to the results of Shapiro-Wilk test, continuous values were expressed as mean¡SD or median and interquartile range
and compared using Student’s t-test or the Mann-Whitney non-parametric test. Categorical values were described by count and proportions and compared by the chi-square test. Study participants were randomly assigned to the training and test sample (training sample, 60%; test sample, 40%) using a computer random number generator.
The CART analysis was carried out on the training sample in order to establish a simple tree model for prediction of LEV. Impurity function (Gini criterion func-tion) was used for splitting.18 By stopping rule, maximum tree depth is 3 levels, and the case number of parent node and child node is 25 and 1 each. Cut-off points for continuous and ordinal variables were generated automa-tically by the model based on statistical cost assumptions.13 Overall sensitivity, specificity, negative predictive value, positive predictive value and diagnostic accuracy of the tree model generated by CART analysis in the training sample were validated in the test sample.
Differences were considered to be statistically significant if the two-tailed p value was,0.05.
RESULTS
Baseline Characteristics in the Entire Study Population
A total of 309 patients (training sample, 187 patients; test sample, 122 patients) were included in the study (Figure 1). Of those, 207(67%) were male and their median age was 54(range: 45-61) years. The demographic and clinical
characteristics of the patients are presented in Table 1. In all the patients, the most common cause of cirrhosis was hepatitis B virus (56%). The majority of the patients were Child-Pugh class A (37.9%) and B (41.7%). Ascites was found in 31.4% of the patients by ultrasonography and clinical examination. EV were present in 199 patients (64.4%), and LEV in 157 patients (50.8%).
Univariate analysis revealed that Gamma-glutamyltrans-ferase (c- GT), prothrombin time, platelet count, ascites, portal vein diameter and spleen width were significantly associated with the presence of LEV. Results are summa-rized in Table 2.
The CART Analysis on the Training Sample
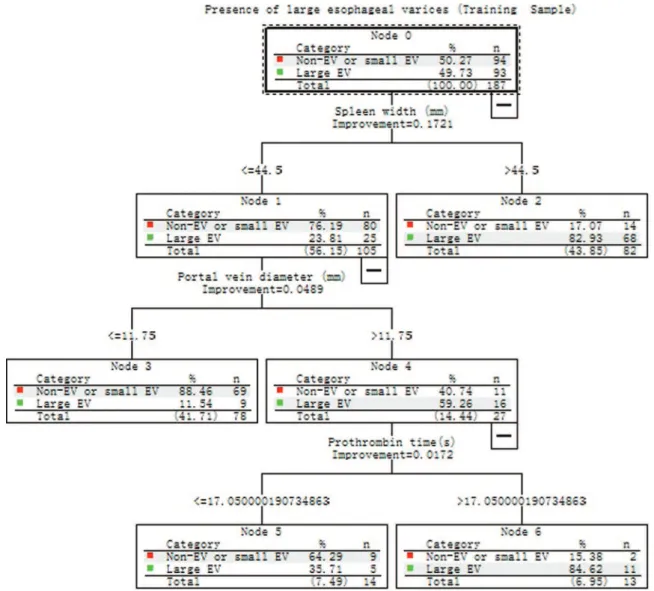
The CART analysis was carried out on the training set of 187 patients using the same variables as univariate analysis. Figure 2 shows the resulting decision tree. The CART
analysis automatically selected three predictive variables to produce a total of four terminal nodes. All three factors selected as significant variables in the CART analysis were also significantly associated with LEV by univariate analysis (Table 2). The cut-off values were 44.5 mm, 11.75 mm and 17.05s for spleen width, portal vein diameter and pro-thrombin time in the model, respectively. The four terminal nodes were reconstructed into two groups according to the possibility of the presence of LEV (P,0.001): a low-risk group consisted of node 3 (spleen width#44.5 mm, portal vein diameter#11.75 mm) and node 5 (spleen width#44.5 mm, portal vein diameter.11.75 mm, pro-thrombin time#17.05s), whose possibility of presence of LEV was 15.2% (14/92); a high-risk group consisted of node 2 (spleen width.44.5 mm) and node 6 (spleen width#44.5 mm, portal vein diameter.11.75 mm, and prothrombin time.17.05s), whose possibility of presence of LEV was 83.2% (79/95).
Diagnostic values of various predictors in the tree model are shown in Table 3. With a combination of three variables together, sequentially, the tree model yielded a diagnostic accuracy of 84.0%.
Validation of the CART Analysis on the Test Sample
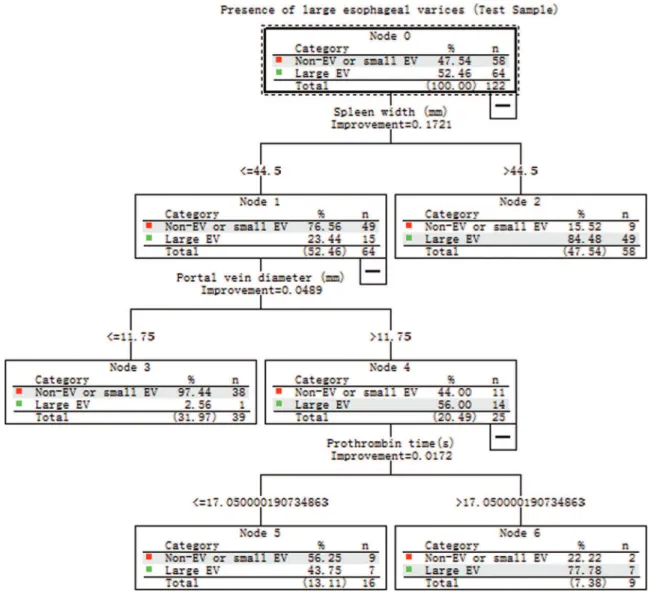
CART analysis was carried out on the randomly selected test sample (n = 122; Figure 3). The tree model achieved a sensitivity and specificity of 87.5 % and 81%, respectively. Assuming LEV prevalence of 52.5% in this population, the positive and negative predictive values from the test sample were 83.6% and 85.5%, respectively. The percentage of patients correctly classified was 84.4%. As shown in Figure 4, 2 groups of patients divided by CART analysis still had similar low (8/55, 14.5%) and high (56/67, 83.4%) prob-ability of presence of LEV(P,0.001).
Validation According to Child-Pugh Class in the Entire Study Population
Table 4 shows the diagnostic performance of the tree model in the various Child-Pugh classes. The diagnostic accuracy of the tree model was 84.6% in Child-Pugh class A
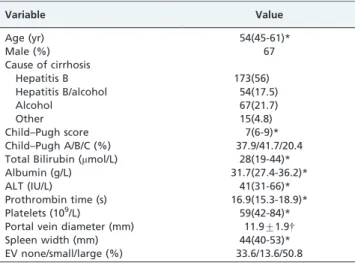
Table 1 -Demographic and clinical characteristics of 309 patients.
Variable Value
Age (yr) 54(45-61)*
Male (%) 67
Cause of cirrhosis
Hepatitis B 173(56)
Hepatitis B/alcohol 54(17.5)
Alcohol 67(21.7)
Other 15(4.8)
Child–Pugh score 7(6-9)*
Child–Pugh A/B/C (%) 37.9/41.7/20.4
Total Bilirubin (mmol/L) 28(19-44)*
Albumin (g/L) 31.7(27.4-36.2)*
ALT (IU/L) 41(31-66)*
Prothrombin time (s) 16.9(15.3-18.9)*
Platelets (109/L) 59(42-84)*
Portal vein diameter (mm) 11.9¡1.9{
Spleen width (mm) 44(40-53)*
EV none/small/large (%) 33.6/13.6/50.8
*Data are shown as median and interquartile range;
{Data are shown as mean
¡SD
Table 2 -Univariate analysis of predictive factors of large esophageal varices in 309 patients.
Variable Patients with no or small varices N = 152 Patients with large varices N = 157 P
Age (yr) 54.5(44-61.5) 54(47-61) 0.89*
Male (%) 67.8 66.2 0.78{
Child–Pugh score 7(6-9) 8(6-9) 0.06*
Total Bilirubin (mmol/L) 26.5(17-41.5) 30(20-44) 0.12*
Total protein (g/L) 65(60-68.9) 64(59.7-69.1) 0.12*
Albumin (g/L) 32.6(26.8-36.8) 30.8(27.5-35.8) 0.33*
ALT (U/L) 41(31-73) 42(30-61) 0.50*
AST (U/L) 63(38-99) 64(44-86) 0.87*
Alkaline phosphatase (U/L) 112(78-167) 105(80-138) 0.22*
c- GT (U/L) 80(42-179.5) 64(36-132) 0.047*
Prothrombin time(s) 16.6(15-18.9) 17.1(15.7-18.9) 0.04*
Prothrombin activity (%) 64.3(53-79.5) 62(52-71) 0.05*
Platelets (109/L) 75(51.5-110) 49(36-65)
,0.001*
Ascites (N) 0.028{
None 115 97
Non-tense 17 31
Tense 20 29
Portal vein diameter (mm) 10.9¡1.7 12.9¡1.6 ,0.001&
Spleen width (mm) 41(40-43) 50(44-59) ,0.001*
*Mann-Whitney non-parametric test;{chi-square test; & Student’s t-test; ALT = alanine aminotransferase; AST = aspartate aminotransferase;
patients, 83.7% in Child-Pugh class B patients and 85.7% in Child-Pugh class C patients.
DISCUSSION
Splenomegaly is recognized as one of the diagnostic signs of cirrhosis and portal hypertension. Several studies have reported that splenomegaly could be a good predictor of LEV for cirrhotic patients.9,10,14Our previous study showed
that spleen width measured by ultrasonography was an independent predictor for the presence of EV,11whereas the relationship between spleen width and LEV has not been investigated before. The present study indicated that spleen width was the strongest factor for prediction of LEV. Using a cut-off of 44.5 mm, spleen width achieved a sensitivity of 73.1% and specificity of 85.1%.
EV is the direct consequence of the spontaneous formation of collateral vessels between the portal vein and esophageal veins via the left gastric or short gastric veins. Therefore, the presence or absence of EV can reflect severity of portal hypertension. It had been reported that portal vein diameter was an independent predictor for the presence of varices.5,19 However, few data are available about the relationship between portal vein diameter and LEV. Our data showed that portal vein diameter was the second most important predictor for LEV in patients with a spleen width of
#44.5 mm. However, it did not play an important role in predicting LEV in patients with spleen width of.44.5 mm. When the spleen width and portal vein diameter were combined sequentially (Table 3), 81.8% of patients could be correctly classified. However, the specificity (73.4%) and positive predictive value (77.1%) were low, which means that
Figure 2 -A tree model for prediction of large esophageal varices (LEV) generated by classification and regression tree (CART) analysis in the training set of 187 patients.
Table 3 -Diagnostic values of various predictors in the tree model.
Variable Se (%) Sp (%) PPV (%) NPV (%) DA (%)
SW (.44.5 mm) 73.1 85.1 82.9 76.2 79.1
PVD (.11.75 mm) 64.0 86.3 59.3 88.5 80.95
PT (.17.05s) 68.8 81.8 84.6 64.3 74.1
SW, PVD combined 90.3 73.4 77.1 88.5 81.8
SW, PVD, PT combined
84.9 82.98 83.2 84.8 84.0
some of the patients with splenomegaly and dilated portal vein may not have LEV. One possible explanation for this result could be the development of spontaneous intra-abdominal shunts (such as paraumbilical vein or another shunts) that decrease the blood flow of varices while maintaining congestive splenomegaly and dilated portal vein. Prothrombin time is considered a marker of hepatocel-lular dysfunction. As portal hypertension is a consequence, in part, of the generalized vasodilation and the hyperdy-namic splanchnic and systemic circulatory state, the degree of hepatic function likely affects the development of por-tal hypertension via humoral factors and, therefore, the
Figure 3 -Validation in the test set of the tree model obtained by classification and regression tree (CART) analysis from the training set.
Figure 4 -Patients stratified by the tree model in training sample and test sample.
Table 4 -Diagnostic values of the tree model according to Child-Pugh class.
Child-Pugh Se (%) Sp (%) PPV (%) NPV (%) DA (%)
Class A 82.4 86.4 82.4 86.4 84.6
Class B 92.5 74.2 79.5 90.2 83.7
Class C 92.3 75.0 85.7 85.7 85.7
development of varices. Moreover, the degree of liver fibrosis is related to liver function and fibrosis can directly affect portal hypertension. It has been reported that serum fibrosis markers can detect LEV with a high accuracy,20
though several studies showed prothrombin time was associated with LEV on univariate analysis.4,14Most studies suggested that it was not a predictor for EV.4,14,21,22 Our data indicated that prothrombin time could be a predicator for LEV in selected patients with a spleen width of#44.5 mm and a portal vein diameter of.11.75 mm.
Not all factors selected as significant variables on the univariate analysis were significantly associated with LEV by CART analysis. As withc- GT and platelets, ascites were not selected as significant variables in CART analysis. These differences may indicate both the unique feature and the
limitations of the CART analysis.18 The unique feature is that it could visualize significant predictors that specifically apply to selected patients. The limitation is that not all significant factors may be adopted in the decision tree as we applied the rule to stop the CART procedure when the sample size was below 25. This rule was applied to avoid the generation of an over-fit model, which may lack universality. Therefore, it is possible that platelet count or ascites may become a significant variable in the CART analysis if larger number of patients were included.
The tree model that consisted of more than three parameters markedly improved sensitivity. It yielded a sensitivity of 84.9 % which was higher that that of single parameter and had an excellent specificity of 82.98% in the training sample. Eight-four percent of patients were correctly classified. Patients may be divided into a high-risk group (83.2%) and low-high-risk group (15.2%) according to the possibility of presence of LEV by CART analysis. This suggests that patients with a spleen width .44.5 mm or those with a spleen width of#44.5 mm, with a portal vein diameter of.11.75 mm and a prothrombin time of.17.05s would benefit from more frequent endoscopies. However, endoscopies could be postponed in patients with a spleen width of#44.5 mm, a portal vein diameter of#11.75 mm, or in patients with a spleen width of#44.5 mm, a portal vein diameter .11.75 mm and a prothrombin time of #17.05s. Moreover, the tree model proved to be well calibrated (predicted outcomes in the training sample were repro-duced fairly in the test sample) and achieved a comparable diagnostic accuracy of 84.4% in the test sample. Patients in the test sample can also be organized into the high- (83.4%) and low-risk (14.5%) groups (Figure 4). Furthermore, the diagnostic accuracies of the tree model in the various Child-Pugh classes were comparable. The intuitive nature of the tree model allows an easy assessment of the risk of the presence of LEV without the need for complex calculations. Our study has several limitations. Data were collected retrospectively, which may produce a population bias as confirmed by the fact that the prevalence of LEV in our series was higher that that in other studies,9,14which may be due, in part, to selected bias. In addition, the sample size of this study was small. Therefore, a large prospective study is mandatory.
CONCLUSIONS
We propose that a tree model based on CART analysis may help clinicians identify patients who would most likely benefit from referral for screening for LEV.
CONFLICTS OF INTEREST
The authors declare that they have no potential conflicts of interest.
REFERENCES
1. Qamar AA, Grace ND, Groszmann RJ, Garcia-Tsao G, Bosch J, Burroughs AK, et al. Platelet count is not a predictor of the presence or development of gastroesophageal varices in cirrhosis. Hepatology. 2008;47:153-9, doi: 10.1002/hep.21941.
2. Gluud LL, Klingenberg S, Nikolova D, Gluud C. Banding ligation versus beta-blockers as primary prophylaxis in esophageal varices: systematic review of randomized trials. Am J Gastroenterol. 2007;102:2842-8. 3. Garcia-Tsao G, Sanyal AJ, Grace ND, Carey W. Prevention and
management of gastroesophageal varices and variceal hemorrhage in cirrhosis. Hepatology. 2007;46:922-38, doi: 10.1002/hep.21907. 4. Ng FH, Wong SY, Loo CK, Lam KM, Lai CW, Cheng CS. Prediction of
oesophagogastric varices in patients with liver cirrhosis. J Gastroenterol Hepatol. 1999;14:785-90, doi: 10.1046/j.1440-1746.1999.01949.x. 5. Schepis F, Camma C, Niceforo D, Magnano A, Pallio S, Cinquegrani M,
et al. Which patients with cirrhosis should undergo endoscopic screening for esophageal varices detection? Hepatology 2001;33:333-8, doi: 10. 1053/jhep.2001.21410.
6. D’Amico G, Morabito A. Noninvasive markers of esophageal varices: another round, not the last. Hepatology. 2004;39:30-4, doi: 10.1002/hep.20018. 7. de Franchis R. Noninvasive diagnosis of esophageal varices: is it
feasible? Am J Gastroenterol. 2006;101:2520-2.
8. Burton JR, Jr., Liangpunsakul S, Lapidus J, Giannini E, Chalasani N, Zaman A. Validation of a multivariate model predicting presence and size of varices. J Clin Gastroenterol. 2007;41:609-15, doi: 10.1097/01.mcg. 0000225669.84099.04.
9. Chalasani N, Imperiale TF, Ismail A, Sood G, Carey M, Wilcox CM, et al. Predictors of large esophageal varices in patients with cirrhosis. Am J Gastroenterol. 1999;94:3285-91.
10. Sharma SK, Aggarwal R. Prediction of large esophageal varices in patients with cirrhosis of the liver using clinical, laboratory and imaging parameters. J Gastroenterol Hepatol. 2007;22:1909-15, doi: 10.1111/j. 1440-1746.2006.04501.x.
11. Hong WD, Zhu QH, Huang ZM, Chen XR, Jiang ZC, Xu SH, et al. Predictors of esophageal varices in patients with HBV-related cirrhosis: a retrospective study. BMC Gastroenterol. 2009;9:11, doi: 10.1186/1471-230X-9-11.
12. Fagundes ED, Ferreira AR, Roquete ML, Penna FJ, Goulart EM, Figueiredo Filho PP, et al. Clinical and laboratory predictors of esophageal varices in children and adolescents with portal hypertension syndrome. J Pediatr Gastroenterol Nutr. 2008;46:178-83, doi: 10.1097/ MPG.0b013e318156ff07.
13. Augustin S, Muntaner L, Altamirano JT, Gonzalez A, Saperas E, Dot J, et al. Predicting early mortality after acute variceal hemorrhage based on classification and regression tree analysis. Clin Gastroenterol Hepatol. 2009;7:1347-54, doi: 10.1016/j.cgh.2009.08.011.
14. Madhotra R, Mulcahy HE, Willner I, Reuben A. Prediction of esophageal varices in patients with cirrhosis. J Clin Gastroenterol. 2002;34:81-5, doi: 10.1097/00004836-200201000-00016.
15. Lamb PM, Lund A, Kanagasabay RR, Martin A, Webb JA, Reznek RH. Spleen size: how well do linear ultrasound measurements correlate with three-dimensional CT volume assessments? Br J Radiol. 2002;75:573-7. 16. Pugh RN, Murray-Lyon IM, Dawson JL, Pietroni MC, Williams R.
Transection of the oesophagus for bleeding oesophageal varices. Br J Surg. 1973;60:646-9.
17. de Franchis R, Pascal JP, Ancona E, Burroughs AK, Henderson M, Fleig W, et al. Definitions, methodology and therapeutic strategies in portal hypertension. A Consensus Development Workshop, Baveno, Lake Maggiore, Italy, April 5 and 6, 1990. J Hepatol 1992;15:256-61. 18. Kurosaki M, Matsunaga K, Hirayama I, Tanaka T, Sato M, Yasui Y, et al.
A predictive model of response to peginterferon ribavirin in chronic hepatitis C using classification and regression tree analysis. Hepatology Res. 2010;40:251-260, doi: 10.1111/j.1872-034X.2009.00607.x.
19. Sarwar S, Khan AA, Alam A, Butt AK, Shafqat F, Malik K, et al. Non-endoscopic prediction of presence of esophageal varices in cirrhosis. J Coll Physicians Surg Pak 2005;15:528-31.
20. Vanbiervliet G, Barjoan-Marine E, Anty R, Piche T, Hastier P, Rakotoarisoa C, et al. Serum fibrosis markers can detect large oesophageal varices with a high accuracy. Eur J Gastroenterol Hepatol 2005;17:333-8, doi: 10.1097/00042737-200503000-00012.
21. Thomopoulos KC, Labropoulou-Karatza C, Mimidis KP, Katsakoulis EC, Iconomou G, Nikolopoulou VN. Non-invasive predictors of the presence of large oesophageal varices in patients with cirrhosis. Dig Liver Dis 2003;35:473-8, doi: 10.1016/S1590-8658(03)00219-6.