Abstract: Phyllochron and leaf appearance rate are both important parameters in the production efficiency of agricultural crops. The objectives of this study were to determine the phyllochron and leaf appearance rate in 4 oat cultivars (Avena sativa L.) in 3 sowing dates and verify the variability of phyllochron and leaf appearance rate among cultivars and sowing dates. The experimental design was the completely randomized with 12 treatments and 20 repetitions. Treatments were formed by the combination of 4 cultivars (URS Charrua, URS Taura, URS Estampa, and URS Corona) and 3 sowing dates in 2014 (April 28, May 28, and July 14). In each plant (repetition) of each treatment, the number of expanded leaves (NEL) was counted 3 times per week from the first leaf emission until flowering. For each plant, cultivar, and sowing date, linear regression was adjusted between NEL and
Crop produCtion And MAnAgeMent - Article
Phyllochron and leaf appearance rate in oat
Gabriela Görgen Chaves, Alberto Cargnelutti Filho*, Bruna Mendonça Alves, André Lavezo, Cleiton Antonio Wartha, Daniela Barbieri Uliana, Rafael Vieira Pezzini, Jéssica Andiara Kleinpaul, Ismael Mario Márcio Neu
Universidade Federal de Santa Maria - Departamento de Fitotecnia - Santa Maria (RS), Brazil.
*Corresponding author: [email protected]
Received: Mar. 25, 2016 – Accepted: June 7, 2016
accumulated thermal time (ATT) and between NEL and number of days after emergence (DAE). Phyllochron was determined by the inverse of the angular coefficient of the linear regression between the NEL and ATT. The leaf appearance rate was determined by the inverse of the angular coefficient of the linear regression between NEL and DAE. In oat, there is variability of phyllochron and leaf appearance rate among cultivars and sowing dates. Phyllochron oscillates between 95.88 and 117.70 °C day∙leaf−1 and leaf appearance rate, between
6.41 and 9.65 days∙leaf−1. The oat cropping management in function
of phyllochron and leaf appearance rate is dependent on cultivars and sowing dates.
introduCtion
The oat (Avena sativa L.) belongs to the Poaceae family (Cronquist 1988). It is a grass with double purpose, i.e. grain and forage production, being used for human consumption and animal feed. It is also an alternative to the crop rotation system (CBPA 2014). Oat is extremely important among the winter cereals in Brazil, being the fifth most cultivated cereal (IBGE 2014). In the 2015 growing season, from the total cultivated area with oat in Brazil, the State of Rio Grande do Sul was the greatest grower, contributing with 217,900 t in an area of 118,400 ha, corresponding to 62.0% of production and 62.5% of the cultivated area (CONAB 2016).
Oat presents adaptability and its multipurpose gives important contribution of this species to the sustainability of many agricultural production systems. Therefore, it is essential to understand the crop ecophysiology for the proper management. Characterization of oat plants development is important to identify crop responses to distinct environmental stimuli during its productive cycle (Castro et al. 2012).
The air temperature is the main weather factor that influences plant development (Streck 2002; Gramig and Stoltenberg 2007). Phyllochron represents the accumulated thermal time, in °C day, required for the successive leaves appearance in a culm or stem, having as unit °C day∙leaf−1 (Hermes et al. 2001; Xue et al. 2004). Another important plant development parameter is the leaf appearance rate (LAR), which is the number of days required for the emission of 1 leaf (Xue et al. 2004). The LAR is used to obtain models of growth and yield of agricultural crops (Streck et al. 2003). Phyllochron and leaf appearance rate are both important parameters in the production efficiency of agricultural crops and have been used in ecophysiological studies in plants.
The assessment of phyllochron and leaf appearance rate in cultivars and sowing dates is important to verify the adaptation, recommendation, and proper crop management. Studies to determine the phyllochron were performed for crops, such as sorghum (Clerget et al. 2008), brachiaria (Santos et al. 2009), maize (Streck et al. 2009; Martins et al. 2012), wheat (Rosa et al. 2009; Mohamed et al. 2013; Pržulj and Momčilović 2013), and strawberry (Rosa et al. 2011; Mendonça et al. 2012). Researches for determination of leaf appearance rate were carried out for the crops brachiaria (Santos et al. 2009; Paciullo et al. 2008), maize (Streck et al. 2010), and wheat (Mohamed et al. 2013).
Studies to determine phyllochron and leaf appearance rate in cultivars and sowing dates for the oat crop were not found in the literature. Thus, the objectives of this study were to determine the phyllochron and leaf appearance rate in 4 oat cultivars in 3 sowing dates and verify the variability of phyllochron and leaf appearance rate among cultivars and sowing dates.
MAteriAL And MetHodS
The experiment with the oat crop (Avena sativa L.) was carried out in the experimental area of 90 × 60 m (5,400 m2) located at lat 29°42′S, 53°49′W and 95 m of altitude, in the agricultural year of 2014. According to Köppen climate classification, the climate is Cfa, subtropical humid, with warm summers and without defined dry season (Heldwein et al. 2009). The type of soil is classified as “Argissolo Vermelho distrófico arênico” (Santos et al. 2013).
The experimental design was the completely randomized with 12 treatments in a factorial arrangement with 20 repetitions. The treatments were formed by the combination of 4 cultivars (URS Charrua, URS Taura, URS Estampa, and URS Corona) and 3 sowing dates (April 28, May 28, and July 14). The utilized sowing dates are within the period indicated in the oat agro-climatic zoning for the southern region of Brazil (Castro et al. 2012). A basic fertilization was broadcasted utilizing the N-P-K commercial formulation in the 05-20-20 proportion, totaling 21 kg∙ha−1 of N, 88 kg∙ha−1 of P2O5, and 88 kg∙ha−1 of K
2O. Posteriorly, topdressing fertilization of 45 kg∙ha−1 of N was performed on May 13 and June 17, June 17 and July 14, August 5 and August 28 for sowing performed on April 28, May 28, and July 14, respectively.
Seedling emergence was determined by daily counting of the number of visible plants above the ground level, considering the emergence when 50% of the seedlings were visible. Emergence dates were May 4, June 5, and July 20 for the sowing dates of April 28, May 28, and July 14, respectively. After emergence, the number of expanded leaves (NEL) with visible ligule was counted in each plant (repetition) of each treatment. Therefore, 240 plants were evaluated, i.e. 20 plants (repetitions) by treatment in 12 treatments. Counts were performed 3 times a week until the plant flowering.
the air in °C, rainfall in mm, incident global solar radiation in kJ∙m−2∙day−1, and photoperiod in h were recorded in the Weather Station, belonging to the 8th Meteorology District of the National Meteorological Institute, located 40 m from the experimental area. The climate normals of the experimental area were obtained from the National Institute of Meteorology (INMET) website, originated by the base date from 1961 – 1990. Daily mean temperature (Tm) of the air, in °C, was calculated by the equation:
repetition (plant). Also, linear regression of the NEL in function of the number of days after emergence (DAE) was adjusted. Phyllochron, in °C day∙leaf−1, was determined by the inverse of the angular coefficient of the linear regression between the NEL and the ATT (Klepper et al. 1982; Baker and Reddy 2001). The leaf appearance rate, in days∙leaf−1, was determined by the inverse of the angular coefficient of the linear regression between the NEL and the DAE.
Data of phyllochron and leaf appearance rate were submitted to analysis of variance, and the comparison of means was performed by the Scott-Knott test at 5% of probability. Statistical analyzes were performed using Microsoft® Office Excel application and SISVAR software (Ferreira 2014).
reSuLtS And diSCuSSion
The air temperature during the leaf emission period (emergence to flowering) of oat presented variability in all sowing dates, with an upward trend in average temperatures towards the flowering period (Figure 1a). In this period, the lowest minimum temperature recorded was −0.2 °C on June 20 and August 14 and the highest maximum temperature recorded was 33.2 °C on August 23 and September 9. The
Tm = (Tmin + Tmax)/2
The daily thermal time (DTT, in °C day) was calculated according to Arnold (1960):
DTT = (Tm − Tb) × 1 day
where: Tb is the base temperature for leaf emission. The base temperature utilized was 3.0 °C (Yusoff et al. 2012). The accumulated thermal time (ATT, in °C day) from the plant emergence date was obtained accumulating the values of DTT.
Linear regression of the NEL in function of the ATT was adjusted for each cultivar in each sowing date, in each
Figure 1. Daily minimum, mean, and maximum temperature of air in °C, rainfall in mm (a) and incident global solar radiation in kJ∙m−2∙day−1 and
photoperiod in hours (b), corresponding to the period in which the experiment was carried out with oat (Avena sativa L.) in the agricultural
year of 2014. Data from the Weather Station, belonging to the 8th Meteorology District of the National Meteorological Institute.
0 20 40 60 80 100 120 140 0 5 10 15 20 25 30 35 R ainf all (mm) Temper atur e (°C ) Rainfall Mean temperature Maximum temperature Minimum temperature 0 2 4 6 8 10 12 14 16 0 5000 10000 15000 20000 25000 April 2 8 Ma y 5 Ma y 1 2 Ma y 1 9 Ma y 2 6
June 2 June 9 June 1
6
June 2
3
June 3
0
July 7 July 1
4 July 2 1 July 2 8 A ug 4 A ug 1 1 A ug 1 8 A ug 2 5
Sep 1 Sep 8 Sep 1
5 Sep 2 2 Sep 2 9 O ct 6 April 2 8 Ma y 5 Ma y 1 2 Ma y 1 9 Ma y 2 6
June 2 June 9 June 1
6
June 2
3
June 3
0
July 7 July 1
4 July 2 1 July 2 8 A ug 4 A ug 1 1 A ug 1 8 A ug 2 5
Sep 1 Sep 8 Sep 1
average of Tm of air was of 16.01, 16.45, and 17.62 °C for the sowing dates of April 28, May 28, and July 14, respectively (Figure 1a). Therefore, it can be inferred that there was an increase in the average of Tm, during the period of emergence to flowering for each sowing dates, with delaying in sowing date. This behavior is expected and can be explained by the increase in the day length and perpendicularity of the incident solar rays. The Tm was greater than the oat base temperature (Tb = 3.0 °C) in all sowing dates. This means that there was thermal time accumulation in every day.
The lowest value of daily Tmin of air for 3 sowing dates was −0.2 °C, and the total number of days with Tmin of air below Tb of 3.0 °C were 5 for the sowing date of April 28, 5 for the sowing date of May 28, and 3 for the sowing date of July 14. It is possible that these extreme minimum
temperatures occurred during some periods of the day may have limited the plant development.
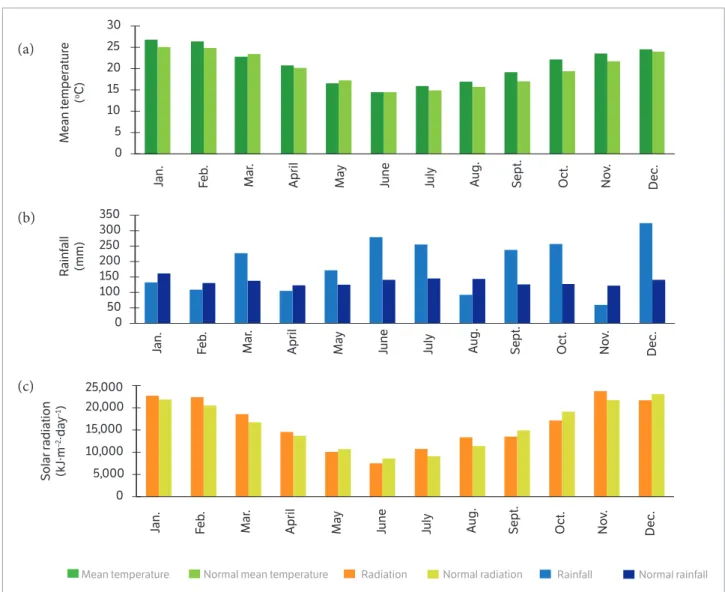
Rainfall during the leaf emission period (emergence to flowering) was 820, 769, and 532 mm for sowing dates of April 28, May 28, and July 14, respectively (Figure 1a). In general, these rainfalls were well distributed during the evaluation period. However, rainfall during the evaluation period was greater than the climate normals in the months of May, June, July, September, and October and lower in months of April and August (Figure 2b). The average incident global solar radiation during the leaf emission period (emergence to flowering) was 11,105, 12,106, and 14,519 kJ∙m−²∙dia−1 for the sowing dates of April 28, May 28, and July 14, respectively (Figure 1b). These results suggest reduction in the phyllochron and leaf appearance rate with the delay of sowing date, as discussed
Figure 2. Mean temperature in °C (a), rainfall in mm (b), and incident global solar radiation in kJ∙m−2∙day−1 (c), corresponding to the year of
2014 and the climate normals of the local during the period of 1961 – 1990. Data from the Meteorological Station of the Federal University of Santa Maria, State of Rio Grande do Sul (Source: INMET Network Data).
0 5 10 15 20 25 30
Jan. Fe
b
.
Mar
.
April May June July Aug. Sept. Oct. No
v.
Dec.
Jan. Fe
b
.
Mar
.
April May June July Aug. Sept. Oct. No
v.
Dec.
Jan. Fe
b
.
Mar
.
April May June July Aug. Sept. Oct. No
v.
Dec.
Me
an t
emper
atur
e
(
oC)
Mean temperature Normal mean temperature
0 50 100 150 200 250 300 350
R
ainf
all
(mm)
0 5,000 10,000 15,000 20,000 25,000
Solar r
adiation
(kJ∙m
–2∙da
y
–1)
Radiation Normal radiation Rainfall Normal rainfall
(a)
(b)
in Martins et al. (2012). The overall incident global solar radiation values during the leaf emission period (emergence to flowering) oscillated in relation to the climate normals of the local (Figure 2b). Extremes of incident global solar radiation occurred in the months of June and August, with values of 13.42% lower and 18.18% greater than the normal incident global solar radiation, respectively (Figure 2c). In general, the mean temperature of air, rainfall, and incident global solar radiation data during the leaf emission period (emergence to flowering) were similar to the climatological normal of the local in 2014 (Figures 2a,b,c).
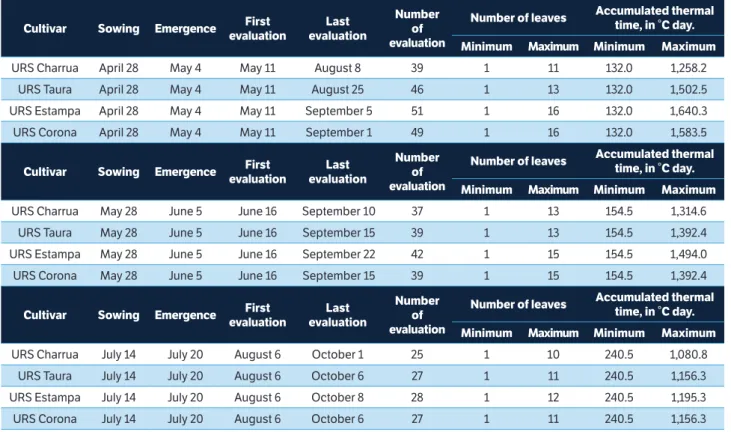
The period between sowing and emergence of the 4 cultivars in sowing dates of April 28, May 28, and July 14 was 6, 8, and 6 days, respectively (Table 1). The number of evaluations and the number of leaves oscillated among cultivars and sowing dates. The number of evaluations among cultivars ranged from 39 to 51 on the sowing date of April 28, from 37 to 42 on the sowing date of May 28, and from 25 to 28 on the sowing date of July 14. The number of leaves varied among cultivars, with values from 11 to 16 on the sowing date of April 28, from 13 to 15 on the sowing date of May 28, and from 10 to 12 on the sowing date of July 14. In the 3
sowing dates, more leaf number evaluation were carried out and greater number of leaves were observed in the cultivar URS Estampa. Moreover, lower number of evaluations and fewer numbers of leaves were observed in the cultivar URS Charrua. The other cultivars (URS Taura and URS Corona) were in the intermediate situation.
Overall, there was a decrease in the number of evaluations and the number of leaves with the delay of sowing date for the 4 cultivars (Table 1). Thus, it can be inferred that the oscillation of the number of evaluations and the number of leaves of cultivars among the sowing date can be explained by the growing cycle duration. As observed in Figure 1b, the average incident global solar radiation was greater on the sowing date of July 14. In this late date (July 14), there was an increase in the day length duration and higher photoperiod; consequently, cultivars presented smaller growing cycle. Similar results were found by Streck et al. (2006), in a study of the development cycle duration of rice cultivars.
In general, the cultivars behavior regarding to the maximum ATT was independent of sowing date (Table 1). The greatest ATT was observed in cultivar URS Estampa and the lowest in cultivar URS Charrua, wherein the other
Cultivar Sowing emergence First
evaluation
Last evaluation
number of evaluation
number of leaves Accumulated thermal
time, in °C day.
Minimum Maximum Minimum Maximum
URS Charrua April 28 May 4 May 11 August 8 39 1 11 132.0 1,258.2 URS Taura April 28 May 4 May 11 August 25 46 1 13 132.0 1,502.5 URS Estampa April 28 May 4 May 11 September 5 51 1 16 132.0 1,640.3 URS Corona April 28 May 4 May 11 September 1 49 1 16 132.0 1,583.5
Cultivar Sowing emergence First
evaluation
Last evaluation
number of evaluation
number of leaves Accumulated thermal
time, in °C day.
Minimum Maximum Minimum Maximum
URS Charrua May 28 June 5 June 16 September 10 37 1 13 154.5 1,314.6 URS Taura May 28 June 5 June 16 September 15 39 1 13 154.5 1,392.4 URS Estampa May 28 June 5 June 16 September 22 42 1 15 154.5 1,494.0 URS Corona May 28 June 5 June 16 September 15 39 1 15 154.5 1,392.4
Cultivar Sowing emergence First
evaluation
Last evaluation
number of evaluation
number of leaves Accumulated thermal
time, in °C day.
Minimum Maximum Minimum Maximum
URS Charrua July 14 July 20 August 6 October 1 25 1 10 240.5 1,080.8 URS Taura July 14 July 20 August 6 October 6 27 1 11 240.5 1,156.3 URS Estampa July 14 July 20 August 6 October 8 28 1 12 240.5 1,195.3 URS Corona July 14 July 20 August 6 October 6 27 1 11 240.5 1,156.3
cultivars presented intermediate ATT. Overall, there was a reduction in ATT of cultivars with delayed sowing date. This fact may occur in response to increased photoperiod, with longer days and shorter nights, as shown in Figure 1b. Moreover, Locatelli et al. (2008) observed that some genotypes can respond to photoperiod.
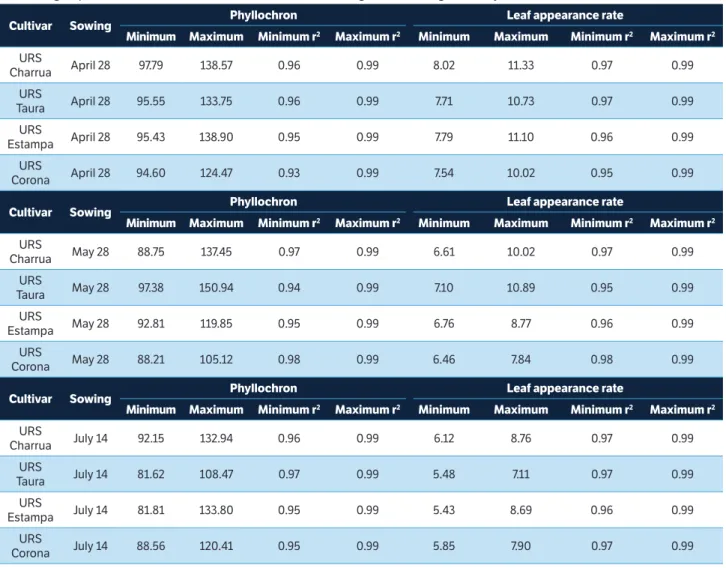
The phyllochron estimates ranged from 94.60 to 138.90 °C day∙leaf−1; 88.21 to 150.94 °C day∙leaf−1, and 81.62 to133.80 °C day∙leaf−1 on sowing dates of April 28, May 28, and July 14, respectively (Table 2). In a study performed by Martins et al. (2012) assessing the phyllochron in maize hybrids in 3 agricultural years, variations were also found, from 34.4 to 40.2 °C day∙leaf−1 in the agricultural year of 2007/2008, 37.7 to 43.1 °C day∙leaf−1 in the agricultural year of 2008/2009, and 39.2 to 44.3 °C day∙leaf−1 in the agricultural year of 2009/2010. The oat phyllochron values obtained in
this study are greater than the maize phyllochron values obtained by Martins et al. (2012). This can be explained by the differences between crops, being maize a summer cereal and oat a winter cereal and also due to differences in the crop cycle duration. Furthermore, different phyllochron values with oscillations were found in a research carried out in Finland during 1989 and 1990 by Peltonen-Sainio and Rajala (2007). These authors examined the development of 14 cultivars and 6 inbreed lines of oat and estimated the phyllochron with fluctuations from 68 to 87 °C day∙leaf−1. These distinct values can be obtained from analysis of different cultivars and environments. For all cultivars and sowing dates, the relation between the NEL and ATT was linear with high coefficients of determination (r2 ≥ 0.93), indicating that the phyllochron estimation by the method of linear regression between NEL and ATT is appropriate (Streck et al. 2005).
Cultivar Sowing phyllochron Leaf appearance rate
Minimum Maximum Minimum r2 Maximum r2 Minimum Maximum Minimum r2 Maximum r2
URS
Charrua April 28 97.79 138.57 0.96 0.99 8.02 11.33 0.97 0.99 URS
Taura April 28 95.55 133.75 0.96 0.99 7.71 10.73 0.97 0.99 URS
Estampa April 28 95.43 138.90 0.95 0.99 7.79 11.10 0.96 0.99 URS
Corona April 28 94.60 124.47 0.93 0.99 7.54 10.02 0.95 0.99
Cultivar Sowing phyllochron Leaf appearance rate
Minimum Maximum Minimum r2 Maximum r2 Minimum Maximum Minimum r2 Maximum r2
URS
Charrua May 28 88.75 137.45 0.97 0.99 6.61 10.02 0.97 0.99 URS
Taura May 28 97.38 150.94 0.94 0.99 7.10 10.89 0.95 0.99 URS
Estampa May 28 92.81 119.85 0.95 0.99 6.76 8.77 0.96 0.99 URS
Corona May 28 88.21 105.12 0.98 0.99 6.46 7.84 0.98 0.99
Cultivar Sowing phyllochron Leaf appearance rate
Minimum Maximum Minimum r2 Maximum r2 Minimum Maximum Minimum r2 Maximum r2
URS
Charrua July 14 92.15 132.94 0.96 0.99 6.12 8.76 0.97 0.99 URS
Taura July 14 81.62 108.47 0.97 0.99 5.48 7.11 0.97 0.99 URS
Estampa July 14 81.81 133.80 0.95 0.99 5.43 8.69 0.96 0.99 URS
Corona July 14 88.56 120.41 0.95 0.99 5.85 7.90 0.97 0.99
table 2. Minimum and maximum values of phyllochron (°C day∙leaf−1), coefficient of determination (r2) of the linear regression to estimate
the phyllochron, leaf appearance rate (days∙leaf−1), and coefficient of determination (r2) of the linear regression to estimate leaf appearance
The LAR ranged from 7.54 to 11.33 days∙leaf−1, from 6.46 to 10.89 days∙leaf−1, and from 5.43 to 8.76 days∙leaf−1 on sowing dates of April 28, May 28, and July 14, respectively (Table 2). LAR oscillations were also observed by Streck et al. (2010). The authors simulated the leaf appearance in a maize variety in 7 sowing dates in 2 agricultural years and obtained values from 1.60 to 2.21 days∙leaf−1. The relation between the NEL and the number of DAE was linear for all cultivars and sowing dates, with coefficients of determination (r2) greater than 0.95 for the estimate of LAR.
Analysis of variance resulted in significant effect of the interaction cultivar × sowing dates for phyllochron and LAR. Thus, the analysis was unfolded within each factor (Table 3). On the sowing date of April 28, phyllochron was statistically greater for the cultivars URS Charrua, URS Taura, and URS Estampa and lowest for the cultivar URS Corona, ranging from 117.70 °C day∙leaf−1 and 103.63 °C day∙leaf−1. On the sowing date of May 28, phyllochron was greater for the cultivars URS Charrua (116.09 °C day∙leaf−1) and URS Taura (117.26 °C day∙leaf−1), intermediate for cultivar URS Estampa (103.60 °C day∙leaf−1), and lowest for cultivar URS Corona (95.88 °C day∙leaf−1). On the sowing date of July 14, the cultivar URS Charrua (111.09 °C day∙leaf−1) differed from the others with the
greatest phyllochron value (Table 3). Phyllochron variability among cultivars was also verified by Clerget et al. (2008) and Rosa et al. (2009) in wheat and by Pržulj and Momčilović (2013) in barley. Furthermore, in assessing the phyllochron in strawberry, Rosa et al. (2011) and Mendonça et al. (2012) observed differences among cultivars. According to these authors, different results among cultivars are due to genetic differences. Therefore, the management of these cultivars tends to be differentiated due to the occurrence of variability in leaf development. Moreover, the grower may establish cropping planning of each cultivar with the number of leaves forecast model.
Phyllochron of the cultivars URS Charrua and URS Corona did not differ between the 3 sowing dates. The cultivar URS Taura, on the sowing date of July 14, differed from the other sowing dates presenting the lowest phyllochron (96.29 °C day∙leaf−1), and the cultivar URS Estampa, on the sowing date of April 28, presented the greatest phyllochron value (114.94 °C day∙leaf−1) differing from the other seasons (Table 3). This phyllochron variability among sowing dates was found in maize by Streck et al. (2009) and also by Clerget et al. (2008) and Rosa et al. (2009), both in wheat.
Smaller phyllochron values on sowing date of July 14 can be attributed to increased photoperiod, with longer days and shorter nights, observed at this date (Figure 1b), which may have resulted in the fastest vegetative development. Similar results were obtained by Baldissera et al. (2014), analyzing the phyllochron in forage grasses. The authors stated that grasses growing under the canopy of trees have greater phyllochron than plants growing in full sun.
The leaf appearance rate estimates differed among cultivars. In the sowing date of April 28, the cultivar URS Corona differed from the others by presenting the lowest LAR value (8.35 days∙leaf−1). Cultivars URS Charrua and URS Taura did not differ, with the greatest LAR values of 8.57 days∙leaf−1 and 8.69 days∙leaf−1, respectively, on the sowing date of May 28, differing from the other cultivars. Whereas, on the sowing date of July 14, the cultivar URS Charrua obtained greater LAR value (7.37 days∙leaf−1), differing from the other cultivars (Table 3). Moreover, studies performed by Santos et al. (2009) with brachiaria and Mohamed et al. (2013) with wheat found differences among cultivars for the LAR estimation, corroborating the results observed in this study. According to Santos et al. (2009), these variations in the LAR estimation among cultivars can be attributed to physiological differences. *Means not followed by the same upper letter in line (sowing date comparison
within cultivar) and lower case in column (cultivars comparison within sowing date) differ by the Scott-Knott test at 5% probability.
table 3. Phyllochron (°C day∙leaf-1) and leaf appearance rate
(days∙leaf-1) of 20 plants of each oat (Avena sativa L.) cultivar and
sowing date in the agricultural year of 2014.
Cultivar
Sowing date
April 28 May 28 July 14
phyllochron (°C day∙leaf−1)
URS Charrua 117.70 Aa* 116.09 Aa 111.09 Aa
URS Taura 117.10 Aa 117.26 Aa 96.29 Bb URS Estampa 114.94 Aa 103.60 Bb 101.20 Bb
URS Corona 103.63 Ab 95.88 Ac 99.02 Ab
Coefficient of variation = 9.64%
Cultivar
Sowing date
April 28 May 28 July 14
Leaf appearance rate (days∙leaf−1)
URS Charrua 9.65 Aa* 8.57 Ba 7.37 Ca
URS Taura 9.45 Aa 8.69 Ba 6.41 Cb URS Estampa 9.16 Aa 7.56 Bb 6.65 Cb URS Corona 8.36 Ab 7.11 Bb 6.54 Cb
The LAR obtained for the cultivars URS Charrua, URS Taura, URS Estampa, and URS Corona were greater on the sowing date of April 28, lower on the sowing date of July 14, and intermediate on the sowing date of May 28 (Table 3). Thus, it can be inferred that there was gradual reduction in the time required for the appearance of 1 leaf with the delay of sowing date. LAR variability was also observed among wheat (Mohamed et al. 2013) and sorghum (Clerget et al. 2008) sowing dates and among seasons of the year with brachiaria (Paciullo et al. 2008). Therefore, leaf development of cultivars is accelerated with sowing date delay. However, late sowings have a smaller total leaf number. Thus, paying attention to the cropping purpose is necessary to select the sowing date and cultivar.
Overall, there was variability in phyllochron and LAR among cultivars and sowing dates. These differences of phyllochron and LAR observed among cultivars can result from their genetic and physiological differences. Moreover, the differences in phyllochron and LAR among sowing dates can be the result of environmental conditions, mainly the photoperiod. Therefore, it is suggested to considerer cultivar
and sowing date in the utilization of phyllochron and leaf appearance rate values in future researches.
ConCLuSion
There is variability of phyllochron and leaf appearance rate among cultivars and sowing dates. Phyllochron oscillates between 95.88 and 117.70 °C day∙leaf−1 and leaf appearance rate between 6.41 and 9.65 days ∙leaf−1. The oat cropping management in function of phyllochron and leaf appearance rate is dependent on cultivars and sowing dates.
ACKnoWLedgeMentS
We thank the Brazilian National Council for Scientific and Technological Development (CNPq), the Coordination for the Improvement of Higher Education Personnel (CAPES), and the Rio Grande do Sul Research Foundation (FAPERGS) for granting scholarships.
Arnold, C. Y. (1960). Maximum-minimum temperature as a basis
for computing heat units. Proceedings of the American Society
for Horticultural Science, 76, 682-692.
Baker, J. T. and Reddy, V. R. (2001). Temperature effects on
phenological development and yield of muskmelon. Annals of
Botany, 87, 605-613. http://dx.doi.org/10.1006/anbo.2001.1381.
Baldissera, T. C., Pontes, L. S., Barro, R. S., Giostri, A. F., Guera, K. C.
S., Michetti, M., Silva, V. P. and Carvalho, P. C. F. (2014). Phyllochron
and leaf lifespan of four C4 forage grasses cultivated in association
with trees. Tropical Grasslands, 2, 12-14.
Castro, G. S. A., Costa, C. H. M. and Ferrari Neto, J. (2012).
Ecophysiology of oats. Scientia Agraria Paranaensis, 11, 1-15.
Clerget, B., Dingkuhn M., Goze, E., Rattunde H. F. W. and Ney B.
(2008). Variability of phyllochron, plastochron and rate of increase
in height in photoperiod-sensitive sorghum varieties. Annals of
Botany, 101, 579-594. http://dx.doi.org/10.1093/aob/mcm327.
Comissão Brasileira de Pesquisa de Aveia, Fundação ABC (2014).
Indicações técnicas para a cultura da aveia (grãos e forrageira).
Passo Fundo: UPF.
reFerenCeS
Companhia Nacional de Abastecimento (2016). Acompanhamento
da safra brasileira de grãos, v. 4. Safra 2015/2016. Quarto
levantamento; [accessed 2016 Nov 15]. http://www.conab.gov.
br/OlalaCMS/uploads/arquivos/16_01_12_14_17_16_boletim_
graos_janeiro_2016.pdf
Cronquist, A. (1988). The evolution and classification of flowering
plants. 2. ed. Lawrence: Allen Press.
Ferreira, D. F. (2014). SISVAR: a guide for its bootstrap procedures
in multiple comparisons. Ciência e Agrotecnologia, 38, 109-112.
Gramig, G. G. and Stoltenberg, D. E. (2007). Leaf appearance
base temperature and phyllochron for common grass and broad
leaf weed species. Weed Technology, 21, 249-254. http://dx.doi.
org/10.1614/WT-06-039.1.
Heldwein, A. B., Buriol, G. A. and Streck, N. A. (2009). O clima de
Santa Maria. Ciência e Ambiente, 38, 43-58.
Hermes, C. C., Medeiros, S. L. P., Manfron, P. A., Caron, B.; Pommer,
S. F. and Bianchi, C. (2001). Emission of leaf of lettuce in relation to
Instituto Brasileiro de Geografia e Estatística (2014). Levantamento
sistemático da produção agrícola. Rio de Janeiro: IBGE.
Klepper, B., Rickman, R. W. and Peterson, C. M. (1982). Quantitative characterization of vegetative development in small cereal grains. Agronomy Journal, 74, 789-792. http://dx.doi.org/10.2134/agronj1 982.00021962007400050005x.
Locatelli, A. B., Federizzi, L. C., Milach, S. C. K. and McElroy, A.
R. (2008). Flowering time in oat: genotype characterization for photoperiod and vernalization response. Field Crops Research, 106, 242-247. http://dx.doi.org/10.1016/j.fcr.2007.12.006.
Martins, J. D., Carlesso, R., Petry, M. T., Knies, A. E., Oliveira, Z. B. and Broetto, T. (2012). Estimating the phyllocron in maize hybrids
with different cycles of vegetative development. Ciência Rural, 42, 777-783. http://dx.doi.org/10.1590/S0103-84782012000500003.
Mendonça, H. F. C., Calvete, E. O., Nienow, A. A., Costa, R. C., Zerbielli, L. and Bonafé, M. (2012). Phyllochron estimation in intercropped strawberry and monocrop systems in a protected
environment. Revista Brasileira de Fruticultura, 34, 15-23. http://dx.doi.org/10.1590/S0100-29452012000100005.
Mohamed, A., Abd, E., Ashraf, A. and Abd, E. (2013). Predicting the effect of temperature on leaf appearance in seven spring bread wheat genotypes. World Essays Journal, 1, 137-141.
Paciullo, D. S. C., Campos, N. R., Gomide, C. A. M., Castro, C. R. T., Tavela, R. C. and Rossiello, R. O. P. (2008). Growth of signalgrass
influenced by shading levels and season of the year. Pesquisa Agropecuária Brasileira, 43, 917-923. http://dx.doi.org/10.1590/ S0100-204X2008000700017.
Peltonen-Sainio, P. and Rajala A. (2007). Duration of vegetative and generative development phases in oat cultivars released since
1921. Field Crops Research, 101, 72-79. http://dx.doi.org/10.1016/ j.fcr.2006.09.011.
Pržulj, N. M. and Momčilović, V. M. (2013). Effect of cultivar and year on phyllochron in winter barley. Journal of Natural Sciences, 125, 93-100.
Rosa, H. T., Walter, L. C., Streck, N. A. and Alberto, C. M. (2009). Thermal time methods and sowing dates in phyllochron determination
in wheat cultivars. Pesquisa Agropecuária Brasileira, 44, 1374-1382. http://dx.doi.org/10.1590/S0100-204X2009001100002.
Rosa, H. T., Walter, L. C., Streck, N. A., Andriolo, J. L., Silva, M. R. and Langner, J. A. (2011). Base temperature for leaf appearance and phyllochron of selected strawberry cultivars in a subtropical
environment. Bragantia, 70, 939-945. http://dx.doi.org/10.1590/
S0006-87052011000400029.
Santos, H. G., Jacomine, P. K. T., Anjos, L. H. C., Oliveira, V. A.,
Oliveira, J. B., Coelho, M. R., Lumbreras, J. F. and Cunha, T. J. F.
(2013). Sistema brasileiro de classificação de solos. 3. ed. Brasília:
Embrapa.
Santos, L. C., Bonomo, P., Silva, V. B., Patês, N. M. S., Silva, C. C. F.
and Pires, A. J. V. (2009). Morphogenic characteristics of Brachiaria
in response to different fertilization. Acta Scientiarum. Agronomy,
31, 221-226. http://dx.doi.org/10.1590/S1807-86212009000200006.
Streck, N. A. (2002). A generalized nonlinear air temperature
response function for node appearance rate in muskmelon (Cucumis
melo L.). Revista Brasileira de Agrometeorologia, 10, 105-111.
Streck, N. A., Bosco, L. C., Menezes, N. L., Garcia, D. C., Alberto, C.
M. and Lago, I. (2005). Estimativa do filocrono em cultivares de trigo
de primavera. Revista Brasileira de Agrometeorologia, 13, 423-429.
Streck, N. A., Bosco, L. C., Michelon, S., Walter, L. C. and Marcolin,
E. (2006). Duration of developmental cycle of rice cultivars as a
function of main stem leaf appearance. Ciência Rural, 36,
1086-1093. http://dx.doi.org/10.1590/S0103-84782006000400007.
Streck, N. A., Gabriel, L. F., Buske, T. C., Lago, I., Samboranha, F.
K. and Schwantes, A. P. (2010). Simulating leaf appearance in a
maize variety. Bioscience Journal, 26, 384-393.
Streck, N. A., Lago, I., Samboranha, F. K., Gabriel, L. F., Schwantes,
A. P. and Schons, A. (2009). Base temperature for leaf appearance
and phyllochron of the BRS Missões maize variety. Ciência Rural,
39, 224-227. http://dx.doi.org/10.1590/S0103-84782009000100035.
Streck, N. A., Weiss, A., Xue, Q. and Baenziger, P. S. (2003).
Incorporating a chronology response into the prediction of leaf
appearance rate in winter wheat. Annals of Botany, 92, 181-190.
http://dx.doi.org/10.1093/aob/mcg121.
Xue, Q., Weiss, A. and Baenziger, P. S. (2004). Predicting leaf
appearance in field-grown winter wheat: evaluating linear
and non-linear models. Ecological Modelling, 175, 261-270.
http://dx.doi.org/10.1016/j.ecolmodel.2003.10.018.
Yusoff, M. M., Moot, D. J., McKenzie, B. A. and Hill, G. D. (2012).
Quantification of vegetative development of faba bean, oats,
and Italian ryegrass. Crop and Pasture Science, 63, 1097-1105.