Rev. Bras. Biom., Lavras, v.36, n.1, p.207-229, 2018 - doi: 10.28951/rbb.v36i1.165 207
STUDY OF EFFICIENCY TIME OF RECOMBINANT DNA INSULIN VIA
ACCELERATED LIFE TESTING AND INTERVAL CENSORING
Patrícia de Sousa ILAMBWETSI1 Graziela Dutra Rocha GOUVÊA2 Frederico Rodrigues Borges da CRUZ3 Fernando Luiz Pereira de OLIVEIRA2
ABSTRACT: This paper aims to study the efficiency of recombinant DNA insulin via models for accelerated life tests. The potency loss of these insulin products was evaluated periodically, subject to the conditions of temperature of 8°C, 25°C and 37°C. Insulin samples with potency at less than 100% were considered unfit for consumption, which characterizes the event of interest. Samples suitable for consumption were considered to be censored. The response variable was observed periodically for 736 days. For data analysis, statistical models of stress-response regression were used. The deterministic part of these models is the Arrhenius model because the stress variable is the temperature, while the probabilistic part was comprised of the Exponential, Weibull, and Log-normal models. The techniques of accelerated life tests proved adequate to address the time of potency loss of the insulin for the various temperature levels. The times of occurrence of the events were treated in three different ways, which were compared in this study. First, interval censoring was considered, or only the upper and lower limits of the interval in which the failure occurred were known. Then, the midpoint of this interval was considered as a failure time. Finally, only the lower limit of the interval in which the failure occurred was considered. According to the results, it is concluded that the use of the interval lower limit is more appropriate for estimating the reliability curves, as the estimates are closer to those using interval censoring then using the midpoint of the interval. For the specific case of the recombinant DNA insulin data, it was observed that the Arrhenius-Weibull model and the Arrhenius-lognormal are suitable for adjusting the data. It follows also that the temperature affects the power of the insulin: The higher the temperature are, the lesser the efficiency.
KEYWORDS: Accelerated life tests; stress variable; interval censoring; exact failure times.
1 Universidade Federal de Viçosa -UFV, Departamento de Estatística, CEP: 36570-900, Viçosa, MG, Brasil. E-mail: [email protected]
2 Universidade Federal de Ouro Preto - UFOP, Instituto de Ciências Exatas e Biológicas, Departamento de Estatística, CEP: 35400-000, Ouro Preto, MG, Brasil, E-mail: [email protected]; [email protected]
1
Introduction
Reliability models aim to study data from experiments in which the response variable is usually the time of the occurrence of an event of interest (failure time). The following elements are the failure time: the start time, the scale of measurement, and the event of interest.
According to Kalbfleisch and Prentice (2002), the main feature of the data in reliability studies is the presence of censoring: that is, a partial observation of the response. There are three types of censoring: right, left, and interval censoring (MEEKER and ESCOBAR, 1998). Data with interval censoring appear when the failure time cannot be observed, but only an interval in which the failure time is contained can be given (HUANG and WELLNER, 1996 YANG and PAN, 2013). However, some authors suggest that, in case of interval censoring , standard analysis methods may be applied if it is considered that the event of interest occurred in the beginning (LINDSEY and RYAN, 1998), in the end (DUCROCQ, 1999), or in the midpoint of the interval (ODELL et al., 1992).
Regardless of the type of censoring observed to estimate the life time of a product, experiments must be conducted for a long period of time. Thus, to minimize the time and expenses of the experiments, an alternative is to carry out an accelerated life test, which is a methodology widely used, especially in industries in the reliability context. Accelerated life tests, according to Nelson (1990) consist of a variety of methods to shorten the product life or accelerate the degradation of its performance. The goal in this case is to accelerate the failure of components by testing them in extreme environmental conditions and then extrapolate the accelerated test results for regular operating conditions (ZELEN, 1959). Accelerated life tests can be used on various types of materials and products, according to which various performance degradation mechanisms are applied. To ensure that the failure times will occur more quickly, acceleration variables must be carefully chosen to make it sure that the variable actually interferes with the experiment time.
According to Nelson (1972), one of the stress-response relationships frequently applied in practice is the Arrhenius Relationship, which is used in general to relate failure times of a product that was subjected to extreme temperatures. Several researchers have proposed the use of accelerated life tests, including Kötz et al. (2010), Kim et al. (2010), Pascual (2010), Núñez et al. (2011), Chan et al. (2011), Zhang et al. (2011), Zhao and Xu (2012), Yang and Pan (2013), Espinet-González et al. (2014), and Zhang and Wang (2015). The methodology of accelerated life tests can be used in diverse areas of knowledge. Most recently, we can cite studies done by Kurniadi et al. (2017) in which they selected one of the traditional foods of Indonesia, "Nasi Uduk" that is made from rice and cooked with coconut milk and spices. The objective of this research was to determine the shelf life of canned "nasi uduk" and the Arrhenius model was used. Storage temperatures were 35, 45 and 55° C for 35 days. The authors came to the conclusion that the useful life of canned "nasi uduk" was 9.6 months
Chiodo et al. (2016) studied a probabilistic battery design method with reference to lithium-ion batteries, based upon battery life and related economical aspects. The authors used the Weibull distribution to estimate the duration of the batteries, while Chang et al. (2016) presented a reliability evaluation method of the scroll compressor for an air conditioner system.
Rev. Bras. Biom., Lavras, v.36, n.1, p.207-229, 2018 - doi: 10.28951/rbb.v36i1.165 209 testing is applied to the production of insulin, a drug to treat diabetes mellitus (DM), which is a disease that is considered a serious medical and public health problem. DM is characterized by inadequate or no production of insulin, which is, according to Silva et al. (2003), a hormone naturally produced by the β cells of the islets of Langerhans of the pancreas. DM has, due to its complications, a high mortality rate (CASTRO and GROSSI, 2007; ARAUJO et al., 2009).
In order to make an analogy of pancreatic functioning, pharmaceutical companies started to provide numerous preparations of human recombinant DNA insulin (JOHNSON, 1983). Such preparations should be given to the needs of each diabetic individual and inappropriate use will result in the loss of their biological functions, resulting in poor control of blood glucose (STACCIARINI et al., 2008). According to the medical and pharmaceutical literature, it is known that, in normal use, the efficiency of insulin is mainly affected by extremes of temperature. Thus, an improper process of storage and preservation of bottles has been a major problem affecting their good stability and preservation. Given the importance and the increase in cases of DM in Brazil and in the world, it is necessary to study the relationship between the time of the power loss of recombinant insulins with the temperature in which the bottles are exposed during the storage and conservation process.
Reliability techniques in the context of accelerated life testing are considered in this paper for modelling data of efficiency loss of recombinant DNA insulin. Details of the models are given in Section 2. Section 3 describes the results obtained. Finally, Section 4 concludes the paper with final remarks and topics for future research in the area.
2
Materials and methods
The data in this study are related to the time until power loss of human DNA recombinant insulin, periodically evaluated in 10 ml bottles, from an insulin manufacturer in the state of Minas Gerais, Brazil. Three batches of the product were selected, 525g, 586G, and 597G. From each batch three bottles were removed and equally distributed in the conditions of 8°C, 25°C, and 37°C temperatures, relative humidity controlled to 70%, upside down, and analyzed according to standard methodologies in certain periods. The storage period of the insulins was measured in days, and the maximum time of 736 days was observed. Unfit for consumption were those insulin samples with power less than 100%, which characterizes the event of interest. Thus, the dependent variable is the time until the samples are deemed unfit for human consumption. Samples suitable for consumption by the end of the observation time were considered to be censored. During this period, the insulin bottles showed power between 100% and 55.2%.
For data analysis, we will use statistical models of stress-response regression in which the deterministic part was composed by the Arrhenius model. According to Nelson (1990), the expression of the time to failure for the Arrhenius model is defined by:
where 𝑇 is the failure time; τ = (℃ + 273,16) is the stress variable (temperature); 𝐴 is a constant determined by the experiment; 𝐸 is the activation energy in electron-volts; 𝐾 is Boltzmann constant, 8.6171 × 10⁻⁵K.
The linear form of Eq. (1) is given by 𝑙𝑛(𝑇) = 𝑙𝑛(𝐴) +𝐾𝜏𝐸, in which 𝑙𝑛(𝑇) is the logarithm of the failure time and 𝑙𝑛(𝐴) is the logarithm of the constant A. The values of constants A and E are estimated by the experimental data. Thus, the linearized stress-response Arrhenius model is defined mathematically by 𝑙𝑛(𝑇) = 𝛽0+ 𝛽1𝑥, in which𝛽0=
𝑙𝑛 (𝐴), 𝛽1=𝐸
𝐾, and 𝑥 = 𝜏−1, in which 𝜏 = (℃ + 273.16) is the stress variable, the
temperature.
For being the most used in studies involving accelerated life tests, the probabilistic part was composed by the exponential, Weibull, and log-normal models. These models have the function to explain the variability in the time of the insulin efficiency loss to the various levels of temperature and are described as follows.
2.1 Exponential Arrhenius model
The exponential Arrhenius regression model has the following conditions: i) for each level of stress, the failure time T follows the exponential distribution; ii) the model involves only a covariate. The reliability function 𝑅(𝑡) of failure time 𝑇, subject to the stress variable, temperature x = 1τ, is given by:
𝑅(𝑡; 𝑥) = exp{− (𝑒𝑥𝑝{𝛽𝑡
0+ 𝛽1𝑥})} =exp{−
𝑡
𝛼} (2)
in which𝜶 = exp(𝜷𝟎+ 𝜷𝟏𝒙) = 𝑨 exp [𝑲𝝉𝑬], 𝜷𝟎= 𝒍𝒏 (𝑨), 𝜷𝟏=𝑲𝑬, and 𝒙 = 𝝉−𝟏.
2.2 Weibull-Arrhenius model
The use of the Weibull-Arrhenius regression model requires that the following conditions are met: i) for each level of stress 𝑥, the failure time 𝑇 follows the Weibull distribution 𝛼(𝑥), 𝛿); the logarithm of that time has distribution of the extreme value, that is, 𝑌 = ln(𝑇) has extreme value distribution with location parameter ln [𝛼(𝑥)] and scale 𝜎 =1𝛿, in which 𝛼 = exp (𝑥′𝛽); ii) the scale parameter 𝜎 =1𝛿 is the same for all stress levels. The reliability function 𝑅(𝑡) of failure time 𝑇, conditioned to the stress variable, temperature 𝑥 = 1𝜏 is given by:
𝑅(𝑡; 𝑥) = 𝑒𝑥𝑝 {− (𝑒𝑥𝑝{𝑥𝑡 ′𝛽}) 1 𝜎
} = 𝑒𝑥𝑝 {− (𝛼)𝑡 1 𝜎
} (3)
Rev. Bras. Biom., Lavras, v.36, n.1, p.207-229, 2018 - doi: 10.28951/rbb.v36i1.165 211
2.3 Log-normal Arrhenius model
The log-normal Arrhenius regression model has the following condition: for each stress level, the failure time follows the log-normal distribution; the logarithm of the time follows a normal distribution with mean 𝜇(𝑥), variance 𝜎2, and constant standard deviation.
The reliability function 𝑅(𝑡) of failure time 𝑇, conditioned to the stress variable, temperature 𝑥 = 1𝜏, is given by:
𝑅(𝑡; 𝑥) = 𝛷 {− [𝑙𝑛(𝑡) − 𝜇(𝑥)𝜎 ]} (4)
in which 𝜇(𝑥) = 𝛽0+ 𝛽1𝑥 = 𝑙𝑛 [𝐴𝑒𝑥𝑝 [𝐾𝜏𝐸]], 𝛽0= 𝑙𝑛 (𝐴), 𝛽1=𝐸𝐾, 𝑥 = 𝜏−1, and Φ is the
standard normal accumulate distribution function, that is, mean is equal to 0 and standard deviation is equal to 1.
Because the failure times were not observed but only the intervals in which occurred the event of interest, there is a typical case of interval-censored. So in this article we chose to work with the data in the way they were originally collected and also considering that the failure time is known, assuming initially that the event occurred at the midpoint of the range defined interval-censored. Thus, the reliability functions were estimated for different temperatures, by means of non-parametric Kaplan-Meier methods (KAPLAN and MEIER, 1958), when considering the midpoint of the range, and Turnbull method (TURNBULL, 1976), for interval censoring.
The log-rank test was used to compare equality between the estimated reliability
curves. This test compares the observed number of failures in each group with the expected number of failures under the null hypothesis that the reliability curves are equal (COLOSIMO and GIOLO, 2006).
To estimate the parameters of the models we used the maximum likelihood estimator and the likelihood ratio test was used in choosing the probability model that best fits the data set.
The likelihood function in the case of interval censorship, according to Colosimo and Giolo (2006) is given by𝐿(𝜃) =∏ [𝑅(𝑙𝑖=1𝑟 𝑖|𝑥𝑖) − 𝑅(𝑢𝑖|𝑥𝑖)]𝛿𝑖[𝑅(𝑙𝑖|𝑥𝑖)]1−𝛿𝑖, being xi
the vector of covariates li and ui their respective lower and upper limits of the time range
observed for the i-th subject. If δi= 1 if the event occurred in (Li, Ui], δi= 0, if the event
occurred in a longer time than the li. Thus, the maximum likelihood estimators are the values of the parameters 𝜃 = (𝛽′𝑠, 𝜎) that maximize the logarithm function of likelihood,
i.e., the values that satisfy 𝑈(𝜃) =𝜕 log 𝐿(𝜃)𝜕𝜃 = 0.
All the routines used to generate the results of this paper were performed with R
software (R CORE TEAM, 2017) and are available directly from the authors for research
and educational purposes.
3
Results and discussion
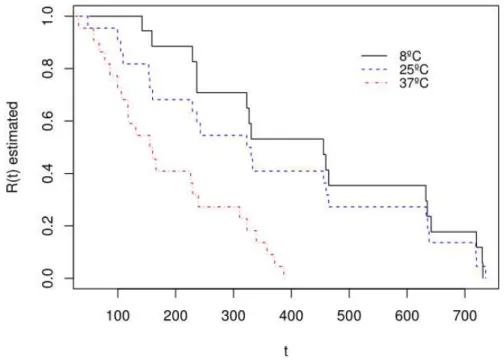
In an initial exploratory data analysis, results obtained by the nonparametric Kaplan-Meier and Turnbull estimators are presented. In Figure 1, the estimated curves of the reliability function by Kaplan-Meier method may be seen, for different temperatures and considering that the failure time is the midpoint of the interval in which the event occurred. It can be seen in Figure 1 that the insulin reliability curve falls more rapidly when subjected to a temperature of 37°C, which agrees with the ADA (AMERICAN DIABETES ASSOCIATION, 2004) suggesting that the insulin should not be exposed to temperatures higher than 30°C. That is, temperatures above this value will result in lower effectiveness of insulin times. It is also observed that the curves with temperatures of 8°C to 25°C do not appear to differ from each other.
The results of log-rank test to compare the estimated reliability curves showed no significant differences at the level of significance of 5% between the curves estimated for temperatures of 8°C to 25°C (𝑝-value = 0.495). It is noteworthy that these results are consistent with the suggestions to keep insulins refrigerated at temperatures from 2 to 8°C and/or at ambient temperatures between 15°C and 30°C (GROSSI and PASCALI, 2009).
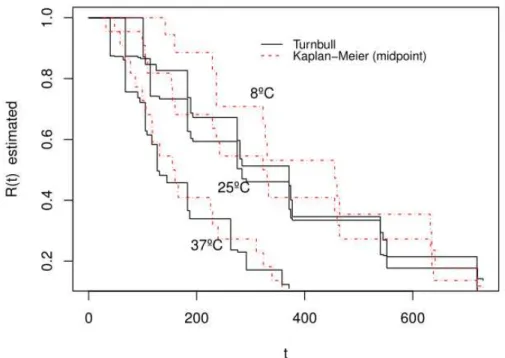
Rev. Bras. Biom., Lavras, v.36, n.1, p.207-229, 2018 - doi: 10.28951/rbb.v36i1.165 213 Additionally, the Turnbull method was applied to the original data, that is, interval-censored, in order to verify whether, in equivalent situations, there are significant differences between the estimates, considering the two situations studied. The curves estimated by the Turnbull method and the Kaplan-Meier method are shown in Figure 2, which shows that, in general, the estimates by Turnbull method show lower values than the estimates obtained by the Kaplan-Meier curves, which used the midpoint of the intervals.
Figure 2 - Estimated reliability curves by Kaplan-Meier, considering the midpoint of the interval, and by Turnbull, for interval censoring.
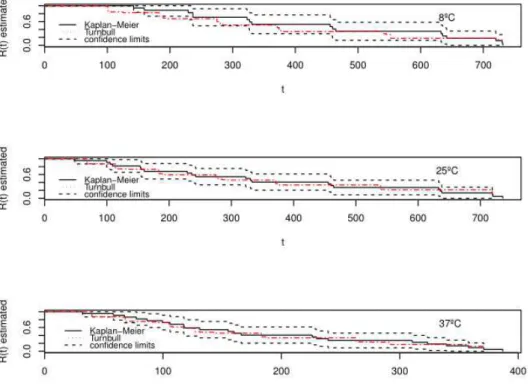
Figure 3 - Estimated reliability curves considering the midpoint of the intervals and their average with the confidence limits.
Based on the presented results is plausible to apply the Kaplan-Meier method considering the lower limit rather than the midpoint of the intervals in which the failure occurred and to compare with the results obtained by the Turnbull method. The curves are shown in Figure 4 from which it is noticed that the curves estimated using both methods for each temperature are very close. The results were different from those suggested by Odell
et al. (1992), Ducrocq (1999) and Colosimo and Giolo (2006). According to the authors,
Rev. Bras. Biom., Lavras, v.36, n.1, p.207-229, 2018 - doi: 10.28951/rbb.v36i1.165 215
Figure 4 - Estimated reliability curves by Kaplan-Meier and Turnbull methods considering the inferior limit of the intervals.
The results of log-rank test, with the lower limit of the intervals showed no significant differences at the level of significance of 5% between the reliability curves estimated for temperatures of 8°C to 25°C (𝑝-value = 0.498). It can be seen that the results are very similar to those in which it was considering the midpoint of the intervals and it was decided then to adjust regression models for all situations studied here.
3.1 Accelerated regression models for failure times at the interval midpoints
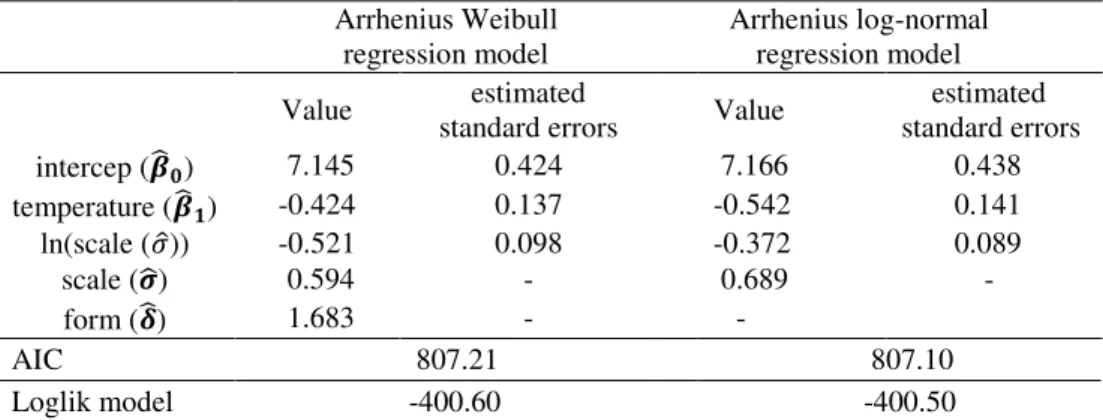
Weibull and log-normal Arrhenius accelerated regression models were considered. Estimates of the parameters of these models are presented in Table 1.
Table 1 - Estimates of parameters of Weibull and log-normal Arrhenius models considering the midpoint of the intervals
Arrhenius Weibull
regression model Arrhenius log-normal regression model Value standard errors estimated Value estimated standard errors
intercep (𝜷̂𝟎) 7.145 0.424 7.166 0.438
temperature (𝜷̂𝟏) -0.424 0.137 -0.542 0.141
ln(scale (𝜎̂)) -0.521 0.098 -0.372 0.089
scale (𝝈̂) 0.594 - 0.689 -
form (𝜹̂) 1.683 - -
AIC 807.21 807.10 Loglik model -400.60 -400.50
For both models the estimates of parameter 𝛽1 is negative. This indicates that the larger the value of the lower temperature variable lower is the probability of the power of the insulin to remain efficient. This observation is confirmed by Figure 5, which generated reliability curves considering temperatures of 2°C and 40°C than those in which the data were collected, and maintaining the temperature of 25ºC.
Rev. Bras. Biom., Lavras, v.36, n.1, p.207-229, 2018 - doi: 10.28951/rbb.v36i1.165 217
Figure 5 - Estimated reliability curves by Weibull and log-normal Arrhenius accelerated regression models, considering the midpoint of the intervals.
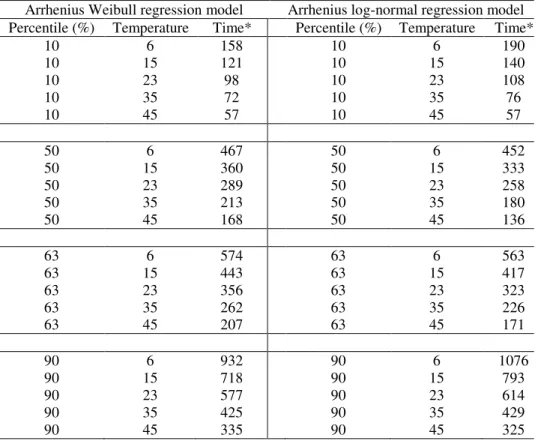
Table 2 - Results obtained by Weibull and log-normal Arrhenius models at different temperatures for some percentiles
Arrhenius Weibull regression model Arrhenius log-normal regression model Percentile (%) Temperature Time* Percentile (%) Temperature Time*
10 6 158 10 6 190
10 15 121 10 15 140
10 23 98 10 23 108
10 35 72 10 35 76
10 45 57 10 45 57
50 6 467 50 6 452
50 15 360 50 15 333
50 23 289 50 23 258
50 35 213 50 35 180
50 45 168 50 45 136
63 6 574 63 6 563
63 15 443 63 15 417
63 23 356 63 23 323
63 35 262 63 35 226
63 45 207 63 45 171
90 6 932 90 6 1076
90 15 718 90 15 793
90 23 577 90 23 614
90 35 425 90 35 429
90 45 335 90 45 325
*day
3.2 Fit of accelerated regression models, considering the accurate failed time as the starting point of the range
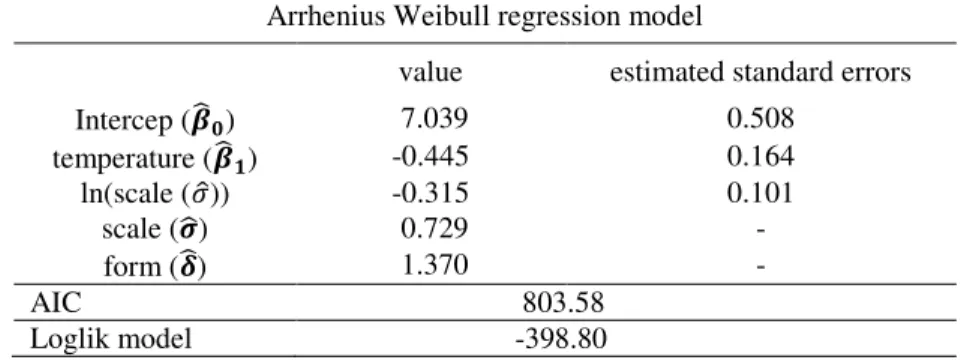
Rev. Bras. Biom., Lavras, v.36, n.1, p.207-229, 2018 - doi: 10.28951/rbb.v36i1.165 219 Table 3 - Estimates for the parameters of the Arrhenius model-Weibull, considering the
lower limit of the range
Note that, in the table 3, the estimated value of β ̂ 1 is negative. This indicates that the higher the value of the variable temperature, the lower the likelihood of the insulin’s potency to remain efficient. This observation can be displayed in Figure 6.
Figure 6 - Reliability curves estimated by Arrhenius -Weibull regression models to NPH human insulin data to different temperatures, considering the starting point of the range.
When analyzing the estimated reliability curves in Figure 6, to different temperatures, it is observed that about 38% of the insulin, which was subjected to temperatures of 40° C, will be fit for consumption (potency equal to 100%) within 200 days, while the percentage
Arrhenius Weibull regression model
value estimated standard errors
Intercep (𝜷̂𝟎) 7.039 0.508
temperature (𝜷̂𝟏) -0.445 0.164
ln(scale (𝜎̂)) -0.315 0.101
scale (𝝈̂) 0.729 -
form (𝜹̂) 1.370 -
of efficient insulin, stored for the same time, will be around 80% when kept at temperatures of 2ºC.
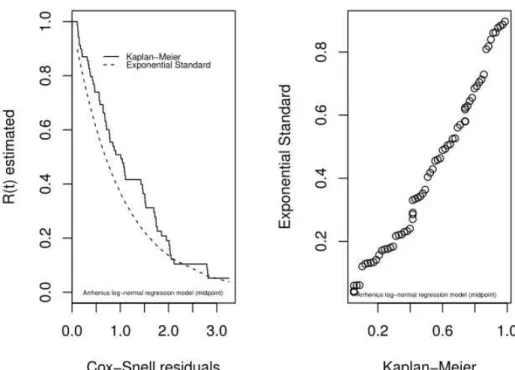
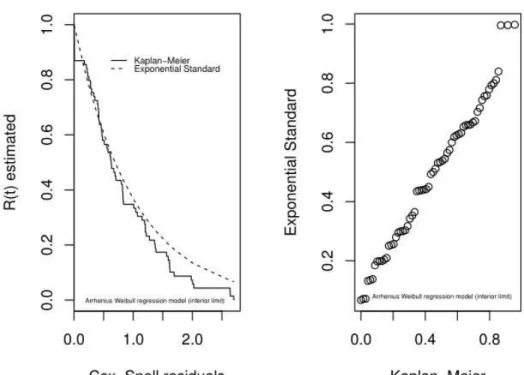
To assess the adequacy of the Arrhenius-Weibull regression model, Cox-Snell residue were considered and through the results, it can be concluded that the model adjusts, in a satisfactory manner, to the failure times of NPH human insulin data, considering the starting point of the range.
We once again observe that the time in which the insulin remains with efficiency equal to 100%, tends to decrease as the temperature increases. Considering the median (50 percentile), note that the time of reliability so that 50% of the insulin is apt for consumption at 6°C, will decrease from 380 to 232 days when subjected to temperatures of 23ºC.
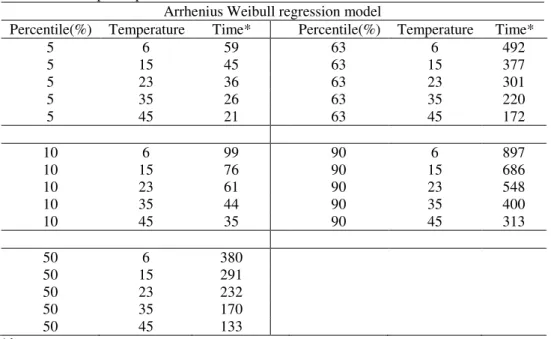
In table 4, we can see the results obtained at different temperatures, which can be considered normal use conditions, depending on where the insulin is stored. We can observe, again, that the time in which the insulin remains with 100% potency, tends to decrease as the temperature increases. Considering the median (50 percentile), note that the time of reliability, so that 50% of the insulin is apt for consumption at 6ºC, it will fall from 380 to 232 days when subjected to temperatures of 23ºC.
Table 4 – Results obtained with the Arrhenius -Weibull model at different temperatures for a couple of percentiles
Arrhenius Weibull regression model
Percentile(%) Temperature Time* Percentile(%) Temperature Time*
5 6 59 63 6 492
5 15 45 63 15 377
5 23 36 63 23 301
5 35 26 63 35 220
5 45 21 63 45 172
10 6 99 90 6 897
10 15 76 90 15 686
10 23 61 90 23 548
10 35 44 90 35 400
10 45 35 90 45 313
50 6 380
50 15 291
50 23 232
50 35 170
50 45 133
*day
Rev. Bras. Biom., Lavras, v.36, n.1, p.207-229, 2018 - doi: 10.28951/rbb.v36i1.165 221 Table 5 - Results of the predictions obtained using the Arrhenius -Weibull and
Arrhenius-lognormal models to both exact failure times, considering the room temperature of 23ºC
Midpoint of the interval Inferior limit of the interval Arrhenius
Weibull regression
model
Arrhenius log-normal regression model
Arrhenius Weibull regression model
Average life time (day) 318 412 276
Failure percentage in a year 65 57 73
Warranty period-5% failure (day) 64 85 36
Percentile 10 (day)-median (day) 98 108 61
Percentile 50 (day) 289 258 232
Percentile 90 (day) 577 614 548
One realizes that, in Table 5, the predictions for failure times, given the starting point of the range, resulted in lower values, i.e. a more conservative scenario. It is suggested that manufacturers will opt for this result to prevent consumers from using insulin that does not have proper efficiency. Insulin manufacturers should stipulate, in accordance with the Arrhenius -Weibull model, a warranty period of 36 days, so that only 5% of the produced insulin show a compromised efficiency, when kept at a temperature of 23°C.
3.3 Accelerated regression models for interval censoring
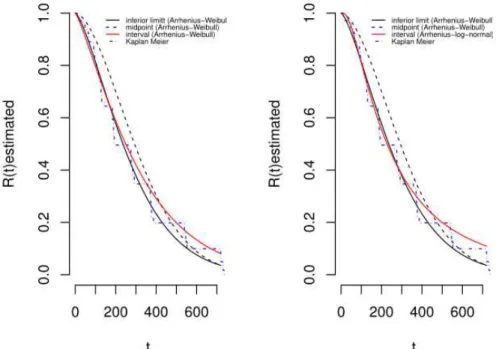
Figures 7 and 8 present the estimated reliability curves via Kaplan-Meier to failed times considered in this article overlapping curves estimated by Turnbull considering interval censoring.
In Figure 7, the estimates (blue and red lines) are closer to estimates that consider the lower limit of the range, especially for the Arrhenius-lognormal model. However, in both charts, after 300 days, the chances of the insulin remaining efficient, suffered a change in both situations. In Figure 8, we observe the same behavior in relation to Figure 7.
Figure 7- Estimated reliability curves, considering the Arrhenius -Weibull model to the midpoint and lower limit of the range and Arrhenius-Weibull, Arrhenius-log-normal for interval censoring.
Rev. Bras. Biom., Lavras, v.36, n.1, p.207-229, 2018 - doi: 10.28951/rbb.v36i1.165 223
4
Conclusions
The findings that the techniques of accelerated life tests proved adequate to address the efficiency time of recombinant DNA insulin for various temperature levels. The event of interest was treated as interval censoring and also assuming that the failure time is the midpoint of the interval in which the event of interest occurred, and finally, assuming that the upper limit of interval is the exact time to failure. According to the results, it is concluded that the use of the lower limit of the interval is more appropriate for estimating the reliability curves when compared to the use of the midpoint, as it is closer to the results generated using interval censoring. For the specific case of the recombinant DNA insulin data, it was observed that the Weibull and the lognormal Arrhenius models are suitable for the adjustment of the data in the situation that considers the midpoint of the interval. In the case where the failure time was determined by the lower limit of the interval, the Weibull Arrhenius model fits the data in the study. It found also that the temperature affects the efficiency of the insulin. The higher the temperature, the shorter the efficiency duration. The statements regarding the efficiency of insulins time were reliable and secure. Finally, with the results presented, it is concluded that, through models for accelerated life tests, which provide estimates of the product failure times, manufacturers will not only be able to produce insulin with more quality and reliability but they also will offer products with higher efficiency.
Acknowledgments
This research is partially supported by CNPq (grants n° 304671/2014-2 and 300825/2016-1)), FAPEMIG (grant CEX-PPM-00564-17), CAPES, and Universidade
Federal de Ouro Preto (grant Edital PROPP 09/2016). We thank the reviewers and editors
for suggestions and comments.
ILAMBWETSI, P. S.; GOUVÊA, G. D. R.; CRUZ, F. R. B.; OLIVEIRA, F. L. P. LEAL, B. G. Study of efficiency time of recombinant dna insulin via accelerated life testing and interval censoring. Rev. Bras. Biom., Lavras, v.36, n.1, p.207-229, 2018.
mais adequado para estimar as curvas de confiabilidade, pois as estimativas são mais próximas das que utilizam a censura intervalar, utilizando-se então o ponto médio do intervalo. Para o caso específico dos dados de insulina de DNA recombinante, observou-se que o modelo de Arrhenius-Weibull e o Arrhenius-lognormal são adequados para o ajuste dos dados. Segue-se também que a temperatura afeta o poder da insulina: quanto maior a temperatura, menor a eficiência.
PALAVRAS-CHAVE: Testes de vida acelerados; variável de estresse; censura intervalar; tempos exatos de falha.
References
AMERICAN DIABETES ASSOCIATION. Insulin administration. Diabetes Care, v.27, n.1, p.133-36, 2004.
ARAÚJO, M. F. M.; CAETANO, J. A.; DAMASCENO, M. M. C. Reutilização de agulhas e seringas descartáveis por um grupo de diabéticos. Ciência, Cuidado e Saúde, v.1, n.8, p.93-100, 2009.
CASTRO, A. R. V.; GROSSI, S. A. A. Reutilização de seringas descartáveis no domicílio de crianças e adolescentes com diabetes Mellitus. Revista da Escola de Enfermagem, v.41, n.2, p.187-95, 2007.
CHAN, S. I; HONG, W. S; KIM, K. T; YOON, Y. G; HAN, J. H; JANG, J. S. Accelerated life test of high power white light emitting diodes based on package failure mechanisms.
Microelectronics Reliability, v.51, p.1806–1809, 2011.
CHANG; M. S. et al. Reliability evaluation of scroll compressor for air conditioner system.
Journal of Mechanical Science and Technology, v.30, n.10, p.4459-4463, 2016.
CHIODO, E. et al. Probabilistic battery design based upon accelerated life tests. Intelligent
Industrial Systems, v.2, n.3, p.243-252, 2016.
COLOSIMO, E. A; GIOLO, S. R. Applied Survival Analysis. 2.ed. São Paulo, 2006. 367p. DUCROCQ, V. Extension of survival analysis models to discrete measures of longevity. In: Wokshop Information, Jouy en Josas, 1999. p. 41-47. France.
ESPINET-GONZÁLEZ, P; ALGORA, C; NÚÑEZ, N; ORLANDO, V, VÁZQUEZ, M; BAUTISTA, J; ARAKI, K. Temperature accelerated life test on commercial concentrator III–V triple-junction solar cells and reliability analysis as a function of the operating temperature. Progress in Photovoltaics: Research and Applications, v.23, n.5, p.559-569, 2014.
FREITAS, M. A.; COLOSIMO, E. A. Confiabilidade: Análise de tempo de falha e testes
de vida acelerados. Belo Horizonte, 1997. 309p
GROSSI, S. A. A.; PASCALI, P. M. Cuidados de enfermagem em diabetes mellitus. São Paulo: Departamento de Enfermagem da Sociedade Brasileira de Diabetes. 2009.
HUANG, J.; WELLNER, J. A. Interval censored data: a review of recent progress. In: SEATTLE SYMPOSIUM IN BIOSTATISTICS, 1, 1996, New York. Proceedings... New York: Springer-Verlag, 1996. p. 123-169.
Rev. Bras. Biom., Lavras, v.36, n.1, p.207-229, 2018 - doi: 10.28951/rbb.v36i1.165 225 KALBFLEISCH, J. D.; PRENTICE, R. L. The statistical analysis of failure time data. 2.ed. New York: John Wiley & Sons; 2002. 437p.
KAPLAN, E.L.; MEIER, P. Nonparametric estimation from incomplete observations.
Journal of American Statistical Association, v.53, n.282, p.457-481, 1958.
KIM, J; YOON, D; JEON, M; KANG, D; KIM, J; LEE, H. Degradation behaviors and failure analysis of NieBaTiO3 base–metal electrode multilayer ceramic capacitors under highly accelerated life test. Current Applied Physics, v.10, p.1297-1301, 2010.
KÖTZ, R; RUCH, P.W; CERICOLA, D. Aging and failure mode of electrochemical double layer capacitors during accelerated constant load tests. Journal of Power Sources, v.195, p.923–928, 2010.
KURNIADI, M. et al. Shelf-life prediction of canned “nasi uduk” using accelerated
shelf-life test (ASLT) - Arrhenius model. International Conference on Engineering, Science and
Nanotechnology 2016 (Icesnano 2016), Solo, Indonesia (2016): AIP Conference Proceedings, Vol. 1788 (1). 2017.
LINDSEY, J. C; RYAN, L. M. Tutorial in biostatistics methods for interval-censored data.
Statistics in Medicine, v.17, p.219-38, 1998.
MEEKER, W. Q; ESCOBAR, L. A. Statistical methods for reliability data. New York: John Wiley & Sons, 1998. 680p.
NÚÑEZ, N.; VÁZQUEZ, M; GONZÁLEZ, J. R; JIMÉNEZ, F. J; BAUTISTA, J. Instrumentation for accelerated life tests of concentrator solar cells. Review of Scientific
Instruments, v.82, n. 2, 2011.
NELSON, W. A Short life test for vomparing a sample with previous accelerated test Results. Technometrics v.14, p.175-185. 1972.
NELSON, W. B. Accelerated testing: Statistical models, test plans, and data analyses. New York: John Wiley & Sons, 1990.
NELSON, W. B. A bibliography of accelerated test plans. IEEE Transactions on
Reliability, v.54, n.2, p.194–197, 2005.
ODELL, P. M; ANDERSON, K. M; D’AGOSTINHO, R. B. Maximum likelihood estimation for interval-censored data using a Weibull based failure time model. Biometrics, v.48, p.951-959, 1992.
PASCUAL, F. Accelerated life test planning with independent lognormal competing risks.
Journal of Statistical Planning and Inference, v.140, p.1089–1100, 2010.
R CORE TEAM. R: A language and environment for statistical computing. R Foundation for Statistical Computing, Vienna, Austria, 2017. URL http://www.R-project.org/.
SILVA, C.; RIBEIRO, A.; FERREIRAS, D.; VEIGA, F. Administração oral de peptídeos e proteínas: III. Aplicação à insulina. Revista Brasileira de Ciências Farmacêuticas, v.39, p.1, 2003.
TURNBULL, B. W. The empirical distribution function with arbitrarily grouped, censored and truncated data. Journal of the Royal Statistical Society, Series B, v. 38, n. 3, p. 290-295, 1976.
YANG, T; PAN, R. A Novel approach to optimal accelerated life test planning with interval censoring. IEEE Transactions on Reliability, v.62, n.2, p.527-536, 2013.
ZELEN, M., Factorial Experiments in Life Testing, Technometrics, v.1, 269-288, 1959. ZHANG, J. P; WANG, R. T. Reliability life prediction of vfd by constant temperature stress accelerated life tests and maximum likelihood estimation. Journal of Testing and
Evaluation, v.37, n.4, 2015.
ZHANG, M; ZHANG, H; LIU, P; LI, Y. Degradation factors of a new long life cathode.
Applied Surface Science, v.258, p.668–671, 2011.
ZHAO, H; XU, D. Study on the accelerated life test for durability of irrigation microsprayer.
Journal of Irrigation and Drainage Engineering, v.138, p.843-847, 2012.
Rev. Bras. Biom., Lavras, v.36, n.1, p.207-229, 2018 - doi: 10.28951/rbb.v36i1.165 227
ATTACHMENTS -
Residual charts generated for the estimated models.
Rev. Bras. Biom., Lavras, v.36, n.1, p.207-229, 2018 - doi: 10.28951/rbb.v36i1.165 229