http://www.uem.br/acta ISSN printed: 1806-2636 ISSN on-line: 1807-8672
Doi: 10.4025/actascianimsci.v38i1.29171
Acta Scientiarum. Animal Sciences Maringá, v. 38, n. 1, p. 45-51, Jan.-Mar., 2016
Evaluation of digestion procedures in Kjeldahl method to quantify
total nitrogen in analyses applied to animal nutrition
Tadeu Eder da Silva, Edenio Detmann, Marcia de Oliveira Franco, Malber Nathan Nobre Palma and Gabriel Cipriano Rocha*
Departamento de Zootecnia, Universidade Federal de Viçosa, Campus Universitário, s/n, 36570-900, Viçosa, Minas Gerais, Brazil. *Author for correspondence. E-mail: [email protected]
ABSTRACT. The effects of the salt-to-metal catalyst ratio and amount of digestion mixture on total nitrogen content in different materials using the Kjeldahl method were evaluated. Four samples with low nitrogen contents and four samples with high nitrogen contents were analyzed. The study evaluated two ratios of salt (sodium sulfate) to metal catalyst (copper sulfate) in the digestion mixture (10:1 and 20:1) and three amounts of digestion mixture per sample (1.0, 1.5, and 2.0 g 200 mg-1). There was an interaction
between low-nitrogen material and amount of digestion mixture on nitrogen contents. Samples of cattle feces and corn presented higher nitrogen content when 1.5 and 2.0 g of digestion mixture were used. The high-nitrogen materials presented higher nitrogen contents when 2.0 g of the digestion mixture was used. However, there was an interaction between high-nitrogen material and the ratio of the digestion mixture components. The cattle carcass sample showed higher nitrogen content when the 20:1 ratio was used. The digestion mixture amount in the Kjeldahl method must be 2.0 g with a salt-to-metal catalyst ratio of 20:1 when samples of approximately 200 mg are analyzed.
Keywords: crude protein, digestion mixture, feed analysis.
Avaliação da etapa de digestão do método de Kjeldahl para quantificação do nitrogênio
total em análises voltadas à nutrição animal
RESUMO. Avaliaram-se os efeitos da quantidade de mistura digestora e da razão dos componentes da mistura digestora utilizada no método de Kjeldahl para quantificação do nitrogênio total em diferentes materiais. Foram utilizadas quatro amostras com baixo teor de nitrogênio e quatro amostras com alto teor de nitrogênio. Avaliou-se a comninação de duas razões entre sal (sulfato de sódio) e catalisador metálico (sulfato de cobre) na mistura digestora (10:1 e 20:1) e três quantidades de mistura digestora por amostra (1,0; 1,5 e 2,0 g 200 mg-1). Para os materiais de baixo nitrogênio houve interação entre o material analisado
e a quantidade de mistura digestora. Amostras de fezes bovinas e milho apresentaram maiores teores de nitrogênio com o uso de 1,5 e 2,0 g de mistura digestora. Para os materiais de alto nitrogênio verificou-se maior teor de nitrogênio com o uso de 2,0 g de mistura digestora. No entanto, houve interação entre material avaliado e razão na mistura digestora para amostras de alto nitrogênio. Amostra de carcaça bovina apresentou maior teor de nitrogênio utilizando-se a razão 20:1. A quantidade de mistura digestora para o método de Kjeldahl deve ser de 2,0 g com razão entre sal e catalisador metálico de 20:1 para amostras de aproximadamente 200 mg.
Palavras-chave: proteína bruta, mistura digestora, análise de alimentos.
Introduction
In animal and human nutrition, the most common procedure to access the protein content of feeds is based on quantifying the total nitrogen content and then multiplying this estimate by a factor, usually 6.25, to express the results as crude protein or protein equivalent (Chang, 1998; Silva & Queiroz, 2002).
Among the methods applied to quantify the total nitrogen content of feeds, the Kjeldahl method is the most widely used. This method was initially
developed by the Danish researcher Johan Kjeldahl in 1883 and is a routine analysis in laboratories of animal nutrition. However, the cost of such analysis is a function of the amount of reagents used to perform the procedures. Moreover, a considerable amount of waste is generated, which increases environmental risk and the costs due to the greater demand for waste treatment.
achieve the elimination of organic matter and retention of the nitrogen in a stable mineral form (ammonium sulfate). Copper sulfate is used as a metal catalyst to increase the generation of reactive forms of oxygen and the oxidizing power of the digestion solution (Silva & Queiroz, 2002). Although copper sulfate has lower cost as well as lower environmental and health risk compared with other catalysts (e.g. mercury and selenium), its overutilization can cause accumulation in the environment, including water and soil contamination (Chaves, Souza, Chaves & Tito, 2009).
The amount of digestion mixture (salt plus metal catalyst) recommended by the Brazilian National Institute of Science and Technology in Animal Science (INCT-CA; method N-001/1) is 2.0 grams per aliquot to be digested (200-250 mg). The digestion mixture is composed of ten parts of salt (sodium sulfate or potassium) to one part of metal catalyst (copper sulfate). Decreasing the amount of the digestion mixture per sample and increasing the ratio of salt to metal catalyst in the digestion procedure of the Kjeldahl method could be an alternative to reduce the aforementioned problems.
The objective of this study was to evaluate the effects of varying the digestion mixture amount as well as the ratio between the components of the digestion mixture in the digestion procedure of the Kjeldahl method on the total nitrogen contents in different materials.
Material and methods
The experiment was performed at the Animal Nutrition Laboratory of the Animal Science Department of the Universidade Federal de Viçosa, Viçosa, Minas Gerais State, Brazil. Eight samples were used, four samples with low-nitrogen content
(corn grain, sugar cane in natura, corn silage, and
feces obtained from a feedlot lactating cow) and four samples with high-nitrogen content (soybean meal, cottonseed meal, casein, and cattle carcass). Additionally, a standard sample with known nitrogen content (HCl - Lysine) was evaluated according to the recommendations of Windham (1998). Samples of feeds and feces were obtained in Viçosa, Minas Gerais State, Brazil. Casein (casein technical from bovine milk, Sigma C7078) and HCl-Lysine (HCl-Lysine 78%, Ajinomoto Animal Nutrition) were purchased directly from the manufacturers.
High-moisture samples were oven-dried (60ºC). Then, all samples were ground to pass through a 1-mm screen sieve (Wiley Mill; Thomas Scientific, Swedesboro, NJ) and stored in polyethylene pots.
The nitrogen analyses were performed according to the INCT-CA method N-001/1 (Kjeldahl method; Detmann et al., 2012) using the salt sodium
sulfate (Na2SO4 P.A., Vetec V000121) and the
copper sulfate catalyst (CuSO4.5H2O P.A., Isofar
321) as digestion mixture components. However, different ratios between these compounds (salt-to-catalyst ratio) and different amounts of the digestion mixture per aliquot were used. The same concentrated sulfuric acid was used for all analyses
(H2SO4 technical grade 95% Vetec V0T0145).
The experiment lasted nine days, and each group of samples (low-nitrogen, high-nitrogen, and the standard) was analyzed for three consecutive days.
Each sample was evaluated according to six treatments following a 2 × 3 factorial arrangement. Two salt-to-metal catalyst ratios in the digestion mixture (10:1 and 20:1) and three amounts of digestion mixture per aliquot (1.0, 1.5, and 2.0 g, for 200 mg aliquots).
On each day of analysis, the samples were evaluated in duplicate using two digestion blocks
(TE-040, Tecnal Equipamentos para Laboratórios,
Piracicaba, São Paulo State, Brazil). Thus, for each low-nitrogen and high-nitrogen sample, a total of 48 aliquots and 12 blanks were analyzed per day, with two tubes for each treatment. For the evaluation of the standard, a total of 12 aliquots and 12 blanks were analyzed per day, as described above.
To perform the digestion procedures, approximately 200 mg of the samples were poured into glass tubes followed by the addition of the digestion mixture according to the aforementioned treatments. Subsequently, 5 mL of sulfuric acid was added. The tubes were then heated up to 400°C, and from this moment began the digestion time count. The digestion end-point was defined when the solution became liquid and translucent, and the brownish smoke stopped being released. The tubes were allowed to cool at room temperature. After that, distilled water was added to the tube in sufficient quantity to double the final volume of the solution and then manually stirred.
Then, the contents of the tubes were steam-distilled in the Kjeldahl distillation apparatus
(TE-036/1, Tecnal Equipamentos para Laboratórios,
Piracicaba, São Paulo State, Brazil) using 25 mL of a
sodium hydroxide solution (500 g L-1, NaOH P.A.,
ACS Vetec 1137). The steam obtained from distillation was collected in an Erlenmeyer flask
containing 20 mL of a boric acid solution (40 g L-1,
H3BO3 P.A., Proquímios). Methyl red and
Acta Scientiarum. Animal Sciences Maringá, v. 38, n. 1, p. 45-51, Jan.-Mar., 2016
The distilled was then titrated with a standard solution of hydrochloric acid (0.02 N for low-nitrogen materials and 0.05 N for the standard and high-nitrogen materials, HCl P.A., Vetec V000154). The hydrochloric acid solutions were previously standardizing using sodium carbonate solutions
(Na2CO3 anhydrous P.A., Isofar 349) as described in
method INCT-CA N-001/1 (Detmann et al., 2012). Nitrogen contents in the samples were estimated through the equation:
A f Ne B V
N=( − )× × ×14×1000 (1)
where:
N is the nitrogen content (g kg-1), V is the
volume of hydrochloric acid solution in the titration (mL), B is the volume of hydrochloric acid solution obtained in the titration of the blanks (mL), Ne is the expected normality of hydrochloric acid solution
(0.02 or 0.05 N), f is the correction factor of the
hydrochloric acid normality obtained by using sodium carbonate solutions, and A is the aliquot weight (mg).
The evaluations of the analytical standard (Lysine-HCl) were performed based on the nitrogen
recovery from the aliquots (g g-1). The actual
content of nitrogen in Lysine-HCl was established through the chemical composition of the molecule and the purity of the material. The dry matter content of the standard was performed in triplicate by the Karl Fisher titration method (Bruttel & Schlink, 2006) using the equipment 870 KF Titrino Plus (Metrohm, Herisau, Switzerland). The
nitrogen content of the standard was 137.3 g N kg-1
of dry matter.
The statistical analyses of the nitrogen recovery of the standard were performed according to the model: ijkl k ij j i
ijkl R Q RQ D
Y =
µ
+ + + + +ε
(2)where:
Yijkl is the nitrogen recovery in the aliquot l, at
day k, using salt-to-metal catalyst ratio i, and amount
of digestion mixture j; μ is the general constant; Ri is
the effect of salt-to-metal catalyst ratio in the
digestion mixture i (fixed effect); Qj is the effect of
digestion mixture amount j (fixed effect); RQij is the
interaction between the main effects (fixed effect);
Dk is the effect of the day of analysis k (random
effect); and εijkl is the random error.
Based on the results of analysis of variance, the evaluation of nitrogen recovery from the standard
was performed through Student’s t-test considering
the hypotheses:
1 :
0 µ =
H (3a)
1
:
µ
≠a
H (3b)
When the null hypothesis was accepted (3a), it was concluded that there is complete recovery of the nitrogen from the standard.
The statistical analyses of the nitrogen content and digestion time for high- and low-nitrogen materials were performed separately. It is noteworthy that the nitrogen contents were evaluated on as-is basis in order to avoid the accumulation of error from the estimation of the total dry matter content. The model was:
ijklm l ijk jk ik ij k j i ijklm D MRQ RQ MQ MR Q R M Y ε µ + + + + + + + + + + = (4) where:
Yijklm is nitrogen content or digestion time in the
aliquot m, at day l, from sample i, using salt-to-metal catalyst ratio j, and digestion mixture amount
k; μ is the general constant; Mi is the sample effect i
(fixed effect); Rj is the effect of salt-to-metal catalyst
ratio in the digestion mixture j (fixed effect); Qk is
the effect of digestion mixture amount k (fixed
effect); MRij, MQik, RQjk and MRQijk are the
interactions between the main effects (fixed effects);
Dl is the effect of the day of analysis (random effect);
and εijklm is the random error.
Subsequently, another set of analysis of variance was performed for the nitrogen content of each sample evaluated by each treatment according to the model:
j i i
ij D
Y =
µ
+ +ε
() (5)where:
Yij is the nitrogen content in the aliquot j
analysed on day i; μ is the general constant; Di is the
effect of the day of analysis i (random effect), and ε(i)j
is the random error.
The estimate of residual variance (variability between aliquots) obtained from model (5) was used to calculate the repeatability of nitrogen contents according to each treatment as follows:
100 ˆ2
× =
Y
where:
r is the standardized repeatability (%), 2
ˆε
σ is the
residual variance, and Y is the average content of
nitrogen.
All statistical procedures were carried out using the Mixed procedure of SAS 9.4 (2014) and
adopting α = 0.05. When necessary, average values
were compared using the Fisher’s Least Significant Difference.
Results and discussion
There was no variation between days of analysis (p > 0.05) for any of the evaluations, which
reinforces the aspects of robustness of the digestion
procedures evaluated.
There were no effects (p > 0.05) of the amounts of digestion mixture or ratios of salt-to-metal catalyst on the nitrogen recovery from Lysine-HCl, and all recovery estimates were found to be equal to 1 (p > 0.05; Table 1). This indicates that different salt-to-metal catalyst ratios and digestion mixture
amounts have the potential to provide complete
recovery of nitrogen in the other samples.
Table 1. Average nitrogen recovery in standard samples of HCl-Lysine according to the salt-to-metal catalyst ratio and amount of digestion mixture.
R¹ DMix (g)² Recovery (g g-1) P value³
10:1
1.0 1.004 0.713
1.5 0.999 0.905
2.0 1.004 0.677
20:1
1.0 1.001 0.960
1.5 0.990 0.325
2.0 0.988 0.220
¹R, Salt (sodium sulfate)-to-metal catalyst (copper sulfate) ratio. ²DMix, Digestion mixture
amount (the amounts are associated with 200-mg aliquots).³H0: μ = 1; Ha: μ≠ 1.
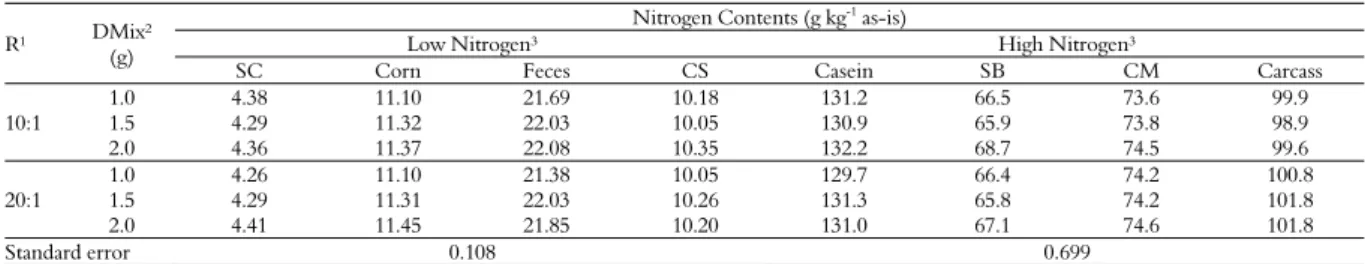
The average nitrogen contents in the low- and high-nitrogen samples are presented in Table 2. There was no effect (p > 0.05) of salt-to-metal catalyst ratio on low-nitrogen materials. However, there was an interaction (p < 0.01) between low-nitrogen material and amount of digestion mixture (Table 3). The
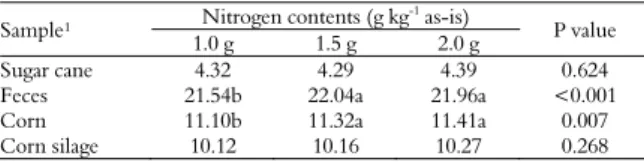
evaluation of this effect indicated that only the nitrogen content in feces and corn samples were affected (p < 0.01) by the digestion mixture amount. For both materials, nitrogen contents were greater (p < 0.05) with use of 1.5 and 2.0 g of digestion mixture compared with 1.0 g (Table 4).
This interaction seems to reflect differences in the structure and composition of the nitrogen compounds of each material. Corn protein is mainly composed of prolamines, particularly zein, which consists of a helical structure rich in glutamine, leucine, and proline, with a high index of crosslinking and hydrophobic interactions (Argos, Pedersen, Marks & Larkins, 1982; Keith & Bell, 1988). On the other hand, the nitrogen compounds from the ruminant feces are formed by indigestible microbial material, endogenous substances (e.g. keratinized tissue), and nitrogen associated with Maillard products or lignin, with low evidence of the presence of potentially digestible protein from the feed (Van Soest, 1994). Therefore, these two particular materials appear to demand a more complex process of digestion, mainly by the action of the metal catalyst. Thus, decreasing the amount of digestion mixture may have impaired nitrogen mineralization. It is noteworthy that prolamins are in lower concentrations in corn silage compared with corn grain, justifying the lack of effect of the amount of digestion mixture in the corn forage.
For high-nitrogen samples, there was an effect (p < 0.02) of the amount of digestion mixture on the nitrogen contents. On average, higher nitrogen contents were observed (p < 0.05) by
using 2.0 g (93.7 g N kg-1 as-is) compared with
using 1.0 or 1.5 g (92.8 and 92.8 g N kg-1 as-is,
respectively) of digestion mixture, which did not differ (p > 0.05) from each other. The greater demand for digestion mixture may have occurred due to the higher amount of nitrogen present in the high-nitrogen materials.
Table 2. Average nitrogen contents in low- and high-nitrogen materials according to salt-to-metal catalyst ratio and amount of digestion mixture.
R¹ DMix²
(g)
Nitrogen Contents (g kg-1
as-is)
Low Nitrogen³ High Nitrogen³
SC Corn Feces CS Casein SB CM Carcass
10:1
1.0 4.38 11.10 21.69 10.18 131.2 66.5 73.6 99.9 1.5 4.29 11.32 22.03 10.05 130.9 65.9 73.8 98.9 2.0 4.36 11.37 22.08 10.35 132.2 68.7 74.5 99.6
20:1
1.0 4.26 11.10 21.38 10.05 129.7 66.4 74.2 100.8 1.5 4.29 11.31 22.03 10.26 131.3 65.8 74.2 101.8 2.0 4.41 11.45 21.85 10.20 131.0 67.1 74.6 101.8
Standard error 0.108 0.699
Acta Scientiarum. Animal Sciences Maringá, v. 38, n. 1, p. 45-51, Jan.-Mar., 2016
Table 3. Descriptive levels of probability for type I error for the different fixed effects evaluated in low- and high-nitrogen content materials.
Effects Low Nitrogen High Nitrogen
N content DT¹ N content DT¹ Sample <0.001 <0.001 <0.001 <0.001
DMix² <0.001 <0.001 0.011 <0.001
R³ 0.217 <0.001 0.332 <0.001
Sample × DMix 0.008 0.769 0.551 0.193
Sample × R 0.297 0.625 0.002 0.323
DMix × R 0.162 0.088 0.296 0.228
Sample × DMix × R 0.684 0.611 0.738 0.743
¹DT, Digestion time. ²DMix, Digestion mixture amount (the amounts are associated with 200-mg aliquots). ³R, Salt (sodium sulfate)-to-metal catalyst (copper sulfate) ratio.
Table 4. Interaction between low-nitrogen material and amount of digestion mixture on the nitrogen content.
Sample¹ Nitrogen contents (g kg
-1 as-is)
P value 1.0 g 1.5 g 2.0 g
Sugar cane 4.32 4.29 4.39 0.624
Feces 21.54b 22.04a 21.96a <0.001
Corn 11.10b 11.32a 11.41a 0.007
Corn silage 10.12 10.16 10.27 0.268
¹Means in the rows followed by different letters differ at p < 0.05 by Fisher’s Least Significant Difference test. Standard error of the mean = 0.083.
There was an interaction (p < 0.01) between high-nitrogen material and salt-to-metal catalyst ratio (Table 3). The evaluation of this effect indicated that only the carcass sample was affected by the ratio, whose higher nitrogen content (p < 0.01) was obtained when using the 20:1 ratio (Table 5). The higher nitrogen recovery that occurred when this ratio was used could indicate an interference of the metal catalyst (copper) on conversion of organic nitrogen to ammonium sulfate. Many heterocyclic nitrogenous compounds, which are difficult to be digested, may be formed from non-enzymatic reactions involving creatine, free amino acids, and monosaccharides. The digestion procedure could be even more difficult when high-fat samples are heated (Johansson & Jägerstad, 1996; Skog, Johansson & Jägerstad, 1998). Copper and iron ions can act as catalysts in the formation of compounds such as pyrazines and pyridines, which are precursors of heterocyclic compounds (Parihar, Vasundhara & Vijayayaghavan, 1981; Jägerstad, Skog, Arvidsson & Solyakov, 1998). Additionally, the release of free radicals under the conditions described above can increase the formation of these types of nitrogenous compounds (Johansson & Jägerstad, 1996). Thus, it is hypothesized that excessive copper could favor the formation of nitrogen compounds that are difficult to digest in samples of carcass and meat, which could compromise the nitrogen recovery, as observed in this study (Table 6). Incomplete digestion of heterocyclic materials (nicotinic acid) by
the Kjeldahl method was previously reported by Etheridge, Pesti and Foster (1998).
For both types of materials (low- and high-nitrogen), there were effects (p < 0.01) of salt-to-metal catalyst ratio and amount of digestion mixture on the digestion time (Table 3). There were no interaction effects for this variable (p > 0.05). In this context, the digestion time was reduced (p < 0.05) as the digestion mixture amount was increased, with an average difference of 21.8 minutes between the amounts of 1.0 and 2.0 g (Table 6). The lower digestion time was obtained with the salt-to-metal catalyst ratio of 10:1 (p < 0.01), with an average decrease of 5.8 minutes compared with the 20:1 ratio (Table 6).
Table 5. Study of the interaction effect between high-nitrogen material and salt-to-metal catalyst ratio in the digestion mixture on the nitrogen content (g kg-1
as-is).
Sample R¹ P value
10:1 20:1
Carcass 99.5 101.5 <0.001
Casein 131.4 130.7 0.165
Cottonseed meal 74.0 74.3 0.499
Soybean meal 67.0 66.5 0.336
¹R, Salt (sodium sulfate)-to-metal catalyst (copper sulfate) ratio. Standard error of the mean = 0.430.
Table 6. Average digestion time for low- and high-nitrogen materials according to the different salt-to-metal catalyst ratios and amount of digestion mixture.
Material¹
Digestion Time (minutes) DMix (g)² ³
P value
R4
P value LN
1.0 1.5 2.0 10:1 20:1
136.2a 138.1a
122.6b 124.8b
114.9c 115.8c
<0.001 121.9 123.1
127.2 129.4
<0.001
HN <0.001 <0.001
¹LN, low-nitrogen materials; HN, high-nitrogen materials. ²DMix, Digestion mixture amount (the amounts are associated with 200-mg aliquots). ³Means in the rows, within digestion mixture, followed by different letters differ at p < 0.05 by Fisher’s Least
Significant Difference test. 4R, salt (sodium sulfate) to metal catalyst (copper sulfate)
ratio.
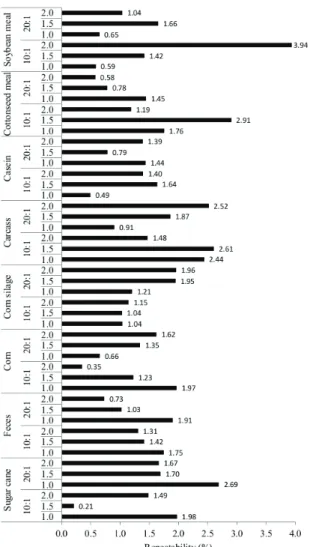
The repeatabilities obtained for both types of materials according to the different salt-to-metal catalyst ratios and amount of digestion mixture were considered low and adequate, and there was no specific pattern among the factors studied. The values ranged from 0.21 to 2.69% for low-nitrogen materials and from 0.49 to 3.94% for high-nitrogen materials (Figure 1).
Figure 1. Standardized repeatability for the different low- and high-nitrogen materials according to the salt-to-metal catalyst ratios and amounts of digestion mixture.
The apparent contradictions between the results observed for the standard (Table 1) and for the different materials (Table 3) only reflect the particular characteristics of each sample, which requires the breakdown of different organic structures before nitrogen mineralization during digestion. The total recovery of nitrogen from the standard indicates a potential for the use of any combinations evaluated in this study. However, the choice of the best combination is based on the particular characteristics of the evaluated materials, as previously discussed.
Thus, considering that the 20:1 ratio increased the nitrogen recovered from carcass (Table 5) and that the salt-to-metal catalyst ratio did not affect the other analyzed materials (Tables 3 and 5), the general use of a 20:1 ratio is recommended. Several issues, such as the difficulty in stratifying large sets of samples with different nitrogen concentrations for analysis in groups, and the possible lack of knowledge about the chemical composition of the sample, indicate that the digestion mixture amount for nitrogen recovery should be 2.0 grams, as it yields the highest nitrogen contents for both types of materials.
Conclusion
The recommended amount of digestion mixture in the digestion procedure of the Kjeldahl method is 2.0 grams for samples of approximately 200 mg. The salt (sodium sulfate)-to-metal catalyst (copper sulfate) ratio should be 20:1.
Acknowledgements
The authors wish to thank to CNPq, Fapemig, and INCT-Ciência Animal for their financial support.
References
Argos, P., Pedersen, K., Marks, M. D., & Larkins, B. A. (1982). A structural model for maize zein proteins. The
Journal of Biological Chemistry, 257(17), 9984-9990.
Bruttel, P., & Schlink, R. (2006). Water determination by
Karl Fisher titration. Herisau, Switzerland: Metrohm.
Chang, S. K. C. (1998). Protein analysis. In S. S. Nielsen (Ed.), Food analysis (2a ed., p. 237-250). West Lafayette, Indiana, USA: Aspen Publishers.
Chaves, L. H. G., Souza, R. S., Chaves, I. B., & Tito, G. A. (2009). Adsorção de metais pesados em luvissolos e cambissolos do estado da Paraíba. Engenharia Ambiental:
Pesquisa e Tecnologia, 6(2), 150-162.
Detmann, E., Souza, M. A., Valadares Filho, S. C., Queiroz, A. C., Berchielli, T. T., Saliba, E. O. S., ... Azevedo, J. A. G. (2012). Métodos para análise de
alimentos. Visconde do Rio Branco, MG: Suprema.
Etheridge, R. D., Pesti, G. M., & Foster, E. H. (1998). A comparison of nitrogen values obtained utilizing the Kjeldahl nitrogen and Dumas combustion methodologies (Leco CNS 2000) on samples typical of an animal nutrition analytical laboratory. Animal Feed
Science Technology, 73(1), 21-28.
Jägerstad, M., Skog, K., Arvidsson, P., & Solyakov A.
(1998). Chemistry, formation and occurrence of genotoxic heterocyclic amines identified in model systems and cooked foods. Zeitschrift für
Lebensmittel-Untersuchung und-Forschung A,207(6), 419-427.
mutagenic-Acta Scientiarum. Animal Sciences Maringá, v. 38, n. 1, p. 45-51, Jan.-Mar., 2016 carcinogenic heterocyclic amines in a model system.
Food Chemistry, 56(1), 69-75.
Keith, M. O., & Bell, J. M. (1988). Digestibility of nitrogen and amino acids in selected protein sources fed to mice. Journal of Nutrition, 118(5), 561-568. Parihar, D. B., Vasundhara, T. S., & Vijayayaghavan, P. V.
(1981). Effect of metal ions such as iron and copper on the formation of nitrogen heterocyclic compounds in sesame oil-α-amino acids model systems under frying conditions. Journal of Food Science and Technology, 16(3), 313-319.
SAS. (2014). SAS/STAT user guide (Version 9.4) [Software]. Cary, NC, USA: SAS Institute Inc.
Silva, D. J., & Queiroz, A. C. (2002). Análise de alimentos.
Métodos químicos e biológicos (3a ed.). Viçosa, MG:
Editora UFV.
Skog, K. I., Johansson, M. A. E., & Jägerstad, M. I. (1998).
Carcinonogenic heterociclic amines in model systems and cooked foods: a review on formation, occurrence and intake. Food and Chemical Toxicology, 36(9), 879-896. Van Soest, P. J. (1994). Nutritional ecology of the ruminant
(2nd ed.). Ithaca, NY: Cornell University Press. Windham, W. R. (1998). Animal feed. In Association of
Official Analytical Chemists-AOAC (Ed.), Official
Methods of Analysis of AOAC International (Vol. 1, 16th
ed. rev.). Gaitherburg, USA: AOAC International.
Received on September 11, 2015. Accepted on September 29, 2015.