Acta Scientiarum
http://www.uem.br/acta ISSN printed: 1806-2636 ISSN on-line: 1807-8672
Doi: 10.4025/actascianimsci.v38i4.32051
Reassessment of the suitable range of water pH for culture of Nile
tilapia Oreochromis niloticus L. in eutrophic water
Vanessa Tomaz Rebouças, Francisco Roberto dos Santos Lima, Davi de Holanda Cavalcante and Marcelo Vinícius do Carmo e Sá*
Laboratório de Ciência e Tecnologia Aquícola, Departamento de Engenharia de Pesca, Centro de Ciências Agrárias, Universidade Federal do Ceará, Av. Mister Hull, s/n, 60356-000, Fortaleza, Ceará, Brazil. *Autor para correspondência. E-mail: [email protected]
ABSTRACT. The present work aimed at reassessing the suitable range of water pH for culture of Nile tilapia, Oreochromis niloticus L. juveniles in eutrophic water. Two hundred and forty tilapia juveniles (1.37 ± 0.04 g) were stocked in twenty 250-L polyethylene tanks (12 fish per tank) for eight weeks. In the control tanks, the pH of water was not adjusted at any time, varying freely over the entire study. In the slight acidification treatment, the culture water was acidified daily to reach a water pH between 5.5 and 6.5. In the moderate acidification treatment, there were daily applications of HCl solution to reach a water pH between 4.5 and 5.5. In the alkalinization treatment, tanks received daily applications of Na2CO3 and
NaOH to achieve a water pH between 8.5 and 9.5. Acidification of water, regardless the degree, i.e., slight or moderate, was not able to significantly affect final body weight, specific growth rate and yield of fish. It can be concluded that the acidification of water up to pH 5.5 has no negative influence on growth of Nile tilapia fingerlings in eutrophic tanks. Accordingly, the suitable range of water pH for rearing Nile tilapia should be set at 5.5 – 9.0.
Keywords: pH of water, tilapia, aquaculture.
Reavaliação da faixa adequada de pH da água para o cultivo da tilápia do Nilo,
Oreochromis
niloticus
L. em águas eutróficas
RESUMO. O presente trabalho teve por objetivo reavaliar a faixa adequada de pH da água para o cultivo de juvenis da tilápia do Nilo, Oreochromis niloticus L. em águas eutróficas. Foram estocados 140 juvenis de 1,37 ± 0,04 g em 20 tanques de polietileno de 250 L por oito semanas (12 peixes por tanque). Nos tanques do grupo controle, não houve ajuste do pH da água em nenhum momento, o qual variou livremente ao longo do estudo. Nos tanques submetidos à acidificação leve, a água de cultivo foi acidificada diariamente para atingir o valor de pH entre 5,5 e 6,5. Os tanques submetidos à acidificação moderada receberam aplicações diárias de solução de HCl para manter o pH da água entre 4,5 e 5,5. Nos tanques submetidos à alcalinização, procedeu-se a aplicação diária de Na2CO3 e NaOH para manter o pH da água entre 8,5 e 9,5.
A acidificação da água, independentemente do nível empregado, i.e., leve ou moderado, não foi capaz de afetar significativamente o peso corporal final, taxa de crescimento específico e produtividade de peixe. Concluiu-se que a acidificação da água até pH 5,5 não prejudica o crescimento de juvenis de tilápia em águas eutróficas. Por consequência, a faixa de adequação de pH da água para cultivo da tilápia do Nilo deveria ser estendida para 5,5 – 9,0.
Palavras-chave: pH da água, tilápia, aquicultura.
Introduction
The pH of water can significantly affect the physiology of aquatic animals. The degree of acidity and basicity of water can stress and disrupt the normal growth of farmed fish and shrimp. Mechanisms of ionic regulation in fish are activated by variations in water pH, seeking the homeostasis and health maintenance. Acid-base disturbances in blood and body fluids can alter important metabolic parameters in fish, such as the concentrations of glycose, glycogen and lactate
(Bolner, Copatti, Rosso, Loro, & Baldisserotto, 2014; Garcia, Gutiérrez-Espinosa, Wásquez-Torres, & Baldisserotto, 2014).
In general, the suitable range of water pH for aquaculture is 6.5 – 9.0 (Boyd, Tucker, & Somridhivej, 2016). However, some fish species prefer to live in acidic waters, such as the tambaqui,
Colossoma macropomum (Cuvier) (Aride, Roubach, & Val, 2007), while others are acidic-tolerant, such as the Mozambique tilapia, Oreochromis mossambicus
362 Rebouças et al.
Acta Scientiarum. Animal Sciences Maringá, v. 38, n. 4, p. 361-368, Oct-Dec., 2016
Therefore, it is possible to have exceptions to that general rule of suitability of water pH.
According to El-Sherif and El-Feky (2009), the optimal water pH for the culture of Nile tilapia,
Oreochromis niloticus L., is 7 - 8. These authors, however, have reared tilapia fingerlings in oligotrophic clear waters, in tanks with 100% daily water exchange. Consequently, there were low concentrations of toxic metabolites in the water, such as ammonia and H2S. However, Nile tilapia
juveniles have grown surprisingly well on acidic organic-matter rich waters (pH < 6) in previous studies carried out in our laboratory (Nobre, Lima, & Magalhães, 2014; Rebouças, Lima, & Cavalcante, 2015; Silva, Santos Lima, Vale, & Carmo, 2013). Colt, Momoda, Chitwood, Fornshell, and Schreck (2011) have also found that O. niloticus could be transferred from pH 6 – 7 to as low as pH 4.2 without problems. Due to the discrepancy between these results and those reported by Sherif and El-Feky (2009).
The present work was carried out aiming to reassess the suitable range of water pH for culture of Nile tilapia juveniles in eutrophic waters.
Material and methods
Masculinized Nile tilapia juveniles with body weight between 1 – 2 g were obtained from a regional producer and transported to the laboratory facilities, where they were maintained for four days in one 1,000-L tank for acclimation. In this phase, the animals were fed on four times daily at 0800, 1100, 1400 and 1700 with a commercial diet for omnivorous tropical fish containing 43.4% crude protein at 10% body weight daily.
At the onset of the experiment, two hundred and forty tilapia juveniles (1.37 ± 0.04 g) were stocked in twenty 250-L polyethylene tanks (12 fish per tank) for eight weeks. Fish were fed daily with appropriate commercial diets at 1000, 1300, 1500 and 1700, on feeding rates that ranged from 8.9% (initial) to 3.9% (final) body weight. No mechanical aeration was provided to the tanks throughout the experimental period. There was also no water exchange, just replenishment to maintain the initial water level. The bottom of the tanks was filled with a 5-cm layer of gross sand to allow water-soil interactions.
The experimental design consisted of three treatments and one control group, each one with five replicates. In the control tanks, the pH of water was not adjusted at any time, varying freely over the entire study. In the slight acidification treatment, the culture water was acidified daily with a 3.6 N HCl
solution in order to reach a water pH between 5.5 and 6.5. In the moderate acidification treatment, there were daily applications of HCl solution to obtain a water pH between 4.5 and 5.5. Finally, in the alkalinization treatment, tanks received daily applications of Na2CO3 (12 g) and 1 N NaOH (9
mL), in order to achieve a water pH between 8.5 and 9.5. At each day, the dosages of HCl, Na2CO3 and
NaOH used were adjusted to reach the designed pH for each treatment (slight acidification, moderate acidification and alkalinization). The acidic and alkaline solutions had their total volumes split in three equal doses, which were delivered at 0800, 0830 and 0900. The water pH at 0730 was used to define the amounts of the acidic or alkaline solutions used on that specific day. A second pH reading was performed daily at 1500. The reported pH of water was the mean value of those two determinations.
The water quality of the culture tanks was monitored by regular observations of the following variables: (1) temperature and specific conductance at 0800 and 1600 (conductivity meter CD-4303 – Lutron), (2) dissolved oxygen – DO (0800; Winkler method with azide modification), (3) free CO2
(titration with Na2CO3 standard solution), (4) total
ammonia nitrogen (TAN; indophenol method), (5) NH3 (estimated by the Emerson’s formula as
presented by El-Shafai, El-Gohary, Nasr, van der Steen, and Gijzen (2004), (6) nitrite (sulfanilamide method), (7) reactive phosphorus (molybdenum blue method), (8) total alkalinity (titration with H2SO4 standard solution), (9) total hardness
(titration with EDTA standard solution), (10) soluble iron (colorimetric Herapath method) and (11) H2S (titration of total sulfide – TS with
standard Na2S2O3 solution and estimation of H2S
according to Boyd (2000). Water quality variables were monitored daily (1), weekly (2-6) and fortnightly (7 - 11). All water quality determinations were carried out according to APHA (2014).
The soil pH and organic carbon concentration were determined every other week following the guidelines provided by Boyd, Wood, and Thunjai (2002). In the seventh experimental week, the pH and concentrations of DO, TAN, TS and H2S in
water were observed on a diel basis. For that, water samples were taken from the culture tanks every two (pH, DO, TS and H2S) or four (TAN and NH3)
hours. The growth performance variables analyzed were the following: survival (%), final body weight (g), specific growth rate (% day-1; SGR = [Ln (final
weight) – Ln (weight initial)]-1 days of culture) x
100), fish yield (g m-3 day-1) and feed conversion
Metabolic performance of fish was assessed by the respiratory rate using 2.5-L respirometers (Barbieri, Passos, & Garcia, 2005). Weekly, from the third experimental week, one fish from each treatment was allotted to one respirometer. For that, one animal was withdrawn from each tank and those individuals not used for the respirometer assays were discarded. Each respirometer was filled up with 2.0-L filtered water taken from the culture tanks. Initially, air was bubbled into the respirometer water for one hour and the resulting concentration of dissolved oxygen in water was measured. Next, one fish was placed inside the respirometer for four hours. After that, the DO concentration in the respirometer water was measured by the Winkler method with azide modification. The respiratory rate in μg DO g-1 fish
h-1 was obtained by the following equation:
respiratory rate = [(DOi – DOf)-1 fish body weight
(g) 4h-1] x 2 L (respirometer volume), where DO i is
the initial concentration of DO and DOf is the
concentration of DOin the respirometer water after 4 hours.
The results were analyzed by one-way ANOVA. When a significant difference was detected between the treatments (p < 0.05), the means were compared pairwise by Tukey’s test, for equal-variance variables, or Games-Howell’s test, for non-equal variance variables. The assumptions of normal distribution (Shapiro-Wilk’s test) and homogeneity of variance (Levene’s test) were checked before analysis. The SPSS v.15.0 and Windows Excel 2010 software were used for the statistical analyses.
Results and discussion
Water and soil quality
The temperature and concentration of dissolved oxygen in water were not significantly affected by water acidification (slight and moderate) and alkalinization (Table 1). The average temperature of water at 0800 and 1600 were 27.6 ± 0.40°C (27.0 – 28.6°C) and 30.8 ± 1.14°C (28.2 – 33.3°C), respectively. In the last week, the average concentration of DO in water was 4.5 ± 1.9 mg L-1
(1.8 – 7.6 mg L-1). Therefore, it seems that the
acidification and alkalinization procedures have not impaired the release of O2 by photosynthesis to the
water. The acidification of water has increased the concentrations of free CO2 in the tanks. The highest
concentration of free CO2 (23.7 mg L-1) was found
in the moderately acidified tanks. On the other hand, the alkalinization of water has reduced the concentrations of free CO2 in water (Table 1). It is
accepted that concentrations of free CO2 in water
above 20 mg L-1 may be stressful to fish (Danley,
Kenney, Mazik, Kiser, & Hankins, 2005). However, it has probably not affected Nile tilapia fingerlings because they have reached the highest final body weight only in the moderately acidified tanks (23.4 ± 1.3 g; Table 2).
The specific conductance (SC) of water increased with the acidification and, mainly, alkalinization of water. The ionic concentration or salinity of water is the main factor responsible for the water SC. However, once the isosmotic point for Nile tilapia is near 12 g L-1 (Hassan et al., 2013)
and the highest TDS (total dissolved solids) of water in the present work was 870 gm L-1, these minor
variations in SC of water have probably not affected the tilapia physiology.
The acidification of water has decreased the total alkalinity (TA) of water in direct proportion with the level of acidification (Table 1). The average TA of water was 13.5 ± 2.0 and 5.4 ± 1.7 mg L-1 CaCO
3
eq. for the slight and moderate acidification, respectively.
A minimum TA of 20 mg L-1 CaCO
3 eq. is
required for an acceptable water pH buffering in aquaculture tanks (Boyd et al., 2016). In the present work, however, since the pH of water was deliberately controlled to reach certain levels, the effect of low TA on water pH was null. While the acidification of water has increased the total hardness (TH), the alkalinization has reduced it (Table 1). The highest TH of 223.4 mg L-1 CaCO
3
was found in one of the moderately acidified tanks; the lowest TH of 102.7 mg L-1 CaCO
3 was found in
one of the tanks subjected to alkalinization. Boyd et al. (2016) recommended TH between 40 – 300 mg L-1 CaCO
3 for aquaculture production. Therefore,
the values of TH for both the acidified and alkaline tanks have remained within the appropriate range.
The acidification of water has increased significantly the concentrations of TAN in water. On the other hand, the alkalinization of water had no significant effect on TAN (Table 1). The average TAN concentrations were 0.57 ± 0.17 mg L-1 (0.47
– 0.82 mg L-1) and 0.49 ± 0.18 mg L-1 (0.28 – 0.62
mg L-1) for the slight and moderate acidification,
respectively. Boyd (2001) mentions TAN concentrations higher than 3 – 4 mg L-1 as toxic to
warm-water aquaculture organisms in waters with pH > 8.5 – 9.0. Therefore, the highest concentration of TAN (0.82 mg L-1) verified in the
present study is still far below the TAN critical levels indicated by the literature. As the water was acidified, the concentrations of NH3 in water have
364 Rebouças et al.
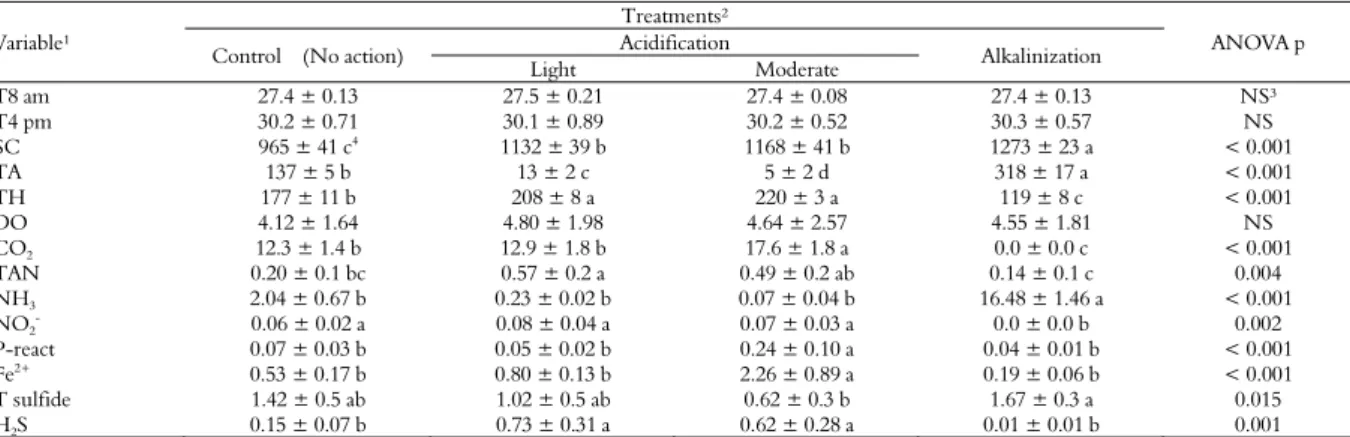
Acta Scientiarum. Animal Sciences Maringá, v. 38, n. 4, p. 361-368, Oct-Dec., 2016 Table 1. Water quality in Nile tilapia outdoor tanks after eight weeks of culture (mean ± SD; n = 5).
Variable¹
Treatments²
ANOVA p
Control (No action) Acidification Alkalinization
Light Moderate
T8 am 27.4 ± 0.13 27.5 ± 0.21 27.4 ± 0.08 27.4 ± 0.13 NS³
T4 pm 30.2 ± 0.71 30.1 ± 0.89 30.2 ± 0.52 30.3 ± 0.57 NS
SC 965 ± 41 c4
1132 ± 39 b 1168 ± 41 b 1273 ± 23 a < 0.001
TA 137 ± 5 b 13 ± 2 c 5 ± 2 d 318 ± 17 a < 0.001
TH 177 ± 11 b 208 ± 8 a 220 ± 3 a 119 ± 8 c < 0.001
DO 4.12 ± 1.64 4.80 ± 1.98 4.64 ± 2.57 4.55 ± 1.81 NS
CO2 12.3 ± 1.4 b 12.9 ± 1.8 b 17.6 ± 1.8 a 0.0 ± 0.0 c < 0.001
TAN 0.20 ± 0.1 bc 0.57 ± 0.2 a 0.49 ± 0.2 ab 0.14 ± 0.1 c 0.004
NH3 2.04 ± 0.67 b 0.23 ± 0.02 b 0.07 ± 0.04 b 16.48 ± 1.46 a < 0.001
NO2- 0.06 ± 0.02 a 0.08 ± 0.04 a 0.07 ± 0.03 a 0.0 ± 0.0 b 0.002
P-react 0.07 ± 0.03 b 0.05 ± 0.02 b 0.24 ± 0.10 a 0.04 ± 0.01 b < 0.001
Fe2+ 0.53 ± 0.17 b 0.80 ± 0.13 b 2.26 ± 0.89 a 0.19 ± 0.06 b < 0.001
T sulfide 1.42 ± 0.5 ab 1.02 ± 0.5 ab 0.62 ± 0.3 b 1.67 ± 0.3 a 0.015
H2S 0.15 ± 0.07 b 0.73 ± 0.31 a 0.62 ± 0.28 a 0.01 ± 0.01 b 0.001
1T8 am and T4 pm: temperature at 8 am and 4 pm (°C), SC: specific conductance (μS cm-1), TA and TH: total alkalinity and total hardness (mg L-1 CaCO
3), DO: dissolved oxygen (mg
L-1), CO
2: free carbon dioxide (mg L-1), TAN: total ammonia nitrogen (mg L-1), NH3: non-ionized ammonia (μg L-1), NO2-: nitrite (mg L-1), P-react: reactive phosphorus (mg L-1),
Fe+2: soluble iron (mg L-1), T sulfide: total sulfide (mg L-1) and H
2S: unionized hydrogen sulfide (mg L-1); 2Slight acidification: a 3.6 N HCl solution was routinely applied to the
culture water to reach a pH between 5.5 and 6.5 (pH = 6.6 ± 0.8). Moderate acidification: a 3.6 N HCl solution was routinely applied to the culture water to reach a pH between 4.5 and 5.5 (pH = 5.5 ± 1.2). Alkalinization: a 1 N NaOH solution plus Na2CO3 were routinely applied to the culture water to reach a pH between 8.5 and 9.5 (pH = 9.2 ± 0.4). The pH
of water in the control tanks was not adjusted and averaged 8.2 ± 0.4; 3Non-significant (ANOVA p = 0.631, 0.989 and 0.958 for T8 am, T4 pm and DO
2, respectively);
4For the same
variable, means with distinct letters are significantly different by Tukey’s (SC, TH, TAN and T sulfide) or Games-Howell’s test (TA, CO2, NH3, NO2-, P-react, Fe+2, H2S).
Table 2. Growth performance of Nile tilapia juveniles after eight rearing weeks (mean ± SD; n = 5).
Variables¹
Treatments²
ANOVA p Control
(No action)
Acidification
Alkalinization Light Moderate
Survival 94.3 ± 7.8 97.1 ± 6.4 97.1 ± 6.4 91.4 ± 7.8 NS³
IBW 1.36 ± 0.04 1.39 ± 0.02 1.36 ± 0.05 1.36 ± 0.03 NS
FBW 20.5 ± 2.0 ab4 20.5 ± 1.9 ab 23.4 ± 1.3 a 19.8 ± 21.5 b 0.023
SGR 5.3 ± 0.2 ab 5.3 ± 0.2 ab 5.6 ± 0.1 a 5.2 ± 0.2 b 0.032
FY 9.7 ± 1.5 ab 9.9 ± 1.1 ab 11.3 ± 0.9 a 9.0 ± 0.6 b 0.023
FCR 1.12 ± 0.10 1.09 ± 0.07 1.03 ± 0.05 1.13 ± 0.04 NS
1
Survival (%), IBW: initial body weight (g), FBW: final body weight (g), SGR: specific growth rate (% day-1
), FY: fish yield (g m-3
day-1
). FCR: feed conversion rate (feed allowance/body weight gain); 2 Slight acidification: a 3.6 N HCl solution was routinely applied to the culture water to reach a pH between 5.5 and 6.5 (pH = 6.6 ± 0.8). Moderate acidification: a 3.6 N
HCl solution was routinely applied to the culture water to reach a pH between 4.5 and 5.5 (pH = 5.5 ± 1.2). Alkalinization: a 1 N NaOH solution plus Na2CO3 were routinely applied
to the culture water to reach a pH between 8.5 and 9.5 (pH = 9.2 ± 0.4). The pH of water in the control tanks was not adjusted and averaged 8.2 ± 0.4; 3Non-significant (ANOVA p =
0.547, 0.340 and 0.125 for survival, IBW and FCR, respectively); 4For the same variable, means with distinct letters are significantly different by Tukey’s (FBW, SGR) or
Games-Howell’s test (FY).
The acidification of water has not significantly affected the concentrations of nitrite in water when compared to the control tanks (Table 1), which, in general, were very low (0.04 – 0.12 mg L-1).
Interestingly, the concentrations of nitrite have been zeroed in the alkalinized tanks. Yanbo, Wenju, Weifen, and Zirong (2006) have determined the 96-h LC50 nitrite for Nile tilapia at 28.2 mg L-1.
Therefore, the safe concentration of nitrite for tilapia in freshwater is 0.3 mg L-1 (1% 96-h LC
50).
Accordingly, the concentrations of nitrite found herein (0.12 mg L-1) have probably caused no
damage to fish.
There were significant increases in the concentrations of reactive phosphorus and dissolved iron in water by the moderate acidification implemented. The slight acidification and alkalinization of water had no expressive effect on the phosphorus and Fe2+ concentrations (Table 1).
The water acidification has led to soil acidification: the pH of soil in the control and moderately acidified tanks were 7.9 ± 0.5 (7.3 – 8.9) and 6.4 ± 1.1 (4.6 – 7.6), respectively. The increase in the concentrations of phosphorus and iron in water in
the moderately acidified tanks may be explained by the release of these ions from the acidic soils into the water (Falagán, Sánchez-España, & Johnson, 2014). The concentrations of organic carbon in soil were not significantly affected by the treatments (ANOVA p < 0.05). At the end, these concentrations were 0.35% ± 0.16 (control), 0.33% ± 0.09 (slight acidification), 0.33% ± 0.10 (moderate acidification) and 0.30% ± 0.08 (alkalinization).
The acidification of water, either slight or moderate, promoted an increase in H2S
concentrations of water (Table 1). The alkalinization of water had no significant effect on that variable. It is possible that the ions Fe+2 and S-2 have been
released together to the water along the soil acidification (Lahav, Ritvo, Slijper, Hearne, & Cochva, 2004). While the average concentrations of H2S in water were 0.73 ± 0.31 mg L-1 and 0.62 ±
0.28 mg L-1 for the slightly- and
moderately-acidified tanks, respectively, H2S levels as high as
0.96 mg L-1 were detected in the acidified tanks.
Exposure to 0.1 – 0.5 mg H2S L-1 caused severe
catfish tilapia g the hig suggest resilien Diel mo Ove remain acidifie 0.1, res express acidifie for the resemb suggest acidific alkalini affected Figure 1 of Nile ti
DO modera those o the con signific the oth a maxim at 1400 L-1 at th
but no since th
(Hargreaves growth has no gh H2S levels f
ted that Nile nt organisms.
nitoring
er the diel m ed almost c ed and alkalini
spectively). On sive increase ed tanks at 140 water pH in bled that verif
ts that out of t cation, mo
ization, the fir d the phytopla
1. Diel monitorin ilapia tanks (n = 5
O variations in ate) in the di observed for t ncentrations o cantly more in hers (Figure 1)
mum DO con 0, the alkalinize he same time. I o advantage w he growth per
& Tomasso, ot been signifi found in the p e tilapia finge
monitoring, th constant in zed tanks (5.3 n the other ha
in water pH 00 (Figure 1).
the slightly a fied in the co the three treat oderate acid
rst was the on nkton dynami
g of pH and disso 5)
n the acidified iel cycle were the control ta of DO in wat n the alkaliniz
. While the ot ncentration of ed tanks achiev
It is difficult to was found for rformance in t
2004). Since icantly affected present study,
erlings are H
he pH of w the modera 3 ± 0.1 and 9. and, there was H in the slig
The diel pat acidified tanks ontrol tanks. T tments, i.e., sl dification ne that minim ics in the tanks
olved oxygen in w
tanks (slight e very similar anks. Remarka
er have increa zed tanks than ther tanks reac f 8.8 ± 1.8 mg ved 12.4 ± 2.1 o explain that f tilapia juven the alkalized ta
the d by it is H2
S-water ately 2 ± s an ghtly tern has That light and mally s. water and r to ably, ased n in ched g L-1
mg fact, niles, anks was (Tabl T contr moni water the m excep NH3
obser
Figure NH3 i
T for fi 2004) migh along V betwe The t ± 0.5 and d 1800. 5.49 conce deter fell ag was acidif conce conce moni sulfid
similar to tha le 2).
The concentrat rol and alkalin
itoring. On th r were higher i moderately ac pt for the alka concentration rved over the d
e 2. Diel monitor n water of Nile til
The maximum sh is supposed ). Therefore, ht have suffere g the 24-h cycl Variations in to een the treatm total sulfide co 52 mg L-1 at 08
decreased after . Next, there w
± 0.75 mg entrations as rmined. Then gain up to 0.46 detected in s fied tanks entrations of entrations of itoring, since de increases as t
at observed in
ions of TAN r nized tanks th he contrary, th
in the acidified idified, than alinized tanks.
ns as high as diel monitorin
ring of total ammo lapia tanks (n = 5
m tolerable con d to be 0.1 mg fish stocked i ed stress by NH
le.
tal sulfide leve ments along th
oncentrations 800 to 4.07 ± rwards up to 0
was a pronou L-1 at 2400
high as 7 , the total sul 6 ± 0.40 at 08 some tanks (F
(slight and H2S in water
f total sulfid the proportio the pH of wate
n the control
remained low hroughout th he levels of TA
d tanks, especi in the other In the latter s 0.14 mg L-1
ng (Figure 2).
onia nitrogen (TA 5).
ncentration of L-1 (El-Shafai
in alkalinized H3 in some in
els were very s he diel monit increased from
0.75 mg L-1 at
.91 ± 0.78 mg nced increase (midnight), 7.9 mg L-1
lfide concentr 800, when no s Figure 3). Fo moderate), r have matche de over the on of H2S in er drops (Boyd
l ones in the he diel AN in ally in tanks, tanks, were AN) and
f NH3
i et al., tanks nstants similar toring. m 1.13 t 1000 g L-1 at
A 2 0 w F N f t t t F t g f w 366 Acta Scientiarum
2016). On the H2S were reg
0.42 mg L-1) an
was detected i
Figure 3. Diel m Nile tilapia tanks
Respirometer p
Except for fish in the al than fish sto (284.4 and 12 the consumpt respirometers treatments and (Figure 4).
Figure 4. Consu to respirometers o
There was g fish-1 h-1, in
fish-1 h-1, in th
with Van Dijk
m. Animal Scienc
e other hand, gistered in the nd almost no H n the alkaliniz
monitoring of tota (n = 5).
erformance
r the second ex lkalinized tank ocked in mod 25.5 μg DO g
ion rates of D were very d control grou
mption rate of di over four hours.
a decrease fro the 3rd week,
he last week ( k, Van Den Th
ces
lower concen e control tank H2S (0.03 ± 0
zed ones (Figur
al sulfide and H2
xperimental w ks consumed derately acidi g fish-1 h-1, res
DO by fish allo similar bet up (non-action
ssolved oxygen by
om 310.3 ± 1 to 101.5 ± 6.2 (8th). These re
hillart, and Bon
ntrations of ks (0.42 ± .02 mg L-1)
re 3).
2S in water of
week, when more DO ified water
spectively), otted to the tween the
) over time
y fish allotted
0.8 μg DO 2 μg DO g esults agree nga (1993),
M
who have sh the metabol (OC) when suggested th to cope wit alkalinized (decreased M fish were a waters, eith similar way The general was probabl uptake with Growth perfo Fish sur were not sig or alkaliniza these results ± 0.05, re regardless th not able to specific grow
Therefor fingerlings c low as 5.5. significantly to the m Consequent more toleran
The resu those obtain (2013), No (2015), but d who conclu culture of N pointed out the research (2009) and t water. Whil Nile tilapia j eutrophic w outdoor tan the differen and concen growth (Bag interactions nonexistent by El-Sheri conclusion culture of N inaccurate o green waters
Maringá, v. 38, n
hown that tila lic rate (MR)
exposed to ac hat (1) the ini th pH stress w
(increased M MR and OC) able to adapt her acidified y between the
l reduction in ly due to the n increasing bod
ormance
rvival and fee gnificantly affe ation of wate s were satisfact spectively. Th he degree, i.e o significantly
wth rate and yi re, it can be s can grow well
These same y lower in the a oderately aci tly, Nile tilap nt to acidic tha ults of growth ned by Colt bre et al. (20 disagree to El-uded that the o Nile tilapia, O.
elsewhere, th h conducted the present stu le the former juveniles in ol waters. In natur nks, several in t water quality ntrations of N
garinao & Lan were prob in the transp f and El-Feky
that the opt Nile tilapia, O.
on a diverse cu s.
R
n. 4, p. 361-368,
apia O. mossam
and oxygen c idic waters. Th itial strategy o was different MR and OC) ) tanks and (2 t to the pH-or alkalinized e treatments n oxygen uptak normal reducti
dy size (1 to 20
ed conversion ected by either er (Table 2). tory, 95.0% ± he acidificatio
., slight or m affect final b ield of fish. suggested that in green water variables, ho alkalinized tan idified ones pia fingerlings an to alkalinize h performance et al. (2011), 014) and Reb -Sherif and El-optimum wate
niloticus, is 7 - he main differe by El-Sherif udy is the qual r authors hav ligotrophic wa re, as well as in nteractions oc y factors, such NH3 and H2
ntin-Olaguer, bably minima
arent water ta y (2009). The imum water
niloticus, is 7 ulture environm
Rebouças et al.
Oct-Dec., 2016
mbicus reduces consumption herefore, it is f Nile tilapia between the ) and acidic 2) over time,
-manipulated d, in a very
and control. ke with time
on in oxygen 0 g).
n rate (FCR) r acidification
On average, 2.7 and 1.09 on of water, moderate, was
body weight,
t Nile tilapia rs with pH as owever, were nks compared
(Table 2). seem to be ed waters. e corroborate
, Silva et al. bouças et al. -Feky (2009), er pH for the 8. As already ence between and El-Feky lity of rearing ve reared the aters, we used
n aquaculture ccur between h as water pH
2S, and fish
1998). These al or even anks analyzed
Conclusion
The acidification of water up to pH 5.5 has not affected the growth performance of Nile tilapia fingerlings in eutrophic tanks. Accordingly, the suitable range of water pH for rearing Nile tilapia should be extended from 6.5 – 9.0 to 5.5 – 9.0.
Acknowledgements
We would like to thank CNPq (National Council for Scientific and Technological Development, Brasília, DF, Brazil), CAPES (Coordination for the Improvement of Higher Education Personnel, Brasília, DF, Brazil) and FUNCAP (Fundação Cearense de Apoio ao Desenvolvimento Científico e Tecnológico, Fortaleza, CE, Brazil) for scholarship and financial support to conduct this research.
References
American Public Health Association [APHA]. (2014).
Standard methods for the examination of water and wastewater (Vol. 20). New York, NY: APHA.
Aride, P. H. R., Roubach, R., & Val, A. L. (2007). Tolerance response of tambaqui Colossoma macropomum (Cuvier) to water pH. Aquaculture Research, 38(6), 588-594.
Bagarinao, T., & Lantin-Olaguer, I. (1998). The sulfide tolerance of milkfish and tilapia in relation to fish kills in farms and natural waters in the Philippines.
Hydrobiologia, 382(1-3), 137-150.
Barbieri, E., Passos, E. A., & Garcia, C. A. B. (2005). Use of metabolism to evaluate the sublethal toxicity of mercury on Farfantepaneus brasiliensis larvae (Latreille 1817, Crustacean). Journal of Shellfish Research, 24(4), 1229-1233.
Bolner, K. C. S., Copatti, C. E., Rosso, F. L., Loro, V. L., & Baldisserotto, B. (2014). Water pH and metabolic parameters in silver catfish (Rhamdia quelen).
Biochemical Systematics and Ecology, 56, 202-208. Boyd, C. E. (2000). Water quality: an introduction Boston,
MA: Springer Science & Business Media.
Boyd, C. E. (2001). Water quality standards: total ammonia nitrogen. The Advocate, 4(4), 84-85.
Boyd, C. E., Tucker, C. S., & Somridhivej, B. (2016). Alkalinity and hardness: critical but elusive concepts in aquaculture. Journal of the World Aquaculture Society, 47(1), 6-41.
Boyd, C. E., Wood, C. W., & Thunjai, T. (2002).
Aquaculture pond bottom soil quality management. Corvallis, OR: Oregon State University.
Colt, J., Momoda, T., Chitwood, R., Fornshell, G., & Schreck, C. (2011). Water quality in tilapia transport: from the farm to the retail store. North American Journal of Aquaculture, 73(4), 426-434.
Danley, M. L., Kenney, P. B., Mazik, P. M., Kiser, R., & Hankins, J. A. (2005). Effects of carbon dioxide exposure on intensively cultured rainbow trout
Oncorhynchus mykiss: physiological responses and fillet attributes. Journal of the World Aquaculture Society, 36(3), 249-261.
El-Shafai, S. A., El-Gohary, F. A., Nasr, F. A., van der Steen, N. P., & Gijzen, H. J. (2004). Chronic ammonia toxicity to duckweed-fed tilapia (Oreochromis niloticus). Aquaculture, 232(1), 117-127.
El-Sherif, M. S., & El-Feky, A. M. I. (2009). Performance of Nile tilapia (Oreochromis niloticus) fingerlings. I. Effect of pH. International Journal of Agriculture & Biology, 11, 297-300.
Falagán, C., Sánchez-España, J., & Johnson, D. B. (2014). New insights into the biogeochemistry of extremely acidic environments revealed by a combined cultivation-based and culture-independent study of two stratified pit lakes. FEMS Microbiology Ecology, 87(1), 231-243.
Furukawa, F., Watanabe, S., Inokuchi, M., & Kaneko, T. (2011). Responses of gill mitochondria-rich cells in Mozambique tilapia exposed to acidic environments (pH 4.0) in combination with different salinities.
Comparative Biochemistry and Physiology Part A: Molecular & Integrative Physiology, 158(4), 468-476.
Garcia, L. d. O., Gutiérrez-Espinosa, M., Wásquez-Torres, W., & Baldisserotto, B. (2014). Dietary protein levels in Piaractus brachypomus submitted to extremely acidic or alkaline pH. Ciencia Rural, 44(2), 301-306. Hargreaves, J. A., & Tomasso, J. R. (2004). Environmental
biology. Developments in Aquaculture and Fisheries Science, 34, 36-68.
Hassan, B., El-Salhia, M., Khalifa, A., Assem, H., Al Basomy, A., & El-Sayed, M. (2013). Environmental isotonicity improves cold tolerance of Nile tilapia,
Oreochromis niloticus, in Egypt. The Egyptian Journal of Aquatic Research, 39(1), 59-65.
Lahav, O., Ritvo, G., Slijper, I., Hearne, G., & Cochva, M. (2004). The potential of using iron-oxide-rich soils for minimizing the detrimental effects of H2S in
freshwater aquaculture systems. Aquaculture, 238(1), 263-281.
Nobre, M. K. B., Lima, F. R. S., & Magalhães, F. B. (2014). Alternative liming blends for fish culture. Acta Scientiarum. Animal Sciences, 36(1), 11-16.
Rebouças, V. T., Lima, F. R. S., & Cavalcante, D. H. (2015). Tolerance of Nile tilapia juveniles to highly acidic rearing water. Acta Scientiarum. Animal Sciences, 37(3), 227-233.
Silva, F. J. R., Santos Lima, F. R., Vale, D. A., & Carmo, M. V. (2013). High levels of total ammonia nitrogen as NH 4+ are stressful and harmful to the growth of Nile tilapia juveniles. Acta Scientiarum. Biological Sciences, 35(4), 475-481.
368 Rebouças et al.
Acta Scientiarum. Animal Sciences Maringá, v. 38, n. 4, p. 361-368, Oct-Dec., 2016
acidification on the oxygen consumption pattern of fish. Comparative Biochemistry and Physiology Part C: Comparative Pharmacology, 105(3), 421-427.
Yanbo, W., Wenju, Z., Weifen, L., & Zirong, X. (2006). Acute toxicity of nitrite on tilapia (Oreochromis niloticus) at different external chloride concentrations. Fish Physiology and Biochemistry, 32(1), 49-54.
Received on May 24, 2016. Accepted on July 27, 2016.