INTRODUCTION
Sampling marine habitats with minimal lasting inter-ference effects is fundamental for studies in ecology. Underwater visual census (VC), firstly used by Brock (1954) in a pioneering study on Hawaiian fishes, are nowadays applied to different types of fish ecology stud-ies (Edgar et al. 2004), including those on assemblage structure (Prochazka 1998), ecological processes (Nana-mi & Nishihira 2003) and biogeographic patterns (Gas-parini & Floeter 2001). Biases in sampling introduced by visual census are however recognized by most authors and there have been a number of suggestions on how to reduce them (Luckhurst & Luckhurst 1978, Sale & Sharp 1983, Bellwood & Alcala 1988, Lincoln Smith 1988, Kulbicki 1990, Samoilys & Carlos 2000). In particular, when dealing with cryptobenthic species, the use of small areas and minimum fish sizes (e.g. recording only fishes l a rger than 5 cm) have been appointed as possible solu-tions to reduce bias (Harmelin-Vivien et al. 1985). How-e v How-e r, traditional VC biasHow-es rHow-emain to bHow-e fully tHow-estHow-ed (Edgar et al. 2004).
Traditional visual census methods have been frequent-ly used to count benthic and nektobenthic fishes but it is generally accepted that they cannot correctly sample cryptobenthic fish species (Sale & Douglas 1981, Brock 1982, Willis 2001). Miller (1979) defined cryptobenthic fish as “small bodied fish that exploit restricted habitats where food and shelter are obtained in, or in relation to, conditions of substrate complexity and/or restricted living space, with a physical barrier likely to be interposed between the small fish and sympatric predators”. As sug-gested by different authors, habitat complexity can
great-ly influence the observed distribution patterns of crypto-benthic fish assemblages (Harmelin-Vivien et al. 1 9 8 5 , Connell & Jones 1991). However, many of the studies that tried to assess biases in counting fish have mainly dealt with tropical species (Sale & Douglas1981, Brock 1982, Fowler 1987, Lincoln Smith 1988, Bortone et al. 1989, Kulbicki 1990, Samoilys & Carlos 2000) and visu-al in situ evvisu-aluation methods of fish populations were essentially developed in tropical environments. Coral reefs in particular are amongst the most diverse marine habitats where numerous species can typically be found in a relatively small area (Ackerman & Bellwood 2000). It is thus conceivable that the use of the same techniques in temperate regions may offer different results. Given that some microhabitats are composed of small movable items that create interstitial spaces where many of the cryptobenthic fish hide (Gonçalves et al. 2002) it may be worthwhile to include a more thorough sampling of par-ticular microhabitat types in the visual census techniques.
In this paper we have two main goals. First compare the performance of a traditional censusing technique and a modified visual technique to anaesthetic sampling by randomly sampling the rocky bottom. Second, compare the performance of the modified technique and the quan-titative (anaesthetic) sampling across microhabitat types.
MATERIAL AND METHODS
This study was performed during January and February 2004 in the Arrábida Marine Park (Portugal) at two stations, Risco ( 3 8 º 2 7 ’ 0 3 ’’N, 9º01’24’’W) and Cozinhadouro (38º26’54’’ N , 9 º 0 2 ’ 1 2 ’’W), which were characterized by the highest diversity
AN INTERFERENCE V I S U A L CENSUS TECHNIQUE APPLIED
TO CRY P TOBENTHIC FISH ASSEMBLAGES
R. BELDADE, E. J. GONÇALVES
Eco-Ethology Research Unit, Instituto Superior de Psicologia Aplicada, R. Jardim do Tabaco 34, 1149-041 Lisboa, Portugal [email protected]
A B S T R A C T. – We compare the accuracy of an interference visual census technique (IVC), in which dismantling of the habitat is performed, to traditional underwater visual census (VC) and anaesthetic census. We compare the performance of these techniques applied to a temperate cryptobenthic fish assemblage using two strategies: sampling over the whole depth extent of the rocky bottom, and stratified sampling over the main microhabitats present at the study site. T h e number of species encountered was lower using the traditional VC. Fish density estimates were significantly higher using the interference technique compared to the traditional VC, in the tran-sect strategy. These differences were larger for clingfishes and some gobies which occurred preferably under cobble and small rocks. No differences were found when comparing the IVC and anaesthetic census in the habitat strategy, for each microhabitat considered. We conclude that dismantling the habitat increases the performance of the visual census technique and is therefore a valuable approach when applied to temperate cryptobenthic fish assemblages.
CRYPTOBENTHIC FISH ASSEMBLAGES VISUAL CENSUS METHODS
of coastal fish species (Gonçalves et al. 2003). The highly het-erogeneous underwater habitats result from the disintegration of calcareous cliffs that border the shoreline. Different microhabi-tats: sand, gravel, cobble, small rocks (< 30 cm) and large rocks ( > 30 cm), were patchily distributed on this area. Fish sampling was performed in the morning with good sea-weather condi-tions. The local cryptobenthic fish species were easily identified according to distinct morphological and colouration characteris-tics, except for the gobiesocids Lepadogaster lepadogaster a n d
L. purpure a. Since it is very difficult to distinguish between
these species in the field (Henriques et al. 2002), they were gen-erally indicated as L e p a d o g a s t e r sp. Data on the cryptobenthic fish assemblage was collected using three techniques:
Visual Census (VC): This technique has been used by several
authors (Harmelin-Vivien et al. 1985, Willis 2001, La Mesa e t
a l. 2004, La Mesa & Vacchi 2005). In a 0.25 m2quadrat the
observer recorded all fish, taking note of the microhabitat where they were firstly seen. The use of a flashlight allowed the observer to look for fish inside clefts and small holes but no habitat manipulation was performed.
I n t e r f e rence Visual Census (IVC): This technique was applied
to the same quadrats as the VC. After counting all visible fish over the substrate (VC) we systematically looked for fish hidden under rocks and cobbles, buried in gravel or sand. This technique was therefore not strictly a “visual” technique since it involved lifting all microhabitat items (smaller than 30 cm in maximum length). In each quadrat all fish were identified and their position recorded. After displacement, the microhabitat items were put back in their place. This procedure could have attracted fish from nearby areas, but given the small quadrat area used we are con-vinced that these cases (less than 3 % of the occasions) were spotted and excluded from the census.
Anaesthetic Census: Quinaldine (2-methyloquinolina) diluted
in alcohol at 15:1 (Patzner 1999) was used to count all fish pre-sent in each 0.25 m2quadrat, by squirting it into cavities, clefts
and under all microhabitat items present. Approximately 125 m l of the anaesthetic was slowly applied per quadrat from the bound-aries to the centre. The search for fish started immediately after this procedure. Although we used open stations, the relatively small quadrat size allowed us to record all fishes before they escaped. We also controlled the potential influence of the anaes-thetics on fish outside the quadrat by searching from the bound-aries to the centre of the sampling point and therefore detecting any anaesthetised fish that entered the quadrat. The searching e ffort and method was similar to the one applied in the IVC.
We applied these techniques in two sampling strategies: sampling over the whole depth extent of the rocky bottom, and stratified sampling over the main microhabitats present at both stations. While the first strategy aimed at sampling each microhabitat proportionally to its occurrence (random sam-pling), the second strategy aimed at balancing the sampling e ffort among the main microhabitats present (Table I). T h i s later strategy allowed us to evaluate bias in sampling the dif-ferent microhabitat types since by sampling all microhabitats equally we could ascertain that our results would be consistent in all microhabitats.
Strategy 1: Sampling over the rocky bottom: Eight parallel
transects were established five meters apart over the subtidal rocky bottom, from the deeper sandy area (depth range 8.9 m to 11.2 m, average = 10.3, S.E. = 0.3) to the infralittoral (depth range 1.3 m to 2.3 m, average = 2.0, S.E. = 0.2). Four transects were sampled with the visual techniques (VC and IVC) whilst the other four were sampled with anaesthetic census. Tr a n s e c t length varied according to the extent of rocky bottom (range = 55 m to 70 m, average = 61.25, S.E. = 3.15). On each transect, a 0.25 m2quadrat was sampled every 5 m. The quadrat area
cho-sen was smaller than in previous studies (e.g. Willis 2001). T h e choice for such an area was a compromise between the time necessary to sample each quadrat before the anaesthetic dis-persed, especially in the more complex microhabitats, and the size of the microhabitat patches sampled in Strategy 2 (see below). A total of 98 quadrats were sampled, half using the visu-al techniques and the other hvisu-alf using anaesthetic census. T h e sampling procedure began by examining the first quadrat on the visual transect after which the diver swam to the parallel tran-sect and sampled the first quadrat on the anaesthetic trantran-sect. This procedure was repeated until the infralittoral area was reached. Cover percentage of each microhabitat present in each quadrat was visually estimated.
Strategy 2: Stratified sampling over the main micro h a b i t a t s :
Five microhabitats were sampled using 0.25 m2quadrats: sand,
gravel, cobble, small rocks (< 30 cm maximum length) and l a rge rocks (> 30 cm maximum length). At each microhabitat patch, eight quadrats were randomly deployed, half of which were sampled with the visual techniques (VC and IVC) while the other half were examined using anaesthetic census.
Sam-Table I. – Microhabitat area sampled in the transect and habitat strategies using underwater visual census (VC), interference visual census (IVC) and anaesthetic census (see text for details).
Fig. 1. – Mean density of cryptobenthic fishes (number of speci-mens per quadrat ± SD) recorded in the transect strategy (ran-dom) by visual census (VC), interference visual census (IVC) and anaesthetic census (ANA).
pling was performed in narrow depth intervals (1 m depth range) to avoid possible confounding depth effects in the data.
Data analysis: To evaluate the efficiency of the visual
tech-niques we used two one-way A N O VA and tested for diff e r e n c e s between VC and anaesthetic and between IVC and anaesthetic in the transect (random) strategy. To compare both visual tech-niques, a visibility index was calculated based on the percentage of specimens recorded by the IVC but missed by the VC in both strategies. To compare the efficiency of the IVC to quantitative census (quinaldine) in the different microhabitats (Strategy 2), we used a two-way A N O VA and post-hoc Student-Newman-Keuls tests to find out where differences lay. All data were trans-formed following a square root + 1 transformation to meet homoscedasticity assumptions.
RESULTS
A total of 15 species belonging to 8 families were observed in our study site (Table II). The overall densities
obtained returned an average value of 2.37 individuals/m2
(S.E. = 0.38, range 0-12) for the VC, 4.46 individuals/m2
(S.E. = 0.54, range 0-16) for the IVC and 6.20 indivi-d u a l s / m2(S.E. = 0.65, range 0-28) for anaesthetic census.
The total number of species encountered using each tech-nique was: VC = 7, IVC = 11, anaesthetic census = 12 (Table II).
For Strategy 1 (random sampling) the VC recorded significantly less fish than the anaesthetic census ( A N O VA: F = 11.2, p < 0.001), whereas no significant d i fferences were found between the IVC and anaesthetic census (ANOVA: F = 1.61, p = 0.207) (Fig. 1).
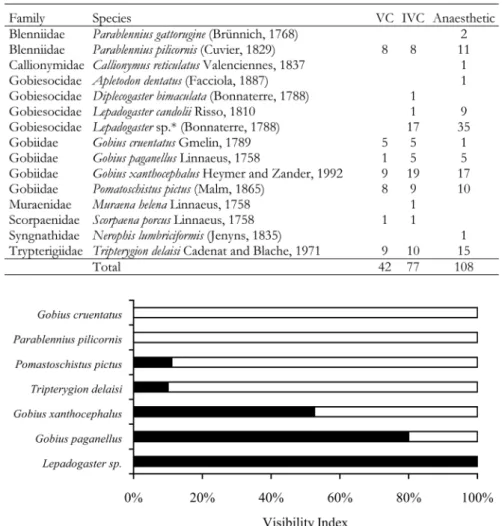
Using data from both strategies we calculated the per-centage of fish counted with the IVC that was missed by the VC, and ascribed a visibility index to each species (Fig. 2). Three distinct groups can be identified. One composed by the gobiesocids L e p a d o g a s t e r sp. which were completely missed by the VC; a second group composed by the gobies Gobius paganellus and Gobius xan -thocephalus which were partially missed without
interfer-Table II. – Number of specimens of each species recorded by visual census (VC), interference visual census (IVC) and anaesthetic cen-sus. * L e p a d o g a s t e r sp. was used to refer to two co-occurring species, L. lepadogaster and L. purpure a which are very difficult to dis-tinguish in the field (Henriques et al. 2002).
Fig. 2. – Percent of the number of specimens counted using both visual census techniques, the interference visual census (IVC) (black) and the underwater visual census (VC) (white), for species with over five individuals.
ence; and a third group with Tr i p t e rygion delaisi, P o m a -toschistus pictus, Parablennius pilicornis and G o b i u s c ru e n t a t u s which were mostly recorded prior to interfer-ence. Therefore, without habitat dismantling during the visual census, the first two groups of species would have been partially or completely missed.
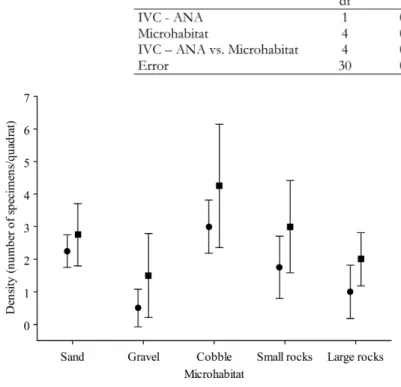
The factorial A N O VA comparing the IVC and anaes-thetic census data collected in the habitat strategy revealed significant differences between techniques and habitats but there was no interaction between these fac-tors (Fig. 3, Table III). Post-hoc tests revealed that there were no differences between techniques in each of the microhabitats sampled. The only observed differences oc-curred between different habitats: gravel and all the other microhabitats (sand: p < 0.05; cobble: p < 0.001; small rocks: p < 0.05); large rocks with cobble (p < 0.05).
DISCUSSION
Cryptobenthic fish diversity observed in this study was lower than that reported in other studies on temperate fish assemblages: e.g., 39 species from 9 families in South Africa (Prochaska 1998), 33 species from 17 families in New Zealand (Willis 2001), and 20 species from 5 fami-lies in Italy (La Mesa et al. 2004). This relatively low diversity is probably due to the smaller sampling size used in our test of the IVC. However, overall average densities
obtained in our study with both the anaesthetic census and the visual census are comparable to those described by Prochazka (1998) and Wi l l i s (2001) using rotenone sampling: 3.41 speci-m e n s / speci-m2and 3.61 specimens/m2, respectively.
Using a VC technique applied to northern A d r i-atic blennioids, Ilich and Kotrshall (1990) reported an average density of 4 specimens/m2.
In the Ciclopi Islands, Central Mediterranean Sea, La Mesa et al. (2004) using the same tech-nique found an average density between 0.60 and 0.67 specimens/m2.
The observed differences between the tradi-tional VC and the IVC were revealed by the visibility index. At the species level, major differences were related to the clingfishes Lepado -g a s t e r sp. which occur almost exclusively under stones (Henriques et al. 2002) and were completely missed by the VC. The gobies G . x a n t h o c e p h a l u s and G. paganellus, use the space under small microhabitat items and were also underestimated by the traditional visual technique. Other benthic species such as G. cruentatus, P. pilicornis, T. d e l a i s i and P. pictus present a less cryptic behaviour and were equally detected by both visual techniques. Therefore, traditional VC techniques underestimate dif-ferent species at difdif-ferent degrees. In particular, species with cryptic habits are the most affected. By dismantling the substrate, a significant increase in the number of spec-imens detected is achieved.
In order to explore this result, a comparison of both visual techniques with a quantitative survey (anaesthetic counts) was performed. While differences were larg e between VC and anaesthetic counts, when interference was applied and specimens under microhabitat items were recorded (IVC) there were no significant differences with the quantitative survey. Moreover, when microhabi-tats were sampled proportionally (habitat strategy), no d i fferences between the IVC and anaesthetic counts were found for each microhabitat type.
Most studies that quantitatively sampled these fish assemblages used visual census techniques that did not involve disturbing the bottom by lifting items where fish could be hiding (Sale & Douglas 1981, Bortone et al. 1989, Willis 2001). Sampling other groups of marine ani-mals, such as some invertebrates (e.g. Chapman 2002) is frequently done with interference techniques. In low complexity microhabitats, such as sand, interference has Fig. 3. – Mean density of cryptobenthic fish (number of specimens per
quadrat ± SD) recorded in the habitat strategy by interference visual census (IVC) (circle) and anaesthetic census (square) in each microhabitat.
Table III. – Factorial ANOVA results for the comparison between the interference visual census (IVC) and anaesthetic census (ANA) in the different microhabitats recorded in the habitat strategy.
been used to improve censusing of cryptic fishes (For-rester 1995) but this has not been tested in other micro-habitats. In this study we conclude that lifting small microhabitat items where fish could be hiding significant-ly increases the performance of the underwater visual census technique.
The interference visual census technique may render better abundance estimates, closer to those obtained with anaesthetics, depending on the specific behaviour of some species and the ability to sample some microhabi-tats. In the future, this IVC technique should be tested in d i fferent temperate cryptobenthic fish assemblages and its efficiency should be evaluated in other microhabitats.
AC K N O W L E D G E M E N T S.- This study was supported by the Por-tuguese Science and Technology Foundation (Fundação para a Ciência e a Tecnologia - FCT) as part of the project POCTI/BSE/38350/2001 and through the Pluriannual Program (R&D Unit 331/94). RB was supported by a PhD grant by FCT (SFRH/BD/1013/2000). The authors would like to thank B Cruz for assistance in the field work.
REFERENCES
Ackerman JL, Bellwood DR 2000. Reef fish assemblages: a re-evaluation using enclosed rotenone stations. Mar Ecol Pro g
Ser 206: 227-237.
Bellwood DR, Alcala AC 1988. The effect of a minimum length specification on visual estimates of density and biomass of coral reef fishes. Coral Reefs 7: 23-27.
Bortone SA, Kimmel JJ, Bundrick CM 1989. A comparison of three methods for visually assessing reef fish communities: time and area compensated. Northeast Gulf Sci 10: 85-96. Brock RE 1982. A critique of the visual census method for
assessing coral reef fish populations. Bull Mar Sci 32: 269-276.
Brock VE 1954. A preliminary report on a method of estimating reef fish populations. J Wildlife Manag 18: 297-308. Chapman MG 2002. Patterns of spatial and temporal variation
of macrofauna under boulders in a sheltered boulder field.
Austral Ecol 27: 211-228.
Connell SD, Jones GP 1991. The influence of habitat complexi-ty on postrecruitment processes in a temperate reef fish pop-ulation. J Exp Mar Biol Ecol 151: 271-294.
Edgar GJ, Barrett NS, Moroton, AJ 2004. Bias associated with the use of underwater visual census techniques to quantify the density and size-structure of fish populations. J Exp Mar
Biol Ecol 308: 269-290.
Forrester GE 1995. Strong density-dependent survival and recruitment regulate the abundance of a coral reef fish.
Oecologia 103: 275-282.
Fowler AJ 1987. The development of sampling strategies for population studies of coral reef fishes. A case study. C o r a l
Reefs 6: 49-58.
Gasparini JL, Floeter SR 2001. The shore fishes of Tr i n i d a d Island, western South Atlantic. J Nat Hist 35: 1639-1656. Gonçalves EJ, Barbosa M, Cabral HN, Henriques M 2002.
Ontogenetic shifts in patterns of microhabitat utilization in the small-headed clingfish, Apletodon dentatus ( G o b i e s o c i-dae). Environ Biol Fish 63: 333-339.
Gonçalves EJ, Henriques M, Almada VC 2003. Use of a tem-perate reef-fish community to identify priorities in the estab-lishment of a marine protected area. I n Beumer JP, Grant A , Smith DC eds, Aquatic Protected Areas: What Works Best and How Do We Know? Proceed World Congr Aquatic Pro-tected Areas, Cairns, Australia: Australian Society for Fish Biology: 261-272.
H a r m e l i n - Vivien ML, Harmelin JG, Chauvet C, Duval C, Galzin R, Lejeune P, Barnabé G, Blanc F, Chevalier R, Duclerc J, Lasserre G 1985. Évaluation visuelle des peuple-ments et populations de poissons: méthodes et problèmes.
Rev Écol Terre Vie 40: 467-539.
Henriques M, Lourenço R, Almada F, Calado G, Gonçalves D, Guillemaud T, Cancela ML, Almada VC 2002. A revision of the status of Lepadogaster lepadogaster (Pisces: Gobiesoci-dae) sympatric sub-species or a long misunderstood blend of species? Biol J Linnean Soc 76: 327-338.
Kulbicki M 1990. Comparisons between rotenone poisonings and visual counts for density and biomass estimates of coral reef fish populations. I n M Richard ed, Proceed Intern Soc Reef Studies, Noumea, Tahiti: Univ Francaise du Pacifique: 105-112.
La Mesa G, Vacchi M 2005. Analysis of the blennioid assem-blages associated with different rocky shore habitats in the Ligurian Sea. J Fish Biol 66: 1300-1327.
La Mesa G, Micalizzi M, Giaccone G, Vacchi M 2004. Crypto-benthic fishes of the “Ciclopi Islands” marine reserve (cen-tral Mediterranean Sea): assemblage composition, structure and relations with habitat features. Mar Biol 145: 233-242. Lincoln Smith MP 1988. Effects of observer swimming speed
on sample counts of temperate rocky reef fish assemblages.
Mar Ecol Prog Ser 43: 223-231.
Luckhurst BE, Luckhurst K 1978. Diurnal space utilization in coral reef fish communities. Mar Biol 49: 325-332. Miller PJ 1979. Adaptiveness and implications of small size in
teleosts I n Miller P J ed, Fish Phenology - Anabolic A d a p-tiveness in Teleosts. Symposium of the Zoological Society of London 44. London, Academic Press: 263-306.
Nanami A, Nishihira M 2003. Effects of habitat connectivity on the abundance and species richness of coral reef fishes: com-parison of an experimental habitat established at a rocky reef flat and at a sandy sea bottom. E n v i ron Biol Fish 68: 183-196.
Patzner RA 1999. Sea-urchins as a hiding-place for juvenile benthic teleosts (Gobiidae and Gobiesocidae) in the Mediter-ranean Sea. Cybium 23: 93-97.
Prochazka K 1998. Spatial and trophic partioning in cryptic fish communities of shallow subtidal reefs in False Bay, South Africa. Environ Biol Fish 51: 201-220.
Sale PF, Douglas WA 1981. Precision and accuracy of visual census technique for fish assemblages on patch coral reefs.
Environ Biol Fish 6: 333-339.
Sale PF, Sharp BJ 1983. Correction of bias in visual transect censuses of coral reef fishes. Coral Reefs 2: 37-42. Samoilys MA, Carlos G 2000. Determining methods of
under-water visual census for estimating the abundance of coral reef fishes. Environ Biol Fish 57: 289-304.
Willis TJ 2001. Visual census methods underestimate density and diversity of cryptic reef fishes J Fish Biol 59: 1408-1411.
Received June 29, 2005 Accepted August 16, 2005