Original Article
Marques et al.
Rev Bras Ativ Fís Saúde 2017;22(2):165-175
DOI: 10.12820/rbafs.v.22n2p165-175 RBAFSSOCIEDADE BRASILEIRA DE ATIVIDADE FÍSICA E SAÚDE Brazilian Journal of Physical Activity and Health
RBAFS
Revista Brasileira de Atividade Física & Saúde
SOCIEDADE BRASILEIRA DE ATIVIDADE FÍSICA E SAÚDE Brazilian Journal of Physical Activity and Health
RBAFS
Revista Brasileira de Atividade Física & Saúde SOCIEDADE BRASILEIRA DE ATIVIDADE FÍSICA E SAÚDE
Brazilian Journal of Physical Activity and Health
Brazilian Journal of Physical Activity and Health
SOCIEDADE BRASILEIRA DE ATIVIDADE FÍSICA & SAÚDE
1 University Center of Maringa - UNICESUMAR and Researcher of the Cesumar Science, Technology and Innovation Institute (ICETI) – Maringa, Parana, Brazil.
2 University Center of Maringa – UNICESUMAR – Maringa, Parana, Brazil 3 Norte do Paraná University – UNOPAR – Londrina, Parana, Brazil
Abstract
The objective of this study was to identify the frequency of prac-tice of exercise and fruit/vegetable intake in a representative sample of Brazilian university students and their possible as-sociation with nutritional status. The sample consisted of 1177 individuals of both sexes, aged 18-35 years, selected randomly. Information about the frequency of exercise and fruit/vegeta-ble intake was obtained with the National College Health As-sessment-II self-administered questionnaire. Nutritional status was defined based on body mass index according to the cut-off values recommended by the World Health Organization. The results showed that the practice of cardio-respiratory and re-sistance exercises were reported by 51.5% and 32.5% of the sam-ple, respectively. Less than 4% of the university students had an adequate fruit/vegetable intake. Proportion of occurrence of excess body weight was equivalent to 32.4%, being significantly higher in men (45.6% vs 22.33%; p < 0.005). The risk to
identi-fy excess body weight in university students who reported not consuming fruits/vegetables daily was two to three times high-er than their pehigh-ers who reported an adequate intake (women: OR = 2.89 [95%CI: 2.28 – 3.62]; men: OR = 1.96 [95%CI: 1.44 – 2.60]). Exposure risk for excess body weight was progressive-ly lower according to reported higher frequency of practice of cardio-respiratory exercise. In conclusion, the findings suggest immediate interventions aimed at emphasizing the healthy practice of exercise and food intake could help to minimize the risk of appearance and development of excess body weight.
Keywords
Physical Activity; Food Intake; Overweight; Health Promotion.
Resumo
O objetivo do estudo foi identificar a frequência de prática de exercício físico e consumo de frutas/hortaliças e suas possíveis associações com es-tado nutricional em amostra representativa de universitários brasilei-ros. A amostra foi constituída por 1177 sujeitos de ambos os sexos, com idade entre 18 e 35 anos, selecionada aleatoriamente. As informações relacionadas à frequência de prática de exercício físico e consumo de frutas/hortaliças foram obtidas mediante aplicação do questionário auto-administrado National College Health Assessment-II. Estado nu-tricional foi definido mediante índice de massa corporal, adotando-se pontos-de-corte recomendados pela Organização Mundial da Saúde. Os resultados mostraram que a prática de exercícios cardiorrespirató-rios e resistidos foi relatada por 51,5% e 32,5% da amostra, respecti-vamente. Menos de 4% dos universitários apontaram consumo ade-quado de frutas/hortaliças. Proporção de ocorrência de excesso de peso corporal foi equivalente a 32,4%, significativamente mais elevada nos rapazes (45,6% vs 22,3%; p<0,005). Risco de identificar excesso de peso corporal em universitários que relataram não consumir frutas/ hortaliças diariamente foi de duas a três vezes maior que em seus pa-res que relataram consumo adequado (mulhepa-res: OR = 2,89 [IC95%: 2,28 – 3,62]; homens: OR = 1,96 [IC95%: 1,44 – 2,60]). Exposição de risco para excesso de peso corporal foi progressivamente menor de acordo com a maior frequência relatada de prática de exercícios cardiorrespiratórios. Concluindo, os achados sugerem intervenções imediatas voltadas à adoção de hábitos de prática de exercício físico e consumo alimentar saudáveis, auxiliando na minimização dos riscos de aparecimento e desenvolvimento do excesso de peso corporal. Palavras-chave
Atividade Física; Consumo de Alimentos; Sobrepeso; Promoção da Saúde.
Exercise and fruit/vegetable intake in a sample
of Brazilian university students: association with
nutritional status
Exercício físico e consumo de frutas/hortaliças em amostra de
universitários brasileiros: associação com estado nutricional
Andréa Grano Marques1, Marileisa Barbosa2, Dartagnan Pinto Guedes3
Introduction
Access to higher education is characterized as a pe-riod of greater autonomy and independence that
in-volved new challenges and unique experiences. For the first time in their lives, many young adults take on the responsibility of self-care, without direct
su-pervision of their parents and/or family1. This period
coincides with the end of adolescence and beginning of adulthood, a moment when new social and affec-tive behavior tends to be adopted. When associated
with the demands of academic activities, this can result in behavioral patterns that
pose a greater risk to health2.
National3,4 and international studies2,5 on health-risk and protective behavior
avail-able in the literature have sought to show that the lifestyle adopted by young adults, especially university students, is not usually healthy. The following stand out as types of behavior that pose risk to their health and, in some cases, their own life: inadequate eating habits, characterized by the high consumption of processed foods to the
detri-ment of fruits and vegetables6, and insufficient physical activity7.
According to the Youth Risk Behavior Surveillance (YRBS 2012)8, the main
causes of morbidities among adolescents and young adults aged between ten and 24 years are associated with inadequate eating habits and physical inactivity. Additionally, the majority of adolescents tend to be simultaneously exposed to
both risk behaviors9 and these habits are likely to be maintained throughout life6,
thus contributing to the increase in the chance of onset and development of over-weight and non-communicable chronic diseases, understood as the main causes
of disabilities in adulthood10.
In this sense, behavior adopted by university students represents a great chal-lenge for public health, as they are exposed to several risk and behavioral factors,
which can lead to major changes in lifestyle and affect health in the long term2,6,9.
Thus, to understand the lifestyle of university students, especially health-risk and protective behaviors, it is relevant to plan future actions and possible de-cision-making in the implementation of health promotion and education pro-grams in the university environment, in addition to providing resources to change behaviors that pose a risk to university students.
Given this context, the objective of the present study is to identify the frequen-cy of practice of resistance and cardio-respiratory exercises and fruit/vegetable in-take in a sample of university students of a private institution of higher education in the state of Paraná, Southern Brazil, and subsequently establish possible asso-ciations between both health behaviors and nutritional status.
Methdos
The sample population for the present study included university students from 44 undergraduate courses held at the University Center of Maringa - UNICESU-MAR, in Maringa, Parana, Southern Brazil. This institution belongs to the Private Higher Education network of Paraná State and its community is comprised of approximately 11,000 students. This sample was obtained through a probabilistic cluster process, using the number of students per sex, course, area of study and course period (day or evening) as point of reference.
The sample size was established with a confidence interval of 95%, sample error of 3%, and an additional 10% for losses during data collection. Considering the fact that the sample plan involved clusters, a sampling design effect of 1.5 was established. In this case, an initial minimum sample of 980 students was expected
through a calculation performed with the OpenEpi software11. However, the final
sample used during the treatment of information was comprised of 1,177 univer-sity students (666 females and 511 males).
Information about the frequency of practice of resistance and cardio-respirato-ry exercises and fruit/vegetable intake were obtained through the application of a self-administered questionnaire known as the National College Health Assessment (NCHA-II), translated, adapted and validated for use in the Brazilian university
sex, age, marital status, housing and course year. The NCHA-II involves questions about health-risk and protective behavior, including seven sections: (a) information about health, personal safety and violence; (b) alcohol, tobacco and other drug use; (c) mental health; (d) body weight, nutrition and physical activity; (e) mental health; (f) physical health; and (g) difficulties in academic performance. However, the pres-ent study used data made available specifically in the “body weight, nutrition and physical activity” section. In this case, university students reported the frequency with which they practiced resistance and cardio-respiratory exercises and consumed fruits/vegetables, using the week prior to data collection as reference.
Based on the frequency of practice of resistance and cardio-respiratory exercises, the following indicators were adopted: low level of practice for frequencies equiv-alent to 1-2 days/week; moderate level of practice for frequencies equivequiv-alent to 3-4 days/week; and high level of practice for frequencies equivalent to ≥ 5 days/week. Regarding the fruit/vegetable intake reported by university students, according to
the recommendations from the World Health Organization (WHO)13, the
follow-ing indicators were taken into consideration: no intake; low intake for frequencies equivalent to 1-2 portions/day; moderate intake for frequencies equivalent to 3-4 portions/day; and adequate intake for frequencies equivalent to ≥ 5 portions/day.
In terms of nutritional status, the body mass index (BMI) was calculated through the ratio between body mass in kilograms and the square of height in
meters (kg/m2), self-reported by university students. Based on these BMI values,
the nutritional status of university students was obtained from cut-off points
rec-ommended by the WHO14, considering the following four strata: low body weight
(BMI < 20 kg/m2), eutrophic (20 kg/m2 ≤ BMI < 25 kg/m2),overweight (25 kg/m2 ≤
BMI < 30 kg/m2) and obesity (BMI ≥ 30 kg/m2).
The NCHA-II was individually applied to each university student in a single moment by two researchers, adequately trained for this purpose. To achieve this, the classes randomly selected for this study were visited by researchers, who ex-plained the study objectives and principle of anonymity to students. University students who voluntarily showed interest in participating in this study received a copy of the NCHA-II with instructions for self-completion and information about the availability of researchers for possible clarifications. After questionnaires were completed and handed in, they were kept in a ballot box. Data were collected be-tween October and November 2014.
Statistical treatment was performed with the Statistical Package for the Social Science (SPSS), version 22. The exact proportions and respective confidence inter-vals (95%CI) of indicators associated with the practice of resistance and cardio-res-piratory exercises and fruit/vegetable intake, stratified according to demographic information and nutritional status, were identified. Statistical differences between strata under investigation were analyzed with a table of contingencies and
Chi-square non-parametric test (χ2). Established through binary logistic regression, odds
ratio (OR) were calculated to identify associations between nutritional status and indicators of physical activity and fruit/vegetable intake. Models were established separately by sex and controlled for age, marital status, housing and course year.
Results
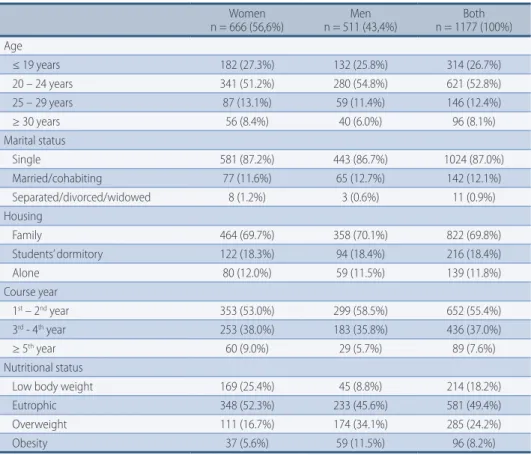
Table 1 shows that more than half of the sample was comprised of women (56.6%) and university students aged between 20 and 24 years (52.8%). At the time of data collection, 87% of university students were single, 69.8% lived with their family members and the remaining ones lived in student dormitories (18.4%) or alone
(11.8%). Regarding course year, 55.4% of university students who participated in
this study were enrolled in the first years (1st and 2nd years). Moreover, 32.4% of the
sample selected had excessive body weight, with higher proportions of overweight and obesity among men (34.1% and 11.5%, respectively), whereas low body weight totaled 18.2% of the sample, with a higher proportion among women (25.4%).
TABLE 1 – Demographic characteristics and nutritional status classification of the sample analyzed in the study. Women n = 666 (56,6%) n = 511 (43,4%)Men n = 1177 (100%)Both Age ≤ 19 years 182 (27.3%) 132 (25.8%) 314 (26.7%) 20 – 24 years 341 (51.2%) 280 (54.8%) 621 (52.8%) 25 – 29 years 87 (13.1%) 59 (11.4%) 146 (12.4%) ≥ 30 years 56 (8.4%) 40 (6.0%) 96 (8.1%) Marital status Single 581 (87.2%) 443 (86.7%) 1024 (87.0%) Married/cohabiting 77 (11.6%) 65 (12.7%) 142 (12.1%) Separated/divorced/widowed 8 (1.2%) 3 (0.6%) 11 (0.9%) Housing Family 464 (69.7%) 358 (70.1%) 822 (69.8%) Students’ dormitory 122 (18.3%) 94 (18.4%) 216 (18.4%) Alone 80 (12.0%) 59 (11.5%) 139 (11.8%) Course year 1st – 2nd year 353 (53.0%) 299 (58.5%) 652 (55.4%) 3rd - 4th year 253 (38.0%) 183 (35.8%) 436 (37.0%) ≥ 5th year 60 (9.0%) 29 (5.7%) 89 (7.6%) Nutritional status
Low body weight 169 (25.4%) 45 (8.8%) 214 (18.2%)
Eutrophic 348 (52.3%) 233 (45.6%) 581 (49.4%)
Overweight 111 (16.7%) 174 (34.1%) 285 (24.2%)
Obesity 37 (5.6%) 59 (11.5%) 96 (8.2%)
Statistical information about the frequency of resistance and
cardio-respirato-ry exercises is shown on Table 2. Approximately half (48.5% [95%CI:46.0 – 51.2])
of university students selected in this study reported not practicing any type of cardio-respiratory exercises during the week prior to data collection. In contrast, in the case of resistance exercises, the proportion of university students who
re-ported not practicing this was 67.5% [95%CI:64.3-70.9]. When the χ2 values were
analyzed, males reported a higher weekly frequency of physical activity; especially
when this frequency was ≥ 5 times/week (cardio-respiratory exercises [χ2 = 7.238; p
< 0.001] and resistance exercises [χ2 = 25.290; p < 0.001]). With the advance of age,
the proportion of university students who do not practice cardio-respiratory
exer-cises (χ2 = 47.395; p < 0.001) and resistance exercises (χ2 = 44.275; p < 0.001) tends
to increase significantly. In contrast, a significantly higher proportion of universi-ty students aged ≤ 19 years reported a frequency ≥ 5 times/week for
cardio-respira-tory exercises (χ2 = 7.851; p < 0.001) and resistance exercises (χ2 = 29.471; p < 0.001).
In terms of marital status, a significantly lower proportion of single university
students reported not performing cardio-respiratory exercises (χ2 = 48.018; p <
0.001) and resistance exercises (χ2 = 49.745; p < 0.001), whereas those who said
that they lived in a student dormitory or alone exercised more frequently than others who reported living with their family. Furthermore, the results revealed a
statistically significant trend towards a reduction in the frequency of physical ac-tivity with the advance of course year, especially for resistance exercises (3-4 times/
week [χ2 = 17.894; p < 0.001) and ≥ 5 times/week [χ2 = 6.375; p = 0.011]).
Nutritional status was the indicator more closely associated with the frequency of physical activity among university students. Findings from this study enable one to in-fer that the frequency with which university students reported practicing both types of exercise is inversely proportional to their nutritional status. Thus, 17.4% [95%CI: 16.0 – 19.1] of eutrophic students reported practicing cardio-respiratory exercises ≥ 5 times/
week, when compared to the 4.2% [95%CI: 3.8 – 4.8] of those categorized as obese (χ2 =
22.361; p < 0.001). Moreover, 15.4% [95%CI: 14.4 – 16.6] of eutrophic students reported practicing resistance exercises with the same weekly frequency, while only 1.2% [95%CI:
0.8 – 1.8] of obese students reported an identical frequency (χ2 = 33.741; p < 0.001).
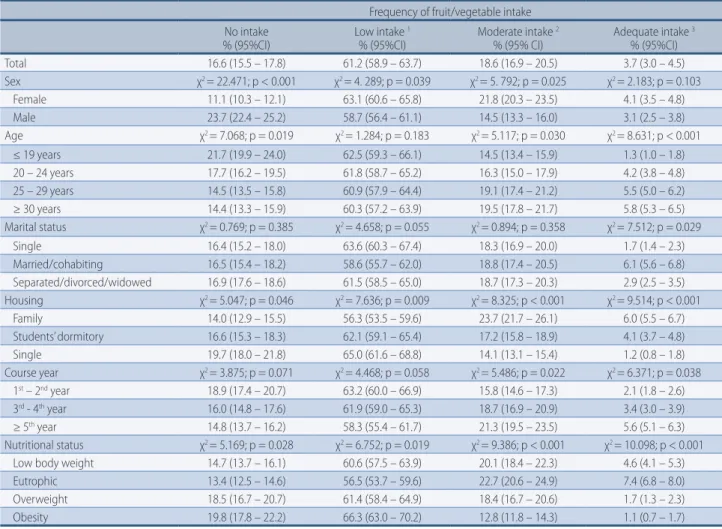
Based on information shown on Table 3, 18.6% [95%CI: 16.9 – 20.5] of university stu-dents selected in this study reported a moderate frequency and only 3.7% [95%CI: 3.0 – 4.5] mentioned an adequate frequency of fruit/vegetable intake. In contrast, 61.2% [95%CI: 58.9 – 63.7] and 16.6% [95%CI: 15.5 – 17.8] of students reported a low or no frequency of
TABLE 2 – Association between physical activity practice and demographic indicators and nutritional status among university students.
Cardio-respiratory exercises Resistance exercises
Does not perform
% (95%CI) 1-2 times/week% (95%CI) 3-4 times/week% (95%CI) ≥ 5 times/week% (95%CI) Does not perform% (95%CI) 1-2 times/week% (95%CI) 3-4 times/week% (95%CI) ≥ 5 times/week% (95%CI) Total 48.5 (46.0 – 51.2) 27.9 (26.4 – 29.5) 12.1 (11.5 – 12.8) 11.5 (11.0 – 12.1) 67.5 (64.3 – 70.9) 14.8 (14.1 – 15.6) 9.9 (9.4 – 10.5) 7.8 (7.4 – 8.2) Sex χ2 = 41.732; p < 0.001 χ 2 = 20.804; p < 0.001 χ 2 = 2.529; p = 0.061 χ 2 = 7.238; p < 0.001 χ 2 = 15.458; p < 0.001 χ 2 = 1.566; p = 0.213 χ 2 = 8.938; p < 0.001 χ 2 = 25.290; p <0.001 Female 59.1 (56.0 – 62.9) 22.3 (20.7 – 24.2) 10.5 (9,8 – 11.4) 8.1 (7.5 – 8.9) 74.0 (70.2 – 78.4) 16.2 (14.9 – 17.8) 6.6 (6.1 – 7.3) 3.2 (2.9 – 3.6) Male 37.9 (35.8 – 40.5) 33.5 (31.5 – 36.4) 13.7 (12.7 – 15.0) 14.9 (13.8 – 16.3) 61.0 (58.2 – 64.2) 13.4 (12.4 – 14.7) 13.2 (12.3 – 14.4) 12.4 (11.6 – 13.4) Age χ2 = 47.395; p < 0.001 χ 2 = 28.362; p < 0.001 χ 2 = 6.137; p = 0.019 χ 2 = 7.851; p < 0.001 χ 2 = 44.275; p < 0.001 χ 2 = 3.378; p = 0.071 χ 2= 19.926; p< 0.001 χ 2 = 29.471; p< 0.001 ≤ 19 years 35.9 (33.9 – 38.4) 34.2 (32.4 – 36.5) 15.1 (13.9 – 16.7) 14.8 (13.7 – 16.3) 56.3 (53.5–59.5) 16.3 (15.1–17.9) 14.2 (13.2–15.5) 13.2 (12.4–14.3) 20 – 24 years 41.4 (38.9 – 44.5) 31.8 (30.1 – 33.9) 13.5 (12.4 – 15.0) 13.3 (12.3 – 14.6) 60.9 (58.7–64.0) 15.2 (14.1–16.6) 12.3 (11.5–13.4) 11.6 (10.8–12.6) 25 – 29 years 53.1 (50.2 – 49.6) 26.3 (24.7 – 28.5) 10.5 (9.7 – 11.7) 10.1 (9.2 – 11.3) 72.6 (68.7–76.9) 14.3 (13.3–15.8) 8.0 (7.3–9.0) 5.1 (4.6–5.8) ≥ 30 years 63.6 (60.3 – 67.7) 19.3 (18.0 – 20.9) 9.3 (8.7 – 10.2 7.8 (7.2 – 8.7) 80.2 (76.0–84.6) 13.4 (12.5–14.8) 5.1 (4.6–5.8) 1.3 (0.9–1.9) Marital status χ2 = 48. 018; p < 0.001 χ 2 = 21.158; p < 0.001 χ 2 = 10.496; p < 0.001 χ 2 = 8.713; p < 0.001 χ 2 = 49.745; p < 0.001 χ 2 = 7.984; p < 0.001 χ 2 = 6.711; p = 0.001 χ 2 = 27.632; p< 0.001 Single 35.6 (33.7 – 38.0) 33.5 (31.7 – 35.7) 16.1 (14.9 – 17.7) 14.8 (13.8 – 16.1) 54.7 (52.0–57.9) 18.3 (17.0–19.6) 13.2 (12.3–14.4) 13.8 (12.9–15.0) Married/cohabiting 47.8 (45.7 – 50.5) 27.4 (25.8 – 29.4) 12.0 (10.8 – 13.1) 12.8 (11.9 – 14.0) 69.7 (66.0–73.2) 14.5 (13.4–16.0) 9.8 (9.0–10.1) 6.0 (5.5–6.7) Separated/ divorced/widowed 62.1 (59.1 – 65.6) 22.8 (20.5 – 24.5) 8.2 (7.6 – 9.0) 6.9 (6.4 – 7.7) 78.1 (74.2–82.4) 11.6 (10.7–12.9) 6.7 (6.2–7.4) 3.6 (3.2–4.2) Housing χ2 = 12.589; p < 0.001 χ 2 = 5.105; p = 0.027 χ 2 = 3.217; p = 0.089 χ 2 = 4.593; p = 0.054 χ 2 = 9.158; p < 0.001 χ 2 = 1.109; p = 0.225 χ 2 = 4.198; p = 0.061 χ 2 = 3.953; p = 0.075 Family 54.8 (51.7 – 58.5) 25.3 (23.9 – 27.1) 10.8 (9.9 – 12.1) 9.1 (8.4 – 10.0) 74.0 (70.0–78.6) 13.3 (12.4–14.6) 7.3 (6.7–8.1) 5.4 (4.9–6.1) Students’ dormitory 49.3 (47.0 – 52.1) 28.0 (26.2 – 30.3) 11.1 (12.0 – 12.3) 11.6 (10.5 – 13.1) 64.4 (60.5–68.4) 15.2 (14.1–16.5) 10.6 (9.8–11.7) 9.8 (9.0–10.8) Alone 41.4 (39.0 – 44.7) 30.4 (28.5 – 32.9) 14.4 (13.2 – 16.0) 13.8 (12.7 – 15.2) 64.1 (60.1–68.6) 15.9 (14.7–17.4) 11.8 (10.9–13.1) 8.2 (7.5–10.1) Course year χ2 = 12.136; p < 0.001 χ 2 = 3.118; p = 0.084 χ 2 = 6.426; p = 0.011 χ 2 = 4.096; p < 0.061 χ 2 = 38.748; p < 0.001 χ 2 = 8.106; p < 0.001 χ 2 = 17.894; p<0.001 χ 2 = 6.375; p < 0.011 1st - 2nd year 41.4 (38.7 – 44.9) 29.2 (27.3 – 31.6) 15.6 (14.2 – 17.3) 13.8 (12.6 – 15.3) 55.8 (53.0–59.0) 18.2 (17.0–19.8) 15.9 (14.7– 17.4) 10.1 (9.3–11.2) 3rd – 4th year 49.0 (46.1 – 51.5) 28.8 (27.0 – 31.0) 11.3 (10.3 – 12.6) 10.9 (10.0 – 12.2) 67.6 (64.1–71.6) 15.2 (14.0–16.7) 8.3 (7.6–9.2) 8.9 (8.2–9.8) ≥ 5th year 55.1 (52.2 – 58.4) 25.7 (24.1 – 27.7) 9.4 (8.8 – 10.3) 9.8 (8.9 – 11.1) 79.1 (74.9–83.6) 11.0 (10.1–12.3) 5.5 (5.0–6.2) 4.4 (4.0–5.0) Nutritional status χ2 = 49.527; p < 0.001 χ 2 = 22.084; p < 0.001 χ 2 = 17.836; p < 0.001 χ 2 = 22.361; p < 0.001 χ 2 = 44.816; p < 0.001 χ 2 = 19.682; p< 0.001 χ 2 = 16.211; p<0.001 χ 2 = 33.741; p< 0.001 Low body weight 37.4 (35.3 – 39.8) 32.8 (30.9 – 35.3) 13.9 (12.8 – 15.3) 15.9 (14.7 – 17.5) 63.3 (59.5–67.6) 17.5 (16.3–19.1) 10.6 (9.8–11.7) 8.6 (7.9–9.6) Eutrophic 31.9 (30.3 – 33.9) 30.2 (28.5 – 32.3) 20.5 (19.3 – 22.1) 17.4 (16.0 – 19.1) 47.2 (44.1–50.7) 19.7 (18.4–21.5) 17.7 (16.5–19.2) 15.4 (14.4–16.6) Overweight 57.1 (54.1 – 60.7) 26.3 (24.7 – 28.4) 8.1 (7.5 – 8.8) 8.5 (7.8 – 9.4) 71.7 (67.9–76.0) 14.2 (13.0–15.9) 8.1 (7.4–9.2) 6.0 (5.3–6.9) Obesity 67.6 (64.1 – 71.7) 22.3 (20.5 – 24.6) 5.9 (5.4 – 6.7) 4.2 (3.8 – 4.8) 87.8 (83.4–92.8) 7.8 (7.2–8.7) 3.2 (2.8–3.8) 1.2 (0.8–1.8)
fruit/vegetable intake, respectively. The adequate proportion of frequency of
fruit/vegeta-ble intake increase with age (χ2 = 8.631; p < 0.001) and the strata that included married
students (χ2 = 7.512; p = 0.029) and those who lived with their family (χ2 = 9.514; p < 0.001).
Additionally, the adequate frequency of fruit/vegetable intake was significantly higher with
the advance in course year (χ2 = 6.371; p = 0.038). However, this was not the case for course
period, as university students who studied during the day and those who studied in the evenings showed similar frequencies of fruit/vegetable intake. With regard to nutritional status, a significantly lower proportion of students categorized with excess body weight (overweight and obese) reported an adequate frequency of fruit/vegetable intake when
compared to those who were eutrophic or had low body weight (χ2 = 10.098; p<0.001).
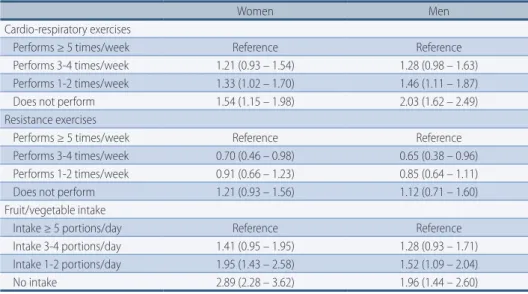
Table 4 shows the associations between indicators of physical activity and fruit/veg-etable intake and variations in the occurrence of excess body weight found in the sam-ple selected. Through the analysis of odds ratio values, considering that adjustments will be made for the remaining variables in the study, the estimates found in both sexes indicated that risk exposure to excess body weight was inversely proportional to the frequencies of cardio-respiratory exercises. Compared to individuals who performed physical activity ≥ 5 times/week, men who reported not practicing this type of exercise had double the risk of excess body weight (OR= 2.03 [95%CI: 1.62 – 2.49]; whereas the same risk for women was one and a half times (OR= 1.54 [95%CI: 1.15 – 1.98]).
Regarding resistance exercises, significant associations were found for
frequen-TABLE 3 – Association between fruit/vegetable intake and demographic indicators and nutritional status among university students.
Frequency of fruit/vegetable intake No intake
% (95%CI) Low intake
1
% (95%CI) Moderate intake
2
% (95% CI) Adequate intake
3 % (95%CI) Total 16.6 (15.5 – 17.8) 61.2 (58.9 – 63.7) 18.6 (16.9 – 20.5) 3.7 (3.0 – 4.5) Sex χ2 = 22.471; p < 0.001 χ2 = 4. 289; p = 0.039 χ2 = 5. 792; p = 0.025 χ2 = 2.183; p = 0.103 Female 11.1 (10.3 – 12.1) 63.1 (60.6 – 65.8) 21.8 (20.3 – 23.5) 4.1 (3.5 – 4.8) Male 23.7 (22.4 – 25.2) 58.7 (56.4 – 61.1) 14.5 (13.3 – 16.0) 3.1 (2.5 – 3.8) Age χ2 = 7.068; p = 0.019 χ2 = 1.284; p = 0.183 χ2 = 5.117; p = 0.030 χ2 = 8.631; p < 0.001 ≤ 19 years 21.7 (19.9 – 24.0) 62.5 (59.3 – 66.1) 14.5 (13.4 – 15.9) 1.3 (1.0 – 1.8) 20 – 24 years 17.7 (16.2 – 19.5) 61.8 (58.7 – 65.2) 16.3 (15.0 – 17.9) 4.2 (3.8 – 4.8) 25 – 29 years 14.5 (13.5 – 15.8) 60.9 (57.9 – 64.4) 19.1 (17.4 – 21.2) 5.5 (5.0 – 6.2) ≥ 30 years 14.4 (13.3 – 15.9) 60.3 (57.2 – 63.9) 19.5 (17.8 – 21.7) 5.8 (5.3 – 6.5) Marital status χ2 = 0.769; p = 0.385 χ2 = 4.658; p = 0.055 χ2 = 0.894; p = 0.358 χ2 = 7.512; p = 0.029 Single 16.4 (15.2 – 18.0) 63.6 (60.3 – 67.4) 18.3 (16.9 – 20.0) 1.7 (1.4 – 2.3) Married/cohabiting 16.5 (15.4 – 18.2) 58.6 (55.7 – 62.0) 18.8 (17.4 – 20.5) 6.1 (5.6 – 6.8) Separated/divorced/widowed 16.9 (17.6 – 18.6) 61.5 (58.5 – 65.0) 18.7 (17.3 – 20.3) 2.9 (2.5 – 3.5) Housing χ2 = 5.047; p = 0.046 χ2 = 7.636; p = 0.009 χ2 = 8.325; p < 0.001 χ2 = 9.514; p < 0.001 Family 14.0 (12.9 – 15.5) 56.3 (53.5 – 59.6) 23.7 (21.7 – 26.1) 6.0 (5.5 – 6.7) Students’ dormitory 16.6 (15.3 – 18.3) 62.1 (59.1 – 65.4) 17.2 (15.8 – 18.9) 4.1 (3.7 – 4.8) Single 19.7 (18.0 – 21.8) 65.0 (61.6 – 68.8) 14.1 (13.1 – 15.4) 1.2 (0.8 – 1.8) Course year χ2 = 3.875; p = 0.071 χ2 = 4.468; p = 0.058 χ2 = 5.486; p = 0.022 χ2 = 6.371; p = 0.038 1st – 2nd year 18.9 (17.4 – 20.7) 63.2 (60.0 – 66.9) 15.8 (14.6 – 17.3) 2.1 (1.8 – 2.6) 3rd - 4th year 16.0 (14.8 – 17.6) 61.9 (59.0 – 65.3) 18.7 (16.9 – 20.9) 3.4 (3.0 – 3.9) ≥ 5th year 14.8 (13.7 – 16.2) 58.3 (55.4 – 61.7) 21.3 (19.5 – 23.5) 5.6 (5.1 – 6.3) Nutritional status χ2 = 5.169; p = 0.028 χ2 = 6.752; p = 0.019 χ2 = 9.386; p < 0.001 χ2 = 10.098; p < 0.001
Low body weight 14.7 (13.7 – 16.1) 60.6 (57.5 – 63.9) 20.1 (18.4 – 22.3) 4.6 (4.1 – 5.3) Eutrophic 13.4 (12.5 – 14.6) 56.5 (53.7 – 59.6) 22.7 (20.6 – 24.9) 7.4 (6.8 – 8.0) Overweight 18.5 (16.7 – 20.7) 61.4 (58.4 – 64.9) 18.4 (16.7 – 20.6) 1.7 (1.3 – 2.3) Obesity 19.8 (17.8 – 22.2) 66.3 (63.0 – 70.2) 12.8 (11.8 – 14.3) 1.1 (0.7 – 1.7)
1 Frequency of intake equivalent to 1-2 portions/day; 2 Frequency of intake equivalent to 3-4 portions/day; 3 Frequency of intake equi-valent to ≥ 5portions/day.
cies of practice of 3-4 times/week. In this case, there was a lower risk for the pres-ence of excess body weight equivalent to 70% and 65% among both women and men, respectively (females – OR = 0.70 [95%CI: 0.46 – 0.98]; males – OR = 0.65 [95%CI: 0.38 – 0.96]). The remaining situations of frequency of practice of resist-ance exercises did not indicate statistically significant associations with variations in the presence of excess body weight.
The risk of excess body weight, regardless of the simultaneous contribution of age, marital status, housing, course year, course period and physical activity, was increas-ingly higher with the reduction in the frequency of fruit/vegetable intake. Compared to those who mentioned an intake of ≥ 5 portions/day, women who reported not con-suming fruits/vegetables were approximately three times more likely to have excess body weight (OR = 2.89 [95%IC: 2.28 – 3.62]). Among males, this proportion was near-ly two times higher (OR = 1.96 [95%CI: 1.44 – 2.60]). Moreover, exposure to the risk of excess body weight among university students who reported a frequency of fruit/ vegetable intake equivalent to 1-2 portions/day remained significant in both sexes (females – OR = 1.95 [95%CI: 1.43 – 2.58]; males – OR = 1.52 [95%CI: 1.09 – 2.04]).
TABLE 4 – Odds ratios and respective 95% confidence intervals (95%CI) for the association between excess body weight (overweight + obesity) and indicators of frequency of physical activity and fruit/ vegetable intake in a sample of Brazilian university students.
Women Men
Cardio-respiratory exercises
Performs ≥ 5 times/week Reference Reference
Performs 3-4 times/week 1.21 (0.93 – 1.54) 1.28 (0.98 – 1.63) Performs 1-2 times/week 1.33 (1.02 – 1.70) 1.46 (1.11 – 1.87) Does not perform 1.54 (1.15 – 1.98) 2.03 (1.62 – 2.49) Resistance exercises
Performs ≥ 5 times/week Reference Reference
Performs 3-4 times/week 0.70 (0.46 – 0.98) 0.65 (0.38 – 0.96) Performs 1-2 times/week 0.91 (0.66 – 1.23) 0.85 (0.64 – 1.11) Does not perform 1.21 (0.93 – 1.56) 1.12 (0.71 – 1.60) Fruit/vegetable intake
Intake ≥ 5 portions/day Reference Reference
Intake 3-4 portions/day 1.41 (0.95 – 1.95) 1.28 (0.93 – 1.71) Intake 1-2 portions/day 1.95 (1.43 – 2.58) 1.52 (1.09 – 2.04)
No intake 2.89 (2.28 – 3.62) 1.96 (1.44 – 2.60)
Values adjusted for age, marital status, housing, course year and period, and/or frequency of fruit/ vegetable intake and physical activity.
Discussion
Initially, the present study aimed to identify specific information about the fre-quencies of practice of resistance and cardio-respiratory exercises and fruit/vegeta-ble intake in a representative sample of Brazilian university students. Subsequently, it sought to establish possible associations between health behavior and the occur-rence of excess body weight (overweight + obesity), adjusted for control variables.
The specialized literature includes few cases of population-based studies that deal with the frequency of physical activity and food intake. Furthermore, there is no con-sensus for the measurement instruments used to estimate these types of health behav-ior among these studies. Differences in sample composition and selection procedures must also be taken into consideration as factors that hinder comparative analyses.
When information about the frequency of physical activity reported by univer-sity students was analyzed, the results showed a trend towards a reduction with
age and men being more committed to their practice, compared to women. Al-though certain differences in type of physical exercise can be found, the studies available in the literature agree that this practice tends to be negatively associated
with age, especially beginning in the last years of adolescence15,16. Although several
studies have sought to identify the reasons for such decrease, the proportion of contribution of biological and environmental factors and their interaction to the reduction in physical activity with age remain unclear.
Previous studies showed that adult males perform physical activity more
fre-quently than females16,17, corroborating the results found in the present study.
However, if, on the one hand, the practice of cardio-respiratory exercises predom-inated in women and men, on the other hand, there were important differenc-es in the distribution of frequency of rdifferenc-esistance and cardio-rdifferenc-espiratory exercisdifferenc-es between sexes. Among young adults, the ratios to identify differences in physi-cal activity between women and men are not clear. However, some studies have revealed the existence of a combination of socio-cultural and biological factors with a potential to encourage both sexes to practice physical activity. The greater involvement with physical activity shown by men can be partly explained by the fact that males are encouraged to practice highly physical activities since an early age, whereas women are directed towards activities that are more physically pas-sive. Likewise, the more effective participation of men in the practice of physical activities can be the result of greater positive reinforcement and promotion of
such practice received by them since childhood18.
Another possible explanation for the lower participation of women in physical activity is the different concept of body, capacity and attitude required to make more intense physical efforts. From the socio-cultural perspective, the concept of body which is usually associated with physical activity is not adjusted to current female models of corporeality. Effectively, in modern times, the ideal female body is characterized by grace, elegance, beauty and relative fragility, which does not seem to adjust to the image of a body involved with physical activity. This factor can cause women to show some reservations concerning the possibility of physical
activity, as this may affect their femininity19.
In addition to socio-cultural factors, differences in physical activity between sex-es can be equally due to biological factors. Lower muscle rsex-esistance and strength, higher level of body fat, greater diameter and depth of the pelvic area and discomfort during menstruation could be good reasons for women’s lower involvement with
physical activity20. Presence of sexual dimorphism should be seriously considered by
managers of intervention programs in public health, especially aiming to eliminate social prejudices against the participation of women in the practice of physical ac-tivity, which are culturally emphasized and valued from an individual perspective.
The high proportions of university students who reported not performing cardio-res-piratory (48.5%) and resistance exercises (67.5%) were one of the alarming findings. Previ-ous studies showed that, apart from being an important factor that predisposes young adults to organic and psychological disorders, the risk of insufficient and inadequate physical activity tends to increase with age. This suggests a higher possibility that such
behavior, harmful to health, will remain during more advanced adult stages of life 16,18.
Regarding the frequency of fruit/vegetable intake, the results found showed that only 3.7% of the study sample met the recommendations for adequate intake (≥ 5 portions/day). Although possible methodological differences and influences resulting from cultural characteristics, climate and food production and commer-cialization conditions can be found, this result corroborates previous estimates
found in studies involving the Brazilian population in general22 and, more
specif-ically, the population of university students4,9,22,23. However, this was significantly
lower than the findings from studies performed in developed countries24. In this
sense, assuming that the eating habit is one of the priority actions in the thematic agenda of public health, in view of the results found, there is the great challenge of education and health promotion in our reality.
Consistent with the results found in Brazilian studies9,21-23 and different
re-gions worldwide17,24,25, the frequency of fruit/vegetable intake was higher among
women and older university students. In fact, culturally speaking, the greater in-terest in questions about diet, health and beauty creates more concern about the consumption of low-calorie foods, which can have a positive influence on women’s
eating habits25, thus justifying the differences in fruit/vegetable intake between
genders. The higher fruit/vegetable intake found in older university students may be analyzed as a result of differences in the formation of eating habits in younger generations. In theory, this should consider the fact that they are more exposed to the eating pattern that predominates in modern society, which includes a larger amount of processed foods and high level of fat and sugar, to the detriment of veg-etable foods. Healthier eating habits at more advanced ages can also be associated with greater concern and health care and, consequently, follow the instructions provided by health professionals in a more effective way.
The association between the frequency of fruit/vegetable intake and marital sta-tus, housing and university course year found in the present study is in agreement
with some findings from the literature9,21-25. In this sense, possible casual
mecha-nisms must be taken into consideration when seeking an explanation for this as-sociation, as is the case of knowledge about nutrition and motivation to adopt a healthy diet. In fact, marketing and educational nutrition interventions are actions
that have proved to be highly effective in the search for a healthier diet26.
Regarding excess body weight, in general, it could be observed that its
occur-rence was similar to those found in university students in other countries27 and in
Brazil4. The results indicate that excess body weight was more prevalent in men,
coinciding with the findings from certain studies; however, this diverges from other studies that show similarities between both sexes. In this case, the differences found among studies can probably be attributed to several criteria used to define excess body weight, once there is no consensus regarding the use of only one criterion.
Another finding from the present study was the statistically significant and in-verse association between frequency of physical activity and fruit/vegetable intake and excess body weight identified in both sexes. It should be emphasized that both outcomes remained significantly associated, even after adjustments for control variables. In this case, lower risk of exposure for the occurrence of excess body weight among university students who most frequently perform physical activity and consume fruits/vegetables is consistent with evidence shown by other studies
involving different experimental designs and statistical treatment9,28.
Fruit/vegetable intake with an adequate frequency influences the occurrence of excess body weight through a specific effect on the greater proportion of com-plex carbohydrates and insoluble fibers found in plant foods, causing an increase in satiety and reduction in the caloric support of food intake. Contrary to diets in which manufactured products and high levels of fat and sugar predominate, diets with a more frequent fruit/vegetable intake tend to show lower amounts of simple carbohydrates and fats, which is inversely associated with greater calorie intake, a
One of the limitations of the present study was the fact that the sample was selected among university students who voluntarily decided to participate in the data collection. Thus, population inferences must be performed with caution. Additionally, the cross-sectional approach of data limits the establishment of as-sociations without considering the possibility of reverse causality. Furthermore, information about the frequency of physical activity, fruit/vegetable intake and anthropometric measurements (body weight and height) were self-reported. Thus, there could have been memory bias or even biased reports aimed at meeting one’s expectations. However, reporting these indicators is a current procedure in studies with such characteristics and the most viable way to perform large-scale surveys. The greater sample size enables us to somehow minimize a possible inaccuracy in the estimates calculated. Another limitation refers to the adequate fruit/vegetable intake being ≥ 5 portions/day, instead of being expressed in grams or portions con-sumed. Nonetheless, the measure of frequency of food intake, without considering
the size of portions, is very common in the international23 and national literature20.
In conclusion, the results found in this study mainly point to habits of physi-cal activity and fruit/vegetable intake that do not meet current recommendations. Approximately one third of the university students included in the sample showed excess body weight, similar to what was found in other studies performed in dif-ferent regions of the world. Variations in the occurrence of excess body weight was inversely and significantly associated with higher frequency of cardio-respira-tory exercises and fruit/vegetable intake. In the case of resistance exercises, lower chances of university students being categorized with excessive body weight oc-curred with a frequency of practice equivalent to 3-4 times/week. These findings indicate the need to promote initiatives aimed at the preparation and implemen-tation of health education and promotion programs in the university context, through actions of guidance on physical activity and food intake that can help to minimize the risks of onset and development of excess body weight.
Author contributions
A.G. Marques (0000-0001-6863-4809), M. Barbosa (0000-0002-3946-270X) and D. P. Guedes (0000-0002-7367-2276) equally participated in the article design, data collection and analysis, writing and critical review of the manuscript.
Declaration of interests
The authors report no conflicts of interest. The authors alone are responsible for the content and writing of the paper.
References
1. Ansari WE, Stock C, Mikolajczyk, RT. Relationships between food consumption and living arrangements among university students in four European countries – a cross-sectional study. Nut J. 2012;11:28.
2. Dodd LJ, Al-Makeeb Y, Nevill A, Forshaw MJ. Lifestyle risk factors of students: A cluster analytical approach. Prev Med. 2010;51(1):73-7.
3. Souza TF, José HPM;Barbosa, AR. Negative health behavior in Brazilian university students. Cien Saúde Coletiva. 2013;18(12):3563-75.
4. Maciel ES, Sonati JG, Modeneze DM, Vasconcelos JS, Vilarta R. Food intake, nutritional status and physical activity level in the Brazilian university population. Rev Nutr. 2012;25(6):707-18.
5. Kwan MYW, Faulkner GEJ, Arbour-Nicitopoulos KP, Cairney J. Prevalence of health-risk behaviours among Canadian post-secondary students: descriptive results from the National College Health Assessment. BMC Public Health. 2013;13:548.
6. Moreno-Gómez C, Romaquera-Bosch D, Tauler-Riera P, Bennasar-Veny M, Pericas-Beltran J, Martinez-Andreu S, et al. Clustering of lifestyle factors in Spanish university students: the relationship between smoking, alcohol consumption, physical activity and diet quality. Public Health Nutr. 2012;15(11):2131-39.
7. Rodríguez F, Palma X, Romo A, Escobar D, Aragú B, Espinoza L, et al. Eating habits, physical activity and socioeconomic level in Chilean university students. Nutr Hosp. 2013;28(2):447-55. 8. YRBS - Youth Risk Behavior Surveillance United States, 2011. MMWR 2012;61:4. 9. Tassitano RM, Tenório MCM, Cabral PC, Silva GAP. Clustering of physical inactivity
and low fruit and vegetables intake and associated factors in young adults. Rev Nutr. 2014;27(1):25-44.
10. Dean AG, Sullivan KM, Soe MM. OpenEpi: Open Source Epidemiologic Statistics for Public Health. www.OpenEpi.com. Updated 2013/04/06. Accessed 2016/08/04.
11. Goulart FAA. Non-communicable chronic diseases: control strategies and challenges for the health system. Organização Pan-Americana de Saúde – OPAS, Brasília, 2011. 12. Guedes DP, Teixeira M. Semantic and conceptual equivalence of the Portugurse version
of the National College Health Assessment II. Cad Saúde Pública. 2012;28(4):806-10. 13. WHO/FAO - World Health Organization/Food and Agriculture Organization. Diet,
nutrition and the prevention of chronic diseases. Tech Rep Ser 2003;916: 1-160,
14. OMS - Organização Mundial de Saúde. Physical status: the use and interpretation of anthropometry. Geneva: WHO, 1995.
15. Dumith SC, Gigante DP, Domingues MR, Kohl HW. Physical activity change during adolescence: a systematic review and a pooled analysis. Int J Epidemiol. 2011;40:685-98. 16. Varo JJ, Martínez-Gonzáles MA, Irala-Estévez J, Kearney J, Gibney M, Martínez JA.
Distribution and determinants of sedentary lifestyles in the European Union. Int J Epidemiol. 2003;32:138-46.
17. Jayawardene WP, Torabi MR, Lohrmann DK. Exercise in young adulthood with simultaneous and future changes in fruit and vegetable intake. J Am Coll Nutr. 2016;35(1):59-67. 18. Bauman AE, Reis RS, Sallis JF, Wells JC, Loos RJ, Martin BW, et al. Correlates of
physical activity: why are some people physically active and others not? Lancet. 2012;380(9838):258-71.
19. Wold B, Hendry L. Social and environmental factors associated with physical activity in Young people. In: Biddle S, Sallis JF, Cavill N, Editors. Young and Active? Young People and health-Enhancing Physical Activity – Evidence and Implications. London: Health Education Authority. 1998. p.119-32.
20. Slater A, Tiggermann M. Gender differences in adolescent sport participation, teasing, self-objectification and body image concerns. J Adolesc. 2011;34(3):455-63.
21. Brasil. Ministério da Saúde. Secretaria de Vigilância em Saúde. Departamento de Vigilância de Doenças e Agravos Não-Transmissíveis e Promoção da Saúde. Vigitel Brasil 2013: Surveillance of risk factors and protection against chronic diseases through telephone surveys. Brasília: Ministério da Saúde. 2014.
22. Ramalho AA, Dalamaria T, Souza OF. Regular fruit and vegetable intake among university students in Rio Branco, Acre, Northern Brazil: prevalence and associated factors. Cad Saúde Pública. 2012;28:1405-13.
23. Alsunni AA, Badar A. Fruit and vegetable consumption and its determinants among Saudi university students. J Taibah Univ Med Sci. 2015;10(2):201-7.
24. Centers for Disease Control and Prevention – CDC. Fruit and vegetable consumption among adults – United States 2005. MMWR. 2007;56(10):213-17.
25. Neslisah R, Emine AY. Energy and nutrient intake and food patterns among Turkish university students. Nutr Res Pract. 2011;5(2):117-23.
26. Pomerleau J, Lock K, Knai C, McKee M. Interventions designed to increase adult fruit and vegetable intake can be effective: a systematic review of literature. J Nutr. 2005;135:2486-95. 27. Peltzer K, Pengpid S, Samuels TA, Özcan NK, Mantilla C, Rahamefy OH, Wong ML,
Gasparishvili A. Prevalence of overweight/obesity and its associated factors among university students from 22 countries. Int J Environ Res Public Health. 2014;11(7):7425-41. 28. Petribú MMV, Cabral PC, Arruda IKG. Nutritional status, food intake and cardiovascular
risk: a study among university students. Rev Nutr. 2009;22(6):837-46.
29. Ledoux TA, Hingle MD, Baranowsli T. Relationships of fruit and vegetable intake with adiposity: a systematic review. Obes Rev. 2011;21(5):143-50.
Corresponding Author
Andréa Grano Marques
RECEIVED 13/10/2016 REVISED 21/12/2016 APPROVED 21/12/2016
Rua Joaquim Murtinho 46 – Zona 4 Maringá – Paraná – Brazil 87014-210