DOI: http://dx.doi.org/10.5007/1980-0037.2014v16n3p258
original article
Licence Creative Commom
CC
BY
RBCDH
1 Universidade Norte do Paraná. Centro de Pesquisa em Ciências da Saúde, Londrina, Paraná, Brasil.
2Universidade Estadual de Montes Claros. Centro de Ciências Bioló-gicas e da Saúde. Departamento de Educação Física, Montes Claros, Minas Gerais, Brasil.
3 Secretaria de Educação de Fran-cisco Sá, Minas Gerais, Brasil.
Received: 29 July 2013 Accepted: 27 September 2013
Anthropometric nutritional of adolescents
from a region of low economic development
in Brazil: comparison with the WHO-2007
reference
Antropometria nutricional de adolescentes de uma
região brasileira de baixo desenvolvimento econômico:
comparação com referência OMS-2007
Dartagnan Pinto Guedes 1
Jaime Tolentino Miranda Neto 2
Maria das Mercês da Silva 3
Abstract – he identiication of nutritional inadequacies in speciic segments of the youth population can provide the basis for public health intervention. he objective of this study was to evaluate anthropometric indicators of nutritional status in a sample of adolescent schoolchildren from a region of low economic development in Brazil. he sample consisted of 1,538 subjects ranging in age from 15 to 18 years, including 1,036 girls and 502 boys. Nutritional status was assessed based on height and body mass index (BMI) and comparisons were made to the corresponding percentile distributions of the Word Health Organizations-2007 (WHO-2007) reference. he percentile distributions for height and BMI in the two genders difered signiicantly from the WHO-2007 refer-ence. here was a high proportion of adolescents with short height (< 10th percentile) and indication of overweight/obesity (> 90th percentile). herefore, although being a region of low economic growth and with one of the lowest social indicators in the country, excess body weight was an important problem associated with nutritional status. he high pro-portion of overweight/obesity highlights the need to implement public policies designed to promote healthy eating habits and physical activity.
Key words: Growth; Height; Nutritional status; Overweight; Obesity; Undernutrition.
he association of anthropometric indicators used to identify nutritional inadequacies with health status and well-being is well documented in the literature. Evidence suggests that a growth deicit in height at an early age can afect cognitive development, favoring the occurrence of infectious-contagious
diseases, limiting physical capacity1, and increasing the risk for numerous
degenerative diseases in early adulthodd2. On the other hand, overweight and
obesity are known to be related to the development of diabetes, heart diseases,
osteoarthritis and some types of cancer, among other chronic diseases3.
Over-weight or obese young people tend to present a higher incidence of problems
related to self-esteem and self-concept that afect interpersonal relations4.
Nutrition transition is a process characterized by changes in eating patterns and physical activity over time. Although afecting the general population, especially societies in developing countries, this process may difer in terms of time and intensity of occurrence depending on the epide-miological context considered. A fundamental characteristic of the process of nutrition transition is a reduction in the prevalence of height growth deicits and an increase in the frequency of overweight and obesity, called
double burden of malnutrition5. In this respect, the identiication of possible
nutritional inadequacies in speciic segments of the youth population may provide the basis for public health intervention programs.
Observation of the process of nutrition transition in Latin American countries, speciically Brazil, over the past decades showed an important
change in the prevalence of nutritional inadequacies6-9. However, with some
exceptions10,11, very little is known about populations that live in regions
of low economic growth in Brazil. herefore, the objective of the present study was to evaluate the nutritional status, particularly the prevalence of height growth deicits and of overweight/obesity, in a sample of adolescent boys and girls from a region of low economic growth in Brazil.
METHODOLOGICAL PROCEDURES
A cross-sectional study was conducted on adolescents of both genders ranging in age from 15 to 18 years, who were enrolled in public and private schools in the town of Francisco Sá, Minas Gerais. Data were collected between August and October 2011 and the intervention protocols used were approved by the Ethics Committee of the State University of Montes Claros (Universidade Estadual de Montes Claros – UNIMONTES).
Francisco Sá is an imperial town founded in 1704 which is located in the northern region of the state of Minas Gerais, approximately 60 km from the border with the state of Bahia. he region is characterized by a tropical semi-arid climate. he town has a population of approximately 25,000 inhabitants and the main economic activity is subsistence
agricul-ture. With a mean human development index (IDH) of 0.581 (IDHEducation
Anthropometric indicators of nutritional status in adolescents Guedes et al.
the lowest development indices compared to other cities in Brazil with a similar population density. he mean IDH-2000 of cities located in the southeastern and southern regions is 0.844 and 0.825, respectively, and the
Brazilian IDH-2000 is 0.80012. With respect to infant mortality, another
indicator classically used to evaluate the level of development of a region, available data indicate 92 deaths per 1,000 live births.
he subjects were selected for the study by inviting all students enrolled in the 8th and 9th grades of elementary school and in the 1st, 2nd and 3rd years
of high school (ive public schools and one private school) of the second cycle of elementary school and high school in Francisco Sa. According to data from the Statistics Sector of the Department of Education of the state of Minas Gerais, at the beginning of 2011 a total of 1,912 students were enrolled in the ive school years that were the focus of the study. he following exclusion criteria were adopted: (a) lack of authorization by the parents or legal guardian; (b) absence on the day of data collection; (c) some physical problem impairing the anthropometric measurements on that occasion, and (d) chronological age < 15 years and > 18 years. Only students ≥ 15 years, an age when young people are close to the adult stage, were selected to minimize the possible impact of individual variations in biological maturity on the measurement of height and body weight. hus, the inal sample consisted of 1,538 adolescents (1,036 girls and 502 boys).
he chronological age of the participants was determined as the dif-ference between the date of data collection and date of birth in years and months. However, two age groups were considered for the efect of analysis: 15-16 years (560 girls and 308 boys) and 17-18 years (476 girls and 194 boys). he anthropometric indicators of nutritional status were deined based on height and body mass index (BMI), i.e., the ratio between body weight in
kilograms and the square of the height in meters (kg/m2), according to the
reference proposed by the World Health Organization (WHO-2007)13. BMI
data instead of body weight alone were used because of the association be-tween changes in linear growth and weight gain velocity during puberty as a result of events associated with biological maturation. As a consequence, the exclusive use of body weight as an indicator of nutritional status is not
recommended for children older than 10 years14.
Height was measured with a 1-mm aluminum stadiometer (Seca, model 870, Hamburg, Germany). Body weight was measured with an anthro-pometric scale (Seca, model 879, Hamburg, Germany) to the nearest 10
g. All measurements were made according to WHO recommendations15.
he examiner team consisted of two physical education professionals with experience in these anthropometric measurements. Regarding data quality, replicates of body weight and height measurements were taken for every 10 subjects who participated in the deinitive sample of the study. he magnitude of the technical error of measurement ranged from 30 to 50 g for body weight and from 1 to 5 mm for height.
standard deviation) and two-way analysis of variance with interactions involving two classiication criteria (gender and age) were used for charac-terization of the sample. When necessary, Schefe’s multiple comparisons test was applied to identify speciic diferences. For analysis of height and BMI of the adolescents selected in relation to the WHO-2007 reference, the
chi-square (χ2) test for adherence between observed relative frequency and
percentile distributions of the WHO-2007 reference was used (< P10; P10-P20; P20-P30; P30-P40; P40-P50; P50-P60; P60-P70; P70-P80; P80-P90; > P90). he percentile distributions were calculated based on the values corresponding to L, M and S of each gender and age of the WHO-2007 reference. Signiicant diferences between genders were identiied using
the chi-square (χ2) test for homogeneity between the observed relative
frequencies in girls and boys corresponding to the percentile distributions of the WHO-2007 reference.
RESULTS
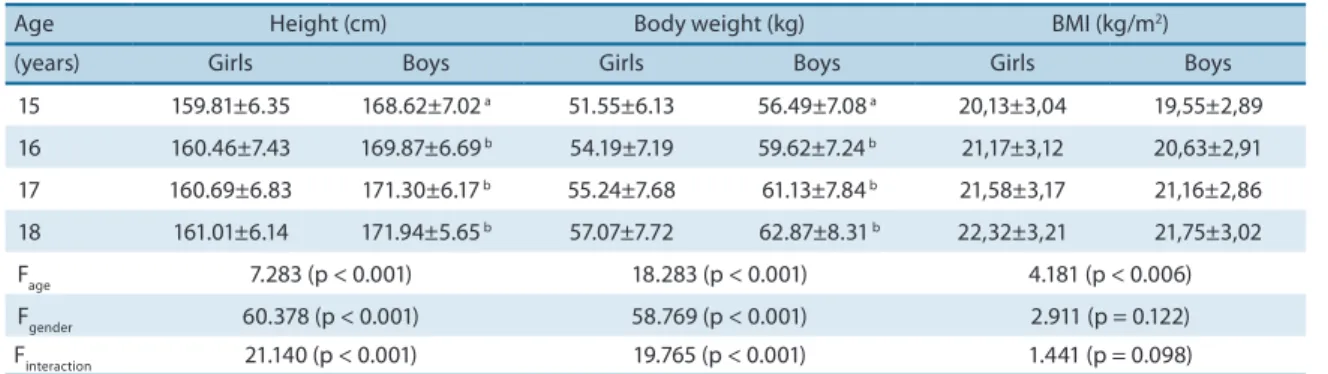
Table 1 shows the statistical analysis of height, body weight and BMI in the sample selected for the study. Boys were heavier and taller than girls. BMI increased with age, but was similar in both genders.
Table 1. Mean, standard deviation and F statistics of height, body weight and body mass index in the adolescents studied.
Age Height (cm) Body weight (kg) BMI (kg/m2)
(years) Girls Boys Girls Boys Girls Boys
15 159.81±6.35 168.62±7.02 a 51.55±6.13 56.49±7.08 a 20,13±3,04 19,55±2,89
16 160.46±7.43 169.87±6.69 b 54.19±7.19 59.62±7.24 b 21,17±3,12 20,63±2,91
17 160.69±6.83 171.30±6.17 b 55.24±7.68 61.13±7.84 b 21,58±3,17 21,16±2,86
18 161.01±6.14 171.94±5.65 b 57.07±7.72 62.87±8.31 b 22,32±3,21 21,75±3,02
Fage 7.283 (p < 0.001) 18.283 (p < 0.001) 4.181 (p < 0.006)
Fgender 60.378 (p < 0.001) 58.769 (p < 0.001) 2.911 (p = 0.122)
Finteraction 21.140 (p < 0.001) 19.765 (p < 0.001) 1.441 (p = 0.098)
BMI: body mass index. Superscript letters indicate signiicant diferences between genders: a 0.01 < p < 0.05; b p < 0.01.
Anthropometric indicators of nutritional status in adolescents Guedes et al.
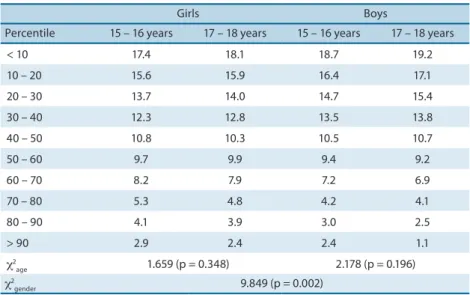
between age groups. However, the observed prevalence of height deicits
was signiicantly higher in boys (χ2 = 9.849, p = 0.002).
Table 2. Proportion (%) of adolescents with a height located within the percentiles of the WHO-2007 reference.
Girls Boys
Percentile 15 – 16 years 17 – 18 years 15 – 16 years 17 – 18 years
< 10 17.4 18.1 18.7 19.2
10 – 20 15.6 15.9 16.4 17.1
20 – 30 13.7 14.0 14.7 15.4
30 – 40 12.3 12.8 13.5 13.8
40 – 50 10.8 10.3 10.5 10.7
50 – 60 9.7 9.9 9.4 9.2
60 – 70 8.2 7.9 7.2 6.9
70 – 80 5.3 4.8 4.2 4.1
80 – 90 4.1 3.9 3.0 2.5
> 90 2.9 2.4 2.4 1.1
χ2
age 1.659 (p = 0.348) 2.178 (p = 0.196)
χ2
gender 9.849 (p = 0.002)
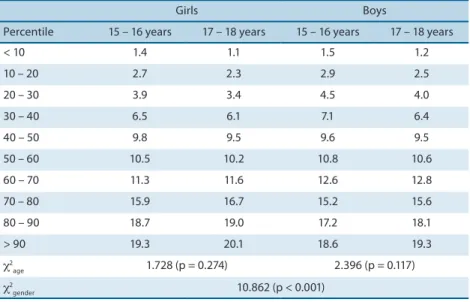
Table 3 shows the observed relative frequency for BMI in relation to the percentiles of the WHO-2007 reference. In contrast to height, the con-centration of observed cases in the irst deciles was less than the expected 10% in both age groups, indicating a greater deicit in BMI among boys. In sequence, a clear trend of a gradual increase in frequencies was observed in higher deciles, with the observed relative frequencies and WHO-2007 reference being closely similar in intermediate percentiles. In the upper deciles (P70-80, P80-90 and P > 90), the relative frequencies were above the expected 10%, particularly among girls. In both genders, through chi-squared test for adherence was found that the observed relative frequen-cies difered signiicantly from the corresponding deciles proposed by the
WHO-2007 references (χ2 = 64.823, p < 0.001). he homogeneity test showed
similar observed relative frequencies in the two age groups, whereas
sig-niicant diferences were observed between genders (χ2 = 10.862, p < 0.001).
Figure 1 illustrates the comparison between the observed relative frequencies for height and BMI in relation to the WHO-2007 reference percentiles. Speciically regarding height, the observed relative frequen-cies in the irst decile (17.8% of girls and 18.9% of boys) were almost twice the expected 10%, whereas only 2.7% of girls and 1.8% of boys were found
above the 90th percentile. With respect to BMI, the observed relative
Girls Boys
Percentile 15 – 16 years 17 – 18 years 15 – 16 years 17 – 18 years
< 10 1.4 1.1 1.5 1.2
10 – 20 2.7 2.3 2.9 2.5
20 – 30 3.9 3.4 4.5 4.0
30 – 40 6.5 6.1 7.1 6.4
40 – 50 9.8 9.5 9.6 9.5
50 – 60 10.5 10.2 10.8 10.6
60 – 70 11.3 11.6 12.6 12.8
70 – 80 15.9 16.7 15.2 15.6
80 – 90 18.7 19.0 17.2 18.1
> 90 19.3 20.1 18.6 19.3
χ2
age 1.728 (p = 0.274) 2.396 (p = 0.117)
χ2
gender 10.862 (p < 0.001)
Anthropometric indicators of nutritional status in adolescents Guedes et al.
DISCUSSION
In the present study, the anthropometric measures of height and BMI were used to estimate the nutritional status of a representative sample of adolescent schoolchildren from a region of low economic development in Brazil. he distribution of observed relative frequencies did not correspond to the deciles of the WHO-2007 reference, since no uniform proportions of 10% were observed. In both genders, the relative frequencies for height were markedly higher in the irst deciles and deicient in the last deciles. hese indings suggest that the levels of physical growth of the adolescents selected are below internationally accepted standards. With respect to BMI, the concentrations of relative frequencies were higher in the upper deciles, indicating a high prevalence of overweight adolescents.
Since the sample consisted of adolescents, the inluence of individual variations in the stages of biological maturity on the identiication of relative frequency distributions in relation to normative reference values cannot be ruled out. hese individual variations can advance or delay the physical growth spurt, resulting in temporary advantages or disadvantages
associ-ated with height and body weight14. However, the height deicits and higher
proportions of overweight/obesity observed in the present study do not seem to be attributable to this fact, since the greatest diferences in comparison with the WHO-2007 reference were observed at 17-18 years, an age when the selected adolescents were probably already close to adult maturity.
According to the literature, the greatest height deicits and an increased risk of overweight/obesity in youth populations from developing regions are observed exactly in adolescence, even when controlling for factors
related to the time of onset and duration of maturation16-20. his inding
can be explained by the fact that signiicant alterations related to physical growth occur during this period of human development, thus requiring an adequate and balanced metabolic supply of energy, amino acids, vitamins
and mineral salts, associated with various endogenous secretions21. In
ad-dition, delays in height growth identiied at the end of adolescence may relect speciic aggravations resulting from the late and cumulative efects
of nutritional stress that occurred at an earlier age14.
he proportions of height deicits and overweight/obesity were not dis-tributed equally among boys and girls in the population segment analyzed. On the one hand, height deicit proportions were signiicantly higher among boys while, one the other hand, the proportions of overweight/obesity were signiicantly higher among girls. Important diferences in the frequency of height deicits and overweight/obesity between genders have also been
reported in other studies16-20.
he diferences in height deicit proportions between girls and boys may be explained by sex diferences in environmental sensitivity, particularly sensitivity to nutritional factors. Although the explanations and
mecha-nisms underlying this phenomenon are not well deined, Stinson 22 found
growth retardation and development of contagious diseases than girls. In contrast, the higher proportions of overweight/obesity among girls might be explained in part by the fact that the female organism is more vulnerable to body fat accumulation caused by sex hormones at ages close
to puberty23. Diferences in physical activity habits may also contribute to
the diferences in the prevalence of overweight/obesity between genders. In adolescence, boys are consistently more physically active than girls, either through daily activities or systematic exercise and sports programs,
diferences that become more marked with age24.
he simultaneous presence of height deicits and overweight/obesity in the selected sample of adolescents may be related to the epidemiological transition recently observed in developing regions of Brazil. In this respect, speciically in the northern region of the state of Minas Gerais which was the target population of the present study, the social and infrastructure improvements in public services, especially in the education and health sectors, observed in recent years, together with the current welfare and income transfer programs, had a stronger impact on body weight increase than on the maintenance of the height growth potential of young people. A decade ago, no initiatives with these characteristics existed for the period of childhood of the current adolescents, a period that interferes strongly with the deinition of future height. As a consequence, the high proportion of height deicits observed may also relect speciic nutritional deiciencies that occurred at an earlier age. A similar phenomenon has been observed
for youth populations from other regions in Brazil25,26 and from African
countries27, which signiicantly modiies trends in the prevalence of
an-thropometric indicators related to nutritional status.
In particular, low body weight/thinness, an important condition that
afected the Brazilian child population in past decades28, seems to be a
nutritional problem that will soon be overcome in the population segment analyzed. In this respect, according to the statistical criterion adopted for the epidemiological classiication of nutritional deicits, a prevalence of up
to 2.5% is acceptable for populations with good nutritional status15. In the
Anthropometric indicators of nutritional status in adolescents Guedes et al.
population of towns in the northern region of Minas Gerais. In addition, the cross-sectional design of the study does not permit to establish a causal relationship between the outcomes related to height deicits and overweight/ obesity in the adolescents studied.
In conclusion, comparison of the height and BMI data observed in the present study with the WHO-2007 reference shows a signiicant diference in percentile distributions. he adolescents studied here presented impor-tant height deicits. In addition, although the population segment was from a region of low economic growth and with the lowest social indicators of the country, excess body weight for height was another important problem associated with nutritional status. he high proportions of overweight/ obesity observed indicate the urgent need to implement public policies for health promotion, especially those designed to promote healthy eating habits and physical activity.
Since both height deicits and overweight/obesity are conditions with short- and long-term health consequences, the proile of the two nutritional indicators highlights the importance of maintaining measures designed to control hunger and malnutrition in the population. However, it is necessary to adapt current guidelines and to clearly deine their beneits due to the possible efects that high-calorie foods with a low nutritional value, associated with a low level of physical activity, may exert on body fat accumulation. In this respect, access of the population to foods should be accompanied by speciic educational measures that promote adequate food intake to meet nutritional requirements and regular physical exercise to increase energy expenditure.
REFERENCES
1. Best C, Neuingerl N, van Geel L, van den Briel T, Osendarp S. he nutritional status of school-aged children: why should we care? Food Nutr Bull 2010;31(3):400-17. 2. Flegal KM, Graubard BI, Williamson DF, Gail MH. Excess deaths associated with
underweight, overweight, and obesity. JAMA 2005;293(15):1861-7.
3. Park MH, Falconer C, Viner RM, Kinra S. he impact of childhood obesity on mor-bidity and mortality in adulthood: a systematic review. Obes Rev 2012;13(11):985-1000.
4. Kiess W, Galler A, Reich A, Müller G, Kapellen T, Deutscher J, et al. Clinical aspects of obesity in childhood and adolescence. Obes Rev 2001;2(1):29-36.
5. Popkin BM. Urbanization, lifestyle changes and the nutrition transition. World Dev 1999;27(10):1905-16.
6. Anjos LA, Castro IRR, Engstrom EM, Azevedo MAS. Crescimento e estado nu-tricional em amostra probabilística de escolares do município do Rio de Janeiro. Cad Saúde Pub 2003; 19 (1 Supl): 171-179.
7. Silva HGV, Chiara VL, Barros ME, Rego AL, Ferreira A, Pitasi BA, et al. Diag-nóstico do estado nutricional de escolares: comparação entre critério nacional e internacional. J Pediatr 2008; 84(6):550-5.
8. Machado Z, Krebs RJ, Prestes JD, Santos MB, Santos JOL, Nobre GC, et al. Cresci-mento físico e estado nutricional de escolares: estudo comparativo 1997-2009. Rev Bras Cineantropom Desempenho Hum 2011; 13(3):216-22.
Corresponding author
Dartagnan Pinto Guedes Rua Ildefonso Werner 177 Condomínio Royal Golf
CEP 86055-545 – Londrina, Paraná, Brasil
E-mail: [email protected]
11. Petroski EL, Silva RJ, Pelegrini A. Crescimento físico e estado nutricional de crianças e adolescentes da região de Cotinguiba, Sergipe. Rev Paul Pediatr 2008; 26(3):206-11. 12. Programa das Nações Unidas para o Desenvolvimento. Atlas do Desenvolvimento
Humano no Brasil. Ranking do IDH dos Municípios do Brasil 2003. Brasília: PNUD; 2003.
13. De Onis M, Onyango AW, Borghi E, Siyam A, Nishida C, Siekmann J. Develop-ment of a WHO growth reference for school-aged children and adolescents. Bull WHO 2007; 85(9):660-7.
14. Rosen DS. Physiologic growth and development during adolescence. Pediatr Rev 2004; 25(6):194-200.
15. World Health Organization. Physical status: the use and interpretation of anthro-pometry. Report of a WHO Expert Committee. [Technical Report Series n° 854]. Geneva: WHO; 1995.
16. Bovet P, Kizirian N, Madeleine G, Blössner M, Chiolero A. Prevalence of thinness in children and adolescents in the Seychelles: comparison of two international growth references. Nut J 2011;10:65.
17. Kelishadi R, Ardalan G, Gheiratmand R, Majdzadeh R, Hosseini M, Gouya MM, et al. hinness, overweight and obesity in a national sample of Iranian children and adolescents: CASPIAN Study. Child Care Health Dev 2008;34(1):44-54.
18. Ben-Bassey UP, Oduwole AO, Ogundipe OO. Prevalence of overweight and obesity in Eti-Osa LGA, Lagos, Nigeria. Obes Rev 2007;8(6):475-9.
19. Laxmaiah A, Nagalla B, Vijayaraghavan K, Nair M. Factors afecting prevalence of overweight among 12- to 17-year-old urban adolescents in Hyderabad-India. Obesity (Silver Spring) 2007;15(6):1384-90.
20. Xie B, Chou CP, Spruijt-Metz D, Reynolds K, Clark F, Palmer PH, et al. Socio-demographic and economic correlates of overweight status in Chinese adolescents. Am J Health Behav 2007;31(4):339-52.
21. Rogol AD, Clark PA, Roemmich JN. Growth and pubertal development in children and adolescents: efects of diet and physical activity. Am J Clin Nutr 2000; 72(2 Suppl):S521-8.
22. Stinson S. Sex diferences in environmental sensitivity during growth and develop-ment. Am J Phys Anthrop 1985;28(1):123-47.
23. Malina RM, Bouchard C, Bar-Or O. Growth, maturation, and physical activity. 2nd ed. Champaign: Human Kinetics; 2004.
24. Ferreira I, van der Horst K, Wendel-Vos W, Kremers S, van Lenthe FJ, Brug J. Environmental correlates of physical activity in youth: a review and update. Obes Rev 2006;8(2):129-54.
25. Guedes DP, de Matos JA, Lopes VP, Ferreirinha JE, Silva AJ. Physical growth of schoolchildren from the Jequitinhonha Valley, Minas Gerais, Brazil: comparison with the CDC-2000 reference using the LMS method. Ann Hum Biol 2010;37(4):574-84.
26. Guedes DP, Rocha GD, Silva AJ, Carvalhal IM, Coelho EM. Efects of social and environmental determinants on overweight and obesity among Brazilian school-children from a developing region. Rev Panam Salud Publica 2011;30(4):295-302. 27. Prista A, Maia JA, Damasceno A, Beunen G. Anthropometric indicators of nutri-tional status: implications for itness, activity, and health in school-age children and adolescents from Maputo, Mozambique. Am J Clin Nutr 2003;77(4):952-9. 28. Monteiro CA, Benicio MH, Iunes R, Gouveia NC, Taddei JA, Cardoso MA. ENDF