Sunflower enzymatic reaction optimization: MAG and DAG formation
Otimização da reação enzimática do girassol: formação de MAG e DAG
DOI:10.34117/bjdv6n5-299
Recebimento dos originais: 10/04/2020 Aceitação para publicação: 15/05/2020
Edinara Adelaide Boss
Dra. em Engenharia Química pela Universidade Estadual de Campinas - UNICAMP Instituições: 1. Centro Universitário Adventista de São Paulo (UNASP),
Endereço: Estrada Municipal Pr. Walter Boger, s/n Lagoa Bonita - Engenheiro Coelho - SP Caixa Postal 11 - CEP: 13165-970
2. School of Chemical Engineering State University of Campinas
Endereço: Avenida Albert Einstein,500, Zip Code 13083-852 Campinas - SP, Brazil
E-mail: [email protected]
Mariana Leme Calais
Mestre em Engenharia Química pela Universidade Estadual de Campinas - UNICAMP Instituição: School of Chemical Engineering
State University of Campinas
Endereço: Avenida Albert Einstein,500, Zip Code 13083-852 Campinas - SP, Brazil
E-mail:[email protected]
Maria Regina Wolf Maciel
Dra. em Engenharia Química - The Leeds University (Leeds, ENGLAND, UK) Instituição: School of Chemical Engineering
State University of Campinas
Endereço: Avenida Albert Einstein,500, Zip Code 13083-852 Campinas - SP, Brazil
E-mail: [email protected]
Paula Sbaite
Dra. em Engenharia Química pela Universidade Estadual de Campinas - UNICAMP Instituição: School of Chemical Engineering
State University of Campinas
Endereço: Avenida Albert Einstein,500, Zip Code 13083-852 Campinas - SP, Brazil
E-mail:[email protected]
Rubens Maciel Filho
Dr. em Engenharia Química - The Leeds University (Leeds, ENGLAND, UK) Instituição: School of Chemical Engineering
State University of Campinas
Endereço: Avenida Albert Einstein,500, Zip Code 13083-852 Campinas - SP, Brazil
ABSTRACT
Monoacylglycerols (MAG) and diacylglycerols (DAG) are emulsifiers widely used in food and cosmetic industries. Typical industrial processes for MAG and DAG production consist of the catalytic glycerolysis of triacylglycerols at high temperatures (>200°C). However, the inorganic catalyst and the high temperature contribute to the formation of a product often dark and with unpleasant smell. The goal of this work is the use of enzymatic glycerolysis to improve product aspect and quality, increase selectivity and decrease energy consumption. This reaction produces a mixture of approximately 20% of MAG and 50% of DAG. In order to evaluate the effects of reaction parameters in the MAG and DAG content after the enzymatic glycerolysis reactions of refined sunflower oil a 23 experimental design was employed. A surface response analysis was used to optimize this process.
Keywords: glycerolysis; sunflower oil; enzyme catalysis; experimental design
RESUMO
Monoacilgliceróis (MAG) e diacilgliceróis (DAG) são emulsificantes amplamente utilizados nas indústrias de alimentos e cosméticos. Os processos industriais típicos para a produção de MAG e DAG consistem na glicerólise catalítica de triacilgliceróis a altas temperaturas (> 200 ° C). No entanto, o catalisador inorgânico e a alta temperatura contribuem para a formação de um produto geralmente escuro e com cheiro desagradável. O objetivo deste trabalho é o uso de glicerólise enzimática para melhorar o aspecto e a qualidade do produto, aumentar a seletividade e diminuir o consumo de energia. Esta reação produz uma mistura de aproximadamente 20% de MAG e 50% de DAG. Para avaliar os efeitos dos parâmetros de reação no conteúdo de MAG e DAG após as reações enzimáticas de glicerólise do óleo de girassol refinado, foi empregado um delineamento experimental. Uma análise de resposta de superfície foi usada para otimizar esse processo.
Palavras chave: glicerólise; óleo de girassol; catálise enzimática; design experimental
1 INTRODUCTION
MAG and DAG mixture are used in several applications due to their low costs (1). MAGs are important emulsifiers, besides possessing some interesting properties such as poor flavor and biodegradability. Due to its physicochemical properties, DAG utilization includes the following applications: cooking oil, margarine (antiblooming), spreads, butter cream, sauces, mayonnaise, baked goods and others (2).
The present work reports a sunflower oil glycerolysis with 1,3 specific lipase: Novozym 435. The food industry has a great interest in this reaction since no solvents are used in the process.
A large quantity of papers about enzymatic glycerolysis of vegetable oil can be found in the literature, but this work reports the optimization of this reaction in view of the subsequent molecular distillation for product concentration.
Due to the importance of this reaction step, an experimental design for process optimization by a surface analysis response was developed.
Initially a full factorial design was used, with 23 = 8 trials and three central points. The generated
design with 17 trials involving the axial points of the independent variables to analyze more accurately the value of the obtained MAG and DAG (response variables).
2 MATERIAL AND METHODS
Commercial refined sunflower oil was used. Its properties and composition are presented in Table 1 and 2, respectively. Glycerol (99%, 0.5% of water content) was supplied by Synth (São Paulo, Brazil) and lipase from Candida antarctica B (Novozyme 435, immobilized lipase) was used as catalyst.
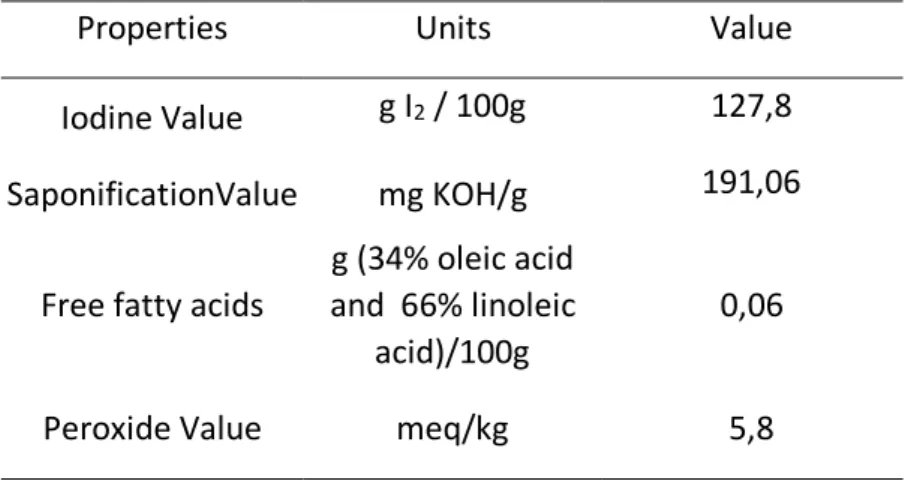
Table 1: Physical and chemical properties of sunflower oil used as feedstock.
Properties Units Value Iodine Value g I2 / 100g 127,8
SaponificationValue mg KOH/g 191,06 Free fatty acids
g (34% oleic acid and 66% linoleic
acid)/100g
0,06
Peroxide Value meq/kg 5,8
Table 2: Composition of sunflower oil used as feedstock.
Composition value(%) C14:0 0,07 C16:0 6,32 C16:1 0,09 C18:0 3,53 C18:1 29,57 C18:2 58,47 C18:3 0,33 C20:0 0,30 C20:1 0,22
C22:0 0,71
C24:0 0,25
2.1 REACTOR SYSTEM
The enzymatic glycerolysis reaction was carried out in a five batch reactors system showed in Figure 1. This system includes reactors disposed in series connected with a thermoregulated water bath. Each reactor possesses a magnetic stirrer, a thermocouple and a resistance to guarantee temperature control during the process.
The reaction mixture consisted of glycerol and sunflower oil, immobilized lipase and an extra 3.5 % of water (based on glycerol amount). The reactions were stopped after 24 hours. The final product separated into two liquid phases after the lipase-catalyzed glycerolysis: the lower phase containing glycerol, water and lipases and the upper phase containing acylglycerols, Free Fatty Acid (FFA) and residues of Glycerin (GL).
Figure1: Batch reactors system.
2.2 ANALYSIS OF ACYLGLYCEROLS BY HPSEC
The determination of acylglycerols composition, FFA and GL were performed using gel-permeation chromatography (GPC), also called high-performance size-exclusion chromatography (HPSEC) (3). The chromatographic system consists of an isocratic pump, model 515 HPLC Pump (Waters, Milford, MA), a differential refractometer detector model 2410 (Waters, Milford, MA) and an oven for columns maintained at 40ºC by a temperature control module (Waters, Milford, MA).
Two HPSEC columns Styragel HR 0.5 and HR 1 (Waters, Milford, MA) were connected in series. These columns are packed with styrenedivinylbenzene co-polymer. The used mobile phase
was HPLC-grade tetrahydrofuran and the flow rate was 0.7 mL/min. The typical pressure at this flow rate was 450 PSI (3102 kPa). The products of the reaction, DAG, MAG and FFA, as well as TAG and GL were separated based on the differences of molar weight (4).
2.3 EXPERIMENTAL DESIGN
The experimental design is a punctual analysis of a limited set of variables (5). This method is interesting in relation to the conventional method of manipulation of a single parameter per trial, for such an approach frequently fails to locate optimal conditions for the process due to its inability to consider the effect of possible interactions between factors. Moreover, the factorial design makes it possible to take advantage of practical knowledge about process during the final response surface analysis (6). The present work aims the optimization of sunflower oil enzymatic glycerolysis process using experimental design methodology through the surface analysis response.
The variables selected for each response were the following: enzyme percentage (oil mass : enzyme mass), glycerin quantity (oil molar fraction : glycerin molar fraction) and temperature (oC).
The variable levels are presented in Table 3.
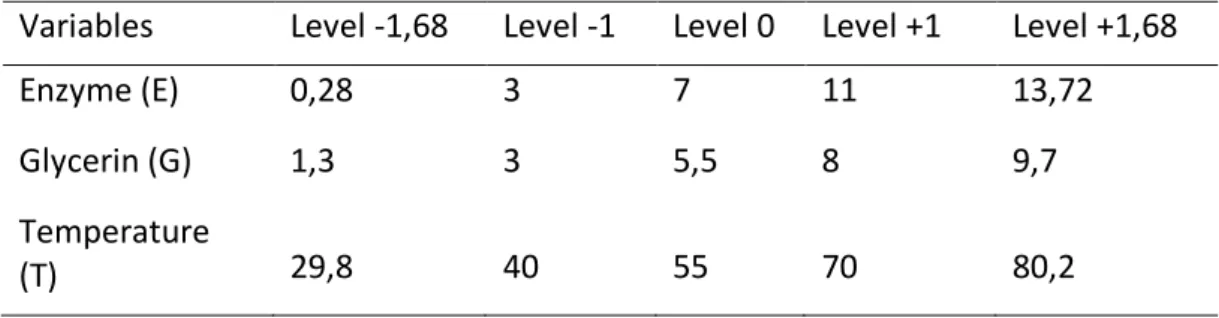
Table 3: Variable levels for MAG and DAG formation.
Variables Level -1,68 Level -1 Level 0 Level +1 Level +1,68
Enzyme (E) 0,28 3 7 11 13,72
Glycerin (G) 1,3 3 5,5 8 9,7
Temperature
(T) 29,8 40 55 70 80,2
The central point was chosen based on preliminary experiments with satisfactory results.
3 RESULTS
Table 4 depicts the experimental design and the results obtained for MAG and DAG formation, in a total of 17 experiments.
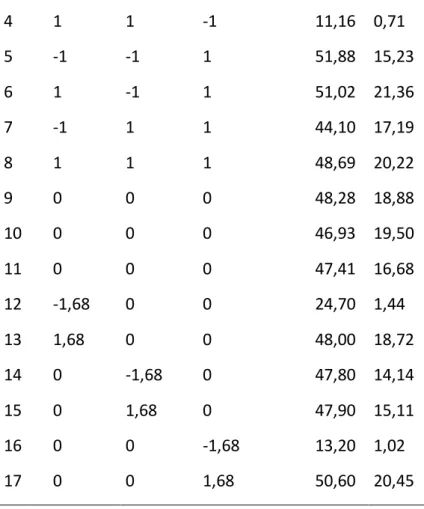
Table 4: Experimental design and results.
Trial Enzyme Glycerin Temperature DAG MAG
1 -1 -1 -1 22,07 3,00
2 1 -1 -1 32,61 6,35
4 1 1 -1 11,16 0,71 5 -1 -1 1 51,88 15,23 6 1 -1 1 51,02 21,36 7 -1 1 1 44,10 17,19 8 1 1 1 48,69 20,22 9 0 0 0 48,28 18,88 10 0 0 0 46,93 19,50 11 0 0 0 47,41 16,68 12 -1,68 0 0 24,70 1,44 13 1,68 0 0 48,00 18,72 14 0 -1,68 0 47,80 14,14 15 0 1,68 0 47,90 15,11 16 0 0 -1,68 13,20 1,02 17 0 0 1,68 50,60 20,45
The effect of each variable on each response are presented in Tables 5 and 6. Figures 2 and 3 show the Pareto charts for a 90% confidence level for the codified values.
Table 5: Effects estimates on MAG (%).
Effect Purê t(2) p Factor Error Mean/Interc. 18,41* 0,85 21,56 0,00 (1)Enzyme (L) 6,12* 0,80 7,63 0,02 Enzyme (Q) -6,24* 0,88 -7,05 0,02 (2)Glycerin(L) -0,84 0,80 -1,04 0,41 Glycerin(Q) -3,01* 0,88 -3,41 0,08 (3) Temperature (L) 14,09* 0,80 17,55 0,00
Temperature (Q) -5,77* 0,88 -6,53 0,02 1L by 2L -1,56 1,05 -1,48 0,28 1L by 3L 1,40 1,05 1,33 0,31 2L by 3L 2,25 1,05 2,14 0,17
* Significant for a 90% confidence level.
Figure 2: Pareto chart of effects for MAG formation.
Table 6: Effects estimates on DAG (%).
Effect Pure t(2) p Factor Error Mean/Interc. 47,83* 0,39 121,31 0,00 (1)Enzyme (L) 8,11* 0,37 21,89 0,00 Enzyme (Q) -9,85* 0,41 -24,12 0,00 (2)Glycerin(L) -6,48* 0,37 -17,49 0,00 Glycerin(Q) -1,70* 0,41 -4,16 0,05 (3) Temperature (L) 26,89* 0,37 72,57 0,00 Temperature (Q) -13,00* 0,41 -31,85 0,00 1L by 2L -0,79 0,48 -1,64 0,24 1L by 3L -2,18* 0,48 -4,51 0,05 2L by 3L 6,04* 0,48 12,48 0,01
* Significant for a 90% confidence level.
-1,04139 1,332709 -1,48428 2,142337 -3,40964 -6,53052 -7,05276 7,625749 17,55219 p=,1
Standardized Effect Estimate (Absolute Value) (2)Glycerin(L) 1Lby3L 1Lby2L 2Lby3L Glycerin(Q) Temperature(Q) Enzyme(Q) (1)Enzyme(L) (3)Temperature(L)
Figure 3: Pareto chart of effects for DAG formation.
From Table 5, it can be concluded than an increase in quantity of Enzyme as well as in Temperature increase MAG formation. The Glycerin (L) variable and the interaction effects do not significantly affect MAG formation for a 90% confidence level. Table 6 shows that an increase in quantity of Enzyme (L) as well as in the Temperature (L) increase DAG formation. The same occurs with the interaction of the interaction of Glycerin and Temperature. The effect of interaction of Enzyme and Temperature produces an inverse response in DAG formation. In Table 7 is presented the analysis of variance (ANOVA) for MAG (%) and DAG (%) formation.
Table 7: Analysis of variance
Source of
Variation Sum of Squares Mean square
Degress of
freedom F-value MAG DAG MAG DAG MAG DAG MAG DAG Regression 983,12 3554,67 109,24 394,96 9 9 4,54 3,55 Residual 68,43 316,41 9,78 45,20 7 7 Lack of fit 64,04 315,47 12,81 63,09 5 5 2,37 54,77 Pure error 4,39 0,94 2,20 0,47 2 2 Total 1051,55 3871,08 16 16 Correlation coefficient 0,967 0,958 F-value = Fcalculated/Ftabulated
In the variance analysis, according to the F-test considering regression and residual values, MAG formation can be represented by a nonlinear model, but for DAG formation this isn’t true. The
-1,64293 -4,15859 -4,50515 12,48216 -17,4902 21,88608 -24,1225 -31,8477 72,56537 p=,1
Standardized Effect E stimate (Absolute Value) 1Lby2L Glycerin(Q) 1Lby3L 2Lby3L (2)Glycerin(L) (1)Enzyme(L) Enzyme(Q) Temperature(Q) (3)Temperature(L)
correlation coefficient of the equations is satisfactory. The model expressed in codified values, shown in Equation 1, was generated representing MAG formation (%). However the F-test considering lack of fit and pure error lead to useful results only for MAG formation. The F-test considering lack of fit and pure error for DAG formation presented a high value, which assures the non-validity of the model. Hence, DAG formation can’t be explained by a nonlinear model.
The MAG model is given by equation (1)
MAG=18,41+3,06*Enzyme-3,12*Enzyme2-1,51*Glycerin2 +7,04*Temperature-2,89*Temperature2 (1) 1
3.1 SURFACE METHODOLOGY RESPONSE
Figure 4 shows the surface response and the contour diagram for sunflower oil enzymatic glycerolysis to determine the most adequate operating conditions for MAG formation.
(a)
(b)
Figure 4: Response surface and contour diagram for sunflower oil glycerolysis for MAG formation expressed as a function of: (a) Glycerin and Enzyme, (b) Temperature and Enzyme.
Figure 4 revelas that MAG formation is independent from glycerin quantity since the enzyme quantity and the temperature are maintained above the central point.
20 15 10 5 0 -5 -10 20 15 10 5 0 -5 -10 -2,0 -1,5 -1,0 -0,5 0,0 0,5 1,0 1,5 2,0 Enzyme -2,0 -1,5 -1,0 -0,5 0,0 0,5 1,0 1,5 2,0 G lyce ri n
The response surface and the contour diagram for sunflower oil glycerolysis for DAG formation could not be considered because the nonlinear model cannot represent well the process for this product. Then, for optimization, in this case, it is possible to consider only Table 4 data.
4 CONCLUSION
DAG formation is maximum in trial 5 (Table 4): 3% of enzyme, temperature of 70oC and reactant ratio of 1:3 oil molar fraction: glycerin molar fraction.
The variable that produces the largest effect in sunflower oil enzymatic glycerolysis is the temperature. The enzyme quantity also affects the process.
Glycerin quantity (oil molar fraction: glycerin molar fraction) does not lead to a significant effect in the range studied at this experimental design for MAG formation. However, for DAG formation, the lesser the Glycerin quantity the better the results.
For an efficient MAG (21,36%) and DAG (51,02%) production, according to experimental design, is indispensable to use a suitable amount of Glycerin (1:3 oil molar fraction: glycerin molar fraction), temperature of 70oC and 11% of enzyme. Other operational conditions to produce MAG
(20,45%) and DAG (50,60%) with low cost are 1:5,5 oil molar fraction: glycerin molar fraction, temperature of 80,02 oC and 7% of enzyme.
ACKNOWLEDGE
The authors acknowledge the financial support from CNPQ 56127/2010-3 and 474280/2009-8.
REFERENCES
1 Kristensen, J.B., Xu, X., Mu, H., 2006. Diacylglycerol synthesis by enzymatic
glycerolysis: Screening of commercially available lipases. Journal of the Americam Oil Chemists´ Society, v. 82, n. 5, p. 329-334.
2 Katsuragi, T., Yasukawa, T., Matsuo, N., Flickinger, B., Tokimitsu, I., Matlock, M.Diacylglycerol Oil, 2 ed. EUA: AOCS Press, 2004. 272 p.
3 Schoenfelder, W. Determination of monoglycerides, diglycerides, triacylglycerols and glycerol in fats by means of gel permeation chromatography [C-VI 5b(02)]. Eur. J. Lipid Sci. Technol, n.105, p. 45-48, 2003
4 Fregolente, P. B. L.; Pinto, G. M. F.; Wolf Maciel, M. R.; Maciel Filho, R.
Monoglyceride and diglyceride production through lipase-catalyzed glycerolysis and molecular distillation. Applied Biochemistry and Biotechnoloy, v. 160, p. 1879-1887, 2010.
5 Boss, E. A., Toledo, E. C. V., Maciel Filho, R., 2004. Freeze-drying Process: real Time Model and Optimization. Chemical Engineering and Processing. v. 43, p. 1475-1485.
6 Kalil, S.J., Maugeri F. and Rodrigues M.I., 2000, Response surface analysis and simulation as a tool for bioprocess design and optimization. Process Biochemistry. v. 35, 539-550.