PET glycolysis optimization using ionic liquid [Bmin]ZnCl
3
as catalyst and kinetic evaluation
Carlos Vinícius Guimarães Silva
1*, Eloi Alves da Silva Filho
1, Fabrício Uliana
1,
Luciana Fernanda Rangel de Jesus
1, Carlos Vital Paixão de Melo
1, Rosangela Cristina Barthus
1,
José Guilherme Aquino Rodrigues
2and Gabriela Vanini
31
Laboratório de Físico-Química, Departamento de Química, Centro de Ciências Exatas,
Universidade Federal do Espírito Santo – UFES, Vitória, ES, Brasil
2
Laboratório de Eletroquímica e Eletroanalítica, Departamento de Química Inorgânica,
Centro de Tecnologia, Instituto de Química, Universidade Federal do Rio de Janeiro – UFRJ,
Rio de Janeiro, RJ, Brasil
3
Laboratório de Geoquímica Orgânica Molecular e Ambiental, Departamento de Química Inorgânica,
Centro de Tecnologia, Instituto de Química, Universidade Federal do Rio de Janeiro – UFRJ,
Rio de Janeiro, RJ, Brasil
Abstract
In the present work, the depolymerization of polyethylene terephthalate (PET) was performed by the method of glycolysis with ethylene glycol. The process was carried out using a factorial design in the Box-Behnken optimization model, using a response surface methodology (RSM) in which three factors (time, temperature and mass ratio of ethylene glycol) were studied in three levels of variation (- 1, 0, +1) with two replicates of the center point, totalizing 15 experiments for which the yield of bis (2-hydroxyethyl) terephthalate (BHET) monomers formed in the process was chosen as response. In parallel, the Arrhenius kinetic test was used to determine the apparent activation energy (Ea) for the 1-butyl-3-methylimidazole trichlorozincate ([Bmin]ZnCl3) - catalyst used in the depolymerization process. The products of glycolysis obtained were characterized by spectroscopic techniques (FTIR), (1H and 13C NMR), thermal analyses (TGA) and (DSC) and Mass Spectrometry LC-MS/MS hybrid Quadrupole-Orbitrap.
Keywords: PET, glycolysis, ionic liquids, design of experiments, activation energy energy.
1. Introduction
Poly(ethylene terephthalate) - popularly known as “polyester” in textile industry - a semicrystalline thermoplastic first developed and recognized in the England by scientists Whinfield and Dickson[1] through polycondensation reaction of terephthalic acid with ethylene glycol in 1941, has been widely used in various applications ranging from textile fibers (67%), blown injection packagings (24%), bioriented films (5%) and engineering polymers (4%). The success of this material is due to its excellent relationship between the mechanical and thermal properties and the low cost of production[2,3]. Its global consumption exceeded 54 million tons in 2010 and had an increase of about 4.5% per year between 2010 and 2015[4]. Due to this high consumption rate, recycling of this waste has become a major challenge for the conservation of resources and protection of the environment[5] since the material is responsible for 8% by weight and 12% by volume of solid waste in the world. PET recycling not only contributes as a partial solution to the problem of solid waste but also as a source of raw material for some industries, assisting the conservation of high-cost petrochemical products through the use of terephthalic resins and polyurethanes and as coatings and other applications, which are of great importance[6]. It is observed that in the
last years, the interest in PET recycling has been growing continuously because of ecological and economic concerns.
and difficult to separate from the reaction mixture, which could influence the properties of the product[10].
Baliga and Wong[11] evaluated the depolymerization reaction at 190 °C with excess ethylene glycol (EG/PET = 1:4) in the presence of various metal acetates as catalysts: zinc, lead, manganese and cobalt, as typically used in transesterification reactions. In the experiment without a catalyst, a considerable amount of PET can be observed after 8 h reaction, showing the catalyst importance in the depolymerization process. In the catalyzed experiments, the glycolyzed products consisted of a mixture of BHET and some oligomers, being analyzed by hydroxyl number[12], showing a significant increase in the initial rate of depolymerization influenced by catalysts following the order: Zn2+> Pb2+> Mn2+> Co2+.
Kao et al.[13] investigated the efficiency of Na+, Mn2+, Co2+, Cu2+, Cu2+, Cu2+ and Zn2+ acetates as PET catalysts with ethylene glycol through differential scanning calorimetry (DSC) analysis of the products resulting from a high temperature and pressure reaction for 30 min, also using hydroxyl number measurements, which verified better results also for zinc.
According to Wang et al.[14] it was possible to obtain satisfactory results with 100% PET depolymerization by glycolysis in the presence of ethylene glycol with 71.2% bis-2-hydroxyethyl terephthalate monomer (BHET) formed in 8 hour reaction time, but the volume of catalyst consumed was high (approximately 20% wt.). The group also made comparisons of average molecular weight by capillary viscosimetry measurements[15] for PET reacting at temperatures between 160 and 180 °C.
In 2011, Yue et al.[16] added to the studies the investigation of basic ionic liquids exhibiting excellent yields with a reaction time of 2 hours and 5% wt. catalysts. In 2013, members of the same group[17] studied the effect of ionic liquids combined with zinc and manganese chlorides as catalysts in the presence of Lewis and Brönsted acid sites in coordination with pyridine achieving 100% PET conversion and yields that reached 84.9% in monomer production (BHET). One of their goals was to reduce the amount of catalyst consumed, successfully reducing that value to 0.16% wt.[18]. Their new study in 2014[10] was based on novel compounds of metal-dialkylimidazole ionic liquids. The reaction activity was tested with Cu, Al, Sn, Ni, Fe, Pb, Mn and Zn ions, confirming the efficacy of 1-butyl-3-methylimidazole combined with zinc chloride ([Bmim] ZnCl3) showing 97.9% in PET conversion and 83.3% yield of BHET produced. In the same year, Al Sabagh et al.[9] compared glycolysis under the effect of ionic liquids combined with copper and zinc acetates at a relatively high concentration (50%), giving better results for copper over a 2 h period. This result was compared to a kinetic study, finding the reaction constants for various temperatures, using this argument to find the activation energy for comparison. The resulting values were 56.4 kJ/mol and 53.8 kJ/mol for copper (II) and zinc, respectively.
The aim of this work is to optimize the performance of post-consumption polyethylene terephthalate glycolysis process as a function of the reaction parameters (time, temperature and mass ratio EG: PET) and to determine the apparent activation energy of catalyst trichlorozincate 1-butyl-3-methylimidazole ([Bmim] ZnCl3).
2. Materials and Methods
2.1 Materials
1-Butyl-3-methylimidazole chloride 98.0% HPLC (Sigma-Aldrich); zinc anhydrous chloride P.A. ACS (Dynamika); dichloromethane 99.9% HPLC (Merck); ethylene glycol P.A. ACS (Neon).
2.2 Catalyst synthesis
For the synthesis of 1-butyl-3-methylimidazole trichlorozincate ([Bmin]ZnCl3) a mixture of equimolar amounts of 1-butyl-3-methylimidazole chloride [(Bmin]Cl) (Sigma-Aldrich HPLC 98.0%), and zinc chloride (Dynamika P.A. ACS) was prepared under constant stirring for 24 h in excess dichloromethane (Merck HPLC 99.9%). Then the mixture was subjected to filtration and vacuum distillation of the liquid phase, according to the procedure described elsewhere[18].
2.3 Experimental procedure of PET glycolysis
The 15 factorial experiments were carried out for the following variables: time, temperature and the solvent mass ratio (EG:PET), in random order for fixed amounts of approximately 5 g PET with 5% wt catalyst addition. For each experiment, a reflux kit with heating jacket, a 150 mL two-neck round bottom flask (Uniglass), a condenser, capillary mercury thermometer (Incoterm) and mechanical stirrer were used.
For monomers separation, the reaction mixture was rapidly filtered with a steel screen to remove residual PET (Fraction A). Approximately 40 mL of ice-cold distilled water was added to the liquid phase in a 250 mL beaker with constant stirring until the system reached room temperature (25-30°C). The mixture was vacuum filtered with an ultrafine paper filter separating the solid phase (Fraction B), containing oligomers and dimers, followed by drying in an oven at 50°C for 6 h and the liquid phase composed mainly of monomers, excess ethylene glycol and catalyst. This was crystallized in the refrigerator for 24 h and subjected to vacuum filtration with ultrafine paper filter and oven drying at 50°C (Fraction C). All fractions were weighed on an analytical balance.
The yield of monomer fraction, the main product of the reaction is defined by Equation 1[9]:
/
% BHET Yield = 1 00 % /
BHET BHET
PETi PET
W MW
x
W MW (1)
where, WBHET is the weight of the monomer obtained by
“fraction C”, WPETi the initial PET weight, MWBHET is
the molar weight for the BHET monomer in the amount of 254 g⋅mol-1, and
PET
MW is molar weight to PET in the amount of 192 g·mol-1 per repeating unit.
2.4 Experiments design
mass ratio between ethylene glycol/PET in 3 levels (1, 0, +1), allowing to verify the interaction between variables, where the number of experiments is given by Equation 2:
²
N=k + +k cp (2)
Where: “k” the number of variables and “cp” the number of experiments in the central point conditions, resulting in a total of 15 experiments in which 2 repetitions of the central point are included. The values for maximum and minimum levels were chosen with help of some other published studies since the system to be worked is already known.
In the summary, the levels of the variables are organized in Table 1.
The matrix defined by the Box-Behnken design for the realization of the sequence of experiments is given in Table 2: 2.5 Apparent activation energy
New trials were performed on the same system at reflux, with about 2g of PET, 5% wt. catalyst (100 mg) [Bmin] ZnCl3 and 20 mL ethylene glycol (about 10:1 EG:PET). The total of the 20 experiments were performed in total at varying intervals of time to temperatures of 170°C, 180°C, 190°C, and 197°C respectively. The residual PET mass was weighed to calculate the conversion rate for each reaction.
The conversion rate of PET in subproduct 3 is defined by Equation 3[18]:
% PET Conversion = i f 1 00 %
i
W W
x W
−
(3)
Where: Wi represents the initial mass of PET and Wf
represents the mass of residual PET (non-depolymerized).
2.6 Characterization
Infrared spectroscopy analysis was performed with Spectrum 400 FT-MIR / FT-NIR - Perkin Elmer, in attenuated total reflectance (ATR) mode, 16 scans, with a resolution of 4 cm-1, 1H-RMN and 13C-RMN spectroscopy were measured in a Varian 400 MHz at 9.4 T, 5 mm BroadBand1H/X/D NMR probe with chloroform-d (CDCl3) solution, chemical shifts
(δ) in ppm relation to tetramethylsilane (TMS). Mass spectra
were obtained in a Q-Extractive Plus (ThermoScientific) LC-MS/MS hybrid Quadrupole-Orbitrap. The samples were diluted in methanol 0.25 mg/mL solution (CH2OH); direct infusion in positive and negative mode using electrospray ionization source; spray voltage: -4 kV; sheath gas flow: 15; auxiliary gas flow: 0; capillary voltage: -70V; capillary temperature: 300 °C; tube lens: -120V. Thermal analyses were conducted with DSC Q200 (TA Instruments) and TG SDT Q600 (TA Instruments) controlled by software Universal V4.7; with approximately 5 mg of the sample at heating rates of 10ºC⋅min-1 with 50 mL/min N
2 flow in the temperature range of -80 a 600°C for DSC and 20 a 600°C for TGA analysis.
3. Results and Discussions
3.1 Glycolysis products
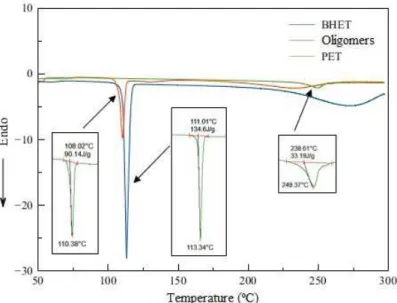
Residual PET was previously separated from the oligomer mixture (fraction B), which showed a white-green color in most experiments. Differential scanning calorimetry (DSC) comparisons of crystalline melt temperature were carried out (Figure 1), comparing samples from the initial PET fractions, and fractions of monomers (fraction C) and oligomers (fraction B). The BHET monomer fraction presented a melting temperature of 113.34°C (endothermic peak classified as crystalline melt) with a melting enthalpy of 134.6 J/g and the fraction of oligomers showed a temperature close to 110.38°C, but with a lower intensity, which justifies the presence of monomers also in fraction B, with an enthalpy value of 90.14 J/g. Fractions B and C differed adequately from the behavior of crushed PET sample which presented, according to the thermogram, the melting temperature of 249.37°C and enthalpy of 33.19 J/g.
Table 1. Variables involved and their levels.
Variables Coded levels
-1 0 1
Time (min) 60 90 120
Temperature (°C) 170 180 190
EG:PET (w/w) 2 6 10
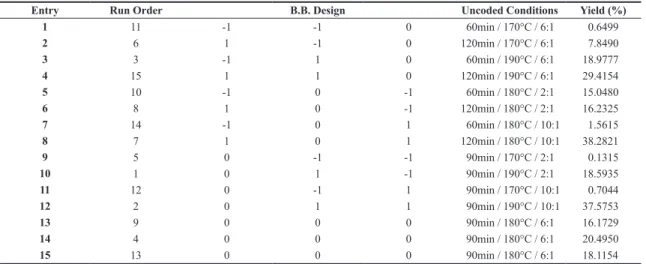
Table 2. Box-Behnken planning matrix and experimental yields (%).
Entry Run Order B.B. Design Uncoded Conditions Yield (%)
1 11 -1 -1 0 60min / 170°C / 6:1 0.6499
2 6 1 -1 0 120min / 170°C / 6:1 7.8490
3 3 -1 1 0 60min / 190°C / 6:1 18.9777
4 15 1 1 0 120min / 190°C / 6:1 29.4154
5 10 -1 0 -1 60min / 180°C / 2:1 15.0480
6 8 1 0 -1 120min / 180°C / 2:1 16.2325
7 14 -1 0 1 60min / 180°C / 10:1 1.5615
8 7 1 0 1 120min / 180°C / 10:1 38.2821
9 5 0 -1 -1 90min / 170°C / 2:1 0.1315
10 1 0 1 -1 90min / 190°C / 2:1 18.5935
11 12 0 -1 1 90min / 170°C / 10:1 0.7044
12 2 0 1 1 90min / 190°C / 10:1 37.5753
13 9 0 0 0 90min / 180°C / 6:1 16.1729
14 4 0 0 0 90min / 180°C / 6:1 20.4950
From the thermogravimetric analysis (Figure 2), the first mass loss of 26.24% was observed, starting at 203.34°C for the sample of BHET monomers (fraction C) indicating its thermal degradation and the second loss of mass of 67.01% 400.39°C referring to the decomposition of PET produced by re-polymerisation in the heating ramp. For the oligomers sample (fraction B) there was degradation with the first mass loss of 22.97% at 198.10ºC and, similarly to the fraction of monomers, it also had a second mass loss of 66.98% referring to the formation of PET at high temperatures at 406.70ºC. All the results of thermal analyzes are listed in Table 3.
Analysing of the FTIR spectrum (Figure 3) it can be seen that all components have the same bands: 2957 and 2899 cm-1 (CHsp3), 1714 cm-1 (C = O) and 1407 cm-1 (CH aromatic), which implies they all present the same functional groups and differ only by the appearance of the band near 3437 cm-1 related to the hydroxyl group, present in monomers and oligomers, observed yet stronger in monomers.
The hydrogen NMR spectrum (Figure 4) shows the presence of four aromatic protons of benzene ring at 8.12 ppm. The signals at 4.49 and 3.98 ppm are characteristic of the presence of methylene protons COO-CH2- and CH2OH respectively. A signal at 2.05 ppm points to the presence of hydroxyl protons. The Figure 4, also shows the presence of residual water signal at 1.60 ppm and the solvent CDCl3 at 7.26 ppm.
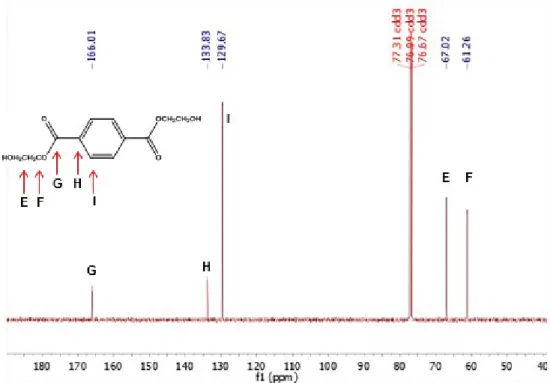
The 13C NMR signals are presented in Figure 5, where the signal is shifted related to carbonyl at 166 ppm. Aromatic carbons and methylenes are based on 133.83 and 129.67 ppm while CH2OH and -COO-CH2- are located at 67.02 and 61.26 ppm respectively. The formation of the bis-2-hydroxyethyl terephthalate monomer (BHET) is therefore confirmed by the proposed structure and their NMR spectrum show to be in agreement with the literature[21,22].
Mass spectrometry analysis with electrospray ionization (ESI-MS) in the positive mode (Figure 6) showed two peaks with high intensity confirming the presence of
bis-2-hydroxyethyl terephthalate monomer (BHET) of [M + Na]+ = 277.07 m/z for [2M + Na]+ = 531 m/z due to the formation of non covalent dimer. The peak at [M + Na]+ = 469.11 m/z at low intensity is related to the presence of glycosylated dimer, and other low intensity peaks are related to fragmentations dimer uncoordinated [2M + Na]+ at 513 and 321 m/z respectively.
Figure 1. Thermogram of DSC curves of PET and products.
Figure 2. Thermogram of TGA curves of PET and products.
Table 3. Values found by thermal analysis.
Unreached PET Fraction B Fraction C
Melt Temperature 249.37 °C 110.38 °C 113.34 °C
ΔHº Melt 33.19 J/g 90.14 J/g 134.6 J/g
Mass loss (1) 90~95% (390~400 °C) (1) 22.97% (198 °C) (1) 26.24% (204 °C) (2) 66.98% (407 °C) (2) 63.44% (400 °C)
Figure 4. 1H-NMR spectrum of BHET.
3.2 Apparent activation energy
PET depolymerization studies usually assume the process as having first-order kinetics[9,23]. The depolymerization reaction rate constant is proportional to the PET concentration (per repeating unit) and ethylene glycol (EG). So the equation can be written like this:
[
]
[ ][
]
d PET
k EG PET dt = −
(4)
As in the reaction conditions ethylene glycol (EG) is in excess, the concentration of ethylene glycol is considered constant because the solvent mass is much higher than the mass of PET. It is therefore rewritten k EG
[ ]
as k′,so:[
]
[
]
d PET
k PET dt = − ′
(5)
[
PET]
is the concentration of PET per repetition unit:[
PET] [
= 1PET]
0(
−x)
(6)(
)
'' 1 dX
k x
dt = − (7)
Where x is the conversion of PET. In this way, k PET'
[
]
can be written as k'', which will be the pseudo 1st order rate constant. Integrating Equation 7, we have:1 '' 1
ln k t
x
=
−
(8)
Applying Equation 8 as a function of glycolysis time, it is possible to find the rate constant k ‘in a graph ln (1/(1-x)) versus time, using the line slope. The coefficients of linear
correlation (R2) were greater than 0.99 in the experiments for each studied temperature (Figure 7), the values for the constants k’ were 0.0909; 0.0775; 0.0139; 0.0024 and 0.0008 min-1 for the temperatures of 197, 190, 180, 170, and 160°C respectively.
Using the rate constants values it was possible to obtain the activation energy (Ea) from the ratio obtained from Equation 9:
lnk lnA Ea RT
= − (9)
Where: “A” is a pre-exponential factor, “R” is the gas constant
(8.314462 J∙K-1∙mol-1), and “T” is the temperature in Kelvin. The apparent activation energy for the process of glycolysis with the catalyst [Bmin]ZnCl3, calculated on the straight line slope in Arrhenius plot (Figure 8) was 36.49 kJ/mol.
The calculated result of the apparent activation energy is well lower compared to the data reported in the literature (Table 4), the energy values 53.8 kJ/mol and 56.4 kJ/mol for 1-butyl-3- methylimidazole acetate combined with zinc and copper acetates respectively[9], 58.53 kJ/mol with 1-butyl-3-methylimidazole acetate[23], 79.3 kJ/mol with zinc and aluminum oxides mixture[24], 85 kJ/mol with zinc acetate[25], 92 kJ/mol with zinc (acetate and stereate) salts[26] and 108 kJ/mol without catalyst[25].
3.3 Design of experiments
The Table 2, presents the trends in yield behavior for the formation of bis (2-hydroxyethyl) terephthalate (BHET) monomers as a function of simultaneous changes in variables and levels. The combination of the 15 experiments results in the optimization of the “% yield” response with statistical
tests and in a surface chart known as Surface Response Methodology (MSR).
The regression model applied in optimization schedules with central points is usually a quadratic polynomial equation used to predict response as a function of independent variables. The equation can be expressed as:
2
0 i i ii i ij i j
i i i j j
Y x x x x
<
= β + β + β∑ ∑ +∑ ∑β + ε (10)
Where: Y is the expected response, β0 is a constant, βi, βii and βij are linear, quadratic and interactive coefficients respectively and ε is the model waste. The independent variables (xi) chosen in this case are time (x1 ), temperature (x2 ) and mass ratio EG: PET (x3 ). The polynomial coefficients were estimated by the method of least squares regression[27] and the validation of the model made by analysis of variance (ANOVA). When applying the experimental data in Equation 10,
a mathematical relationship between “predicted yield” and independent variables (Equation 11) is found
(
)
5.3778 3.2932 12
3.2932 2 3.2932 3 4.8475 1
2 2
4.8475 2 4.8475 3 4.6573 1 2
4.6573 1 3 4.6573 2 3
1
8.2617 6.9427 11.9034 3.5147 0.2544
3.7843 0.2262 0.8096
8.8840 4.6023
Yield BHET x
x x x
x x x x
x x x x
± ±
± ± ±
± ± ±
± ±
= + +
+ − −
− + +
+
(11)
For Equation 11 confidence intervals were assigned for each coefficient (β β β …β0, 1, 2 9), demonstrating interactions which are indeed significant in the reaction process by the t-test[28]. This observation is demonstrated in the graph (Figure 9) through tie-line indicating the coefficients statistical significance, where significant amounts deviate from the value 0. In significance order we have the coefficients corresponding to the effects of variables: temperature (b2), time (b1), EG dosage vs. time interaction: PET (b13) and finally the dosage EG: PET (b3).
The Figure 10a shows the experimental values based on the responses predicted by the model. It can be seen that there is a good agreement between experimental data and those responses predicted by the model of Equation 11. This observation confirms the good model fit described in Table 5. The Figure 10b shows the behavior of the waste,
i.e., the difference between experimental and predicted values. It is noted in this comparison between the expected response and the waste that they behave randomly with no default, showing good homoscedasticity (error variance is constant) and the relationship between variables is predominantly linear.
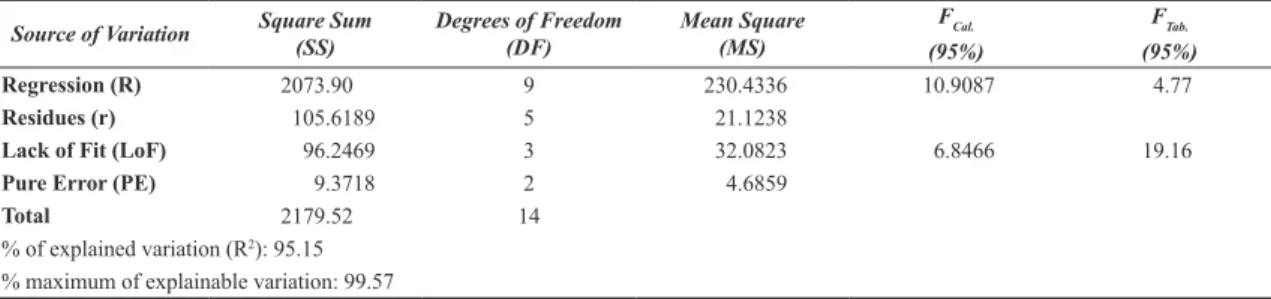
The F-test can be used to verify the regression significance. If the calculated F is larger than the tabulated one, it indicates good regression and, consequently, the mathematical model satisfactorily represents the experiment[29]. Thus the obtained
Figure 7. Line equations obtained for the argument ln (1/(1-x))
vs Time.
Figure 8. The Arrhenius plot for the catalyst [Bmin]ZnCl3.
Table 4. apparent activation energies for PET glycolysis studies.
Calculated (kJ/mol) Ref.[9] Ref.[9] Ref.[23] Ref.[24] Ref.[25] Ref.[26] Ref.[25]
36.49 53.8 56.4 58.53 79.3 85 92 108
values were FCal.= 10.9087 > F9.5 = 4.77, concluding that the model is significantly correct. The residue distribution was carried out to prove the model’s statistical significance, verifying the lack of fit and the pure error. In this case, a calculated F smaller than the tabulated F indicates the absence of mismatch of the developed mathematical model[29]. Thus it was obtained an FCal. = 6.8466 <F 3.2 = 19.16 concluding that the model does not have lack of fit. Therefore, the developed model is well-adjusted to a 95% confidence level.
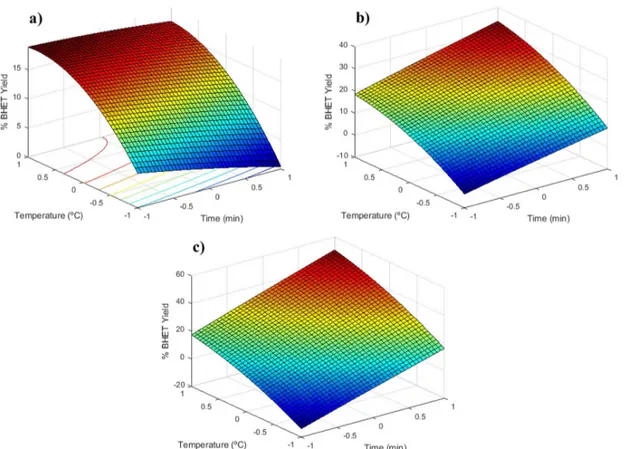
After ensuring the model suitability, the surface (3D) and contour (2D) graphs were plotted, referring to the following
parameters combinations: time vs temperature in 3 levels (-1, 0, 1) of ethylene glycol dosage in relation to PET (EG: PET), demonstrating the behavior of the two factors variation with a fixed (constant) variable for the income response, aiming to contribute to the illustration of the best experimental conditions for a high yield. The largest response is determined to find the maximum point within the area delimited by the levels of each factor. Figure 11 evaluates that the increase in yield is favored by increasing the three variable set to the maximum level, however Figure 11a shows a different trend, which demonstrates that the good
Figure 10. (a) Experimental yield vs predicted yield; (b) residues vs predicted yield.
response (approximately 20%) in amounts of ethylene glycol -1 (2:1) is achieved with time by -1 (60 min), at maximum temperature (190°C).
From Figures 11b and 11c, it is seen that the behavior changes when, if there is an increase in asolvent, better yields are obtained by increasing the time from 0 (90 min) to +1 (120 min), at maximum temperature (190°C). Another point to be highlighted is that excess solvent favors obtaining the liquid phase (phase C) by filtration, reducing yield losses. Under the best conditions shown in Figure 11c, in a proportion of +1 ethylene glycol (10:1), the critical yield (peak point under these conditions) of approximately 50% is reached.
4. Conclusions
The synthesis of the bis-(2-hydroxyethyl) terephthalate (BHET) monomers was performed satisfactorily and the possible difficulties in the fractions separation step were minimized by improving the formed crystals purity. The choice of factors and reactional levels applied in Box-Behnken design was aided by articles in the field of experiments optimization, even though most of them dealing with univariate and poorly applied methods but that played an important role in this stage, which can be proved by the graph of the coefficients (Figure 9), showing considerable relevance to the effects on yield as a response.
The reaction process with [Bmin]ZnCl3 presented apparent activation energy of 36.49 kJ/mol lower than those already reported in the literature.
The ANOVA table showed significant values of R2 (95.15%), F test for regression (10.91) greater than the tabulated and a residue (6.85) smaller than the tabulated having good adequacy to quadratic model. The effects in order of statistical significance were the following variables: temperature, time, interaction time vs EG dosage:PET and dosage w/w of EG:PET.
The generated graphs of response surface show a good region where yields greater than 50% yield are achieved in the conditions established with the increase of three variables together, which can be applied for further reactions depolymerization, since the monomer is not the only interest in the process, but the degradation of the starting material generating new chemical compounds represent a wide range of applications in the production of resin and derivatives.
Table 5. Analysis of Variance (ANOVA) from Box-Behnken model.
Source of Variation Square Sum (SS)
Degrees of Freedom (DF) Mean Square (MS) FCal. (95%) FTab. (95%)
Regression (R) 2073.90 9 230.4336 10.9087 4.77
Residues (r) 105.6189 5 21.1238
Lack of Fit (LoF) 96.2469 3 32.0823 6.8466 19.16
Pure Error (PE) 9.3718 2 4.6859
Total 2179.52 14
% of explained variation (R2): 95.15
% maximum of explainable variation: 99.57
5. Acknowledgements
The authors gratefully thank CAPES for MS scholarship, laboratory (LAGOA/LADETEC–UFRJ) for LC-MS analysis and (NCQP-UFES) for FTIR, TGA/DSC, and NMR analyses.
6. References
1. Whinfield, J. R., & Dickson, J. T. (1946). UKPatent No. 578079. London: British Patent to ICI Ltd.
2. Macdonald, W. A. (2002). New advances in poly (ethylene terephthalate) polymerization and degradation. Polymer International, 51(10), 923-930. http://dx.doi.org/10.1002/ pi.917.
3. Romão, W., Spinacé, M. A. S., & De Paoli, M.-A. (2009). Poli(tereftalato de etileno), PET: uma revisão sobre os processos de síntese, mecanismos de degradação e sua reciclagem.
Polímeros: Ciência e Tecnologia, 19(2), 121-132. http://dx.doi. org/10.1590/S0104-14282009000200009.
4. Bartolome, L., Imran, M., Cho, B. G., Al-Masry, W. A., & Kim, D. H. (2012). Recent development in the chemical recycling of PET. In D. S. Achilias. Material recycling - trends and perspectives (pp. 65-84). London: Headquarters. http://dx.doi. org/10.5772/33800.
5. Wang, Q., Yao, X., Tang, S., Lu, X., Zhang, X., & Zhang, S. (2012). Urea as an efficient and reusable catalyst for the glycolysis of poly(ethylene terephthalate) wastes and the role of hydrogen bond in this process. Green Chemistry, 14(9), 2559-2566. http://dx.doi.org/10.1039/c2gc35696a. 6. Kathalewar, M., Dhopatkar, N., Pacharane, B., Sabnis, A.,
Raut, P., & Bhave, V. (2013). Chemical recycling of PET using neopentyl glycol: Reaction kinetics and preparation of polyurethane coatings. Progress in Organic Coatings, 76(1), 147-156. http://dx.doi.org/10.1016/j.porgcoat.2012.08.023. 7. Mancini, S. D., & Zanin, M. (2015). Resíduos plásticos e
reciclagem: aspectos gerais e tecnologia. 2ª ed. São Carlos: EdUFSCar. http://dx.doi.org/10.7476/9788576003601. 8. Troev, K., Grancharov, G., Tsevi, R., & Gitsov, I. (2003). A
novel catalyst for the glycolysis of poly(ethylene terephthalate).
Journal of Applied Polymer Science, 90(8), 1148-1152. http:// dx.doi.org/10.1002/app.12711.
9. Al-Sabagh, A. M., Yehia, F. Z., Eissa, A. M. F., Moustafa, M. E., Eshaq, G., Rabie, A. M., & ElMetwally, A. E. (2014). Cu and Zn acetate containing ionic liquids as catalysts for the glycolysis of poly(ethylene terephthalate). Polymer Degradation & Stability, 110, 364-337. http://dx.doi.org/10.1016/j. polymdegradstab.2014.10.005.
in Materials Science and Engineering, 2014(1), 1-6. http:// dx.doi.org/10.1155/2014/454756.
11. Baliga, S., & Wong, W. T. (1989). Depolymerization of poly(ethylene terephthalate) recycled from post-consumer soft-drink bottles. Journal of Polymer Science. Part A, Polymer Chemistry, 27(6), 2071-2082. http://dx.doi.org/10.1002/ pola.1989.080270625.
12. American Society for Testing and Materials – ASTM. (2016).
ASTM D4274-16: standard test methods for testing polyurethane raw materials: determination of hydroxyl numbers of polyols. West Conshohocken: ASTM. http://dx.doi.org/10.1520/ D4274-16.
13. Kao, C. Y., Cheng, W. H., & Wan, B. Z. (1997). Investigation of catalytic glycolysis of polyethylene terephthalate by differential scanning calorimetry. Thermochimica Acta, 292(1-2), 95-104. http://dx.doi.org/10.1016/S0040-6031(97)00060-9. 14. Wang, H., Liu, Y., Li, Z., Zhang, X., Zhang, S., & Zhang, Y.
(2009). Glycolysis of poly(ethylene terephthalate) catalyzed by ionic liquids. European Polymer Journal, 45(5), 1535-1544. http://dx.doi.org/10.1016/j.eurpolymj.2009.01.025. 15. American Society for Testing and Materials – ASTM. (2011).
ASTM D4603-03: standard test method for determining inherent viscosity of poly(Ethylene Terephthalate) (PET) by glass capillary viscometer. West Conshohocken: ASTM. https:// doi.org/10.1520/D4603-03R11E01.
16. Yue, Q. F., Wang, C. X., Zhang, L. N., Ni, Y., & Jin, Y. X. (2011). Glycolysis of poly(ethylene terephthalate) (PET) using basic ionic liquids as catalysts. Polymer Degradation & Stability, 96(4), 399-403. http://dx.doi.org/10.1016/j. polymdegradstab.2010.12.020.
17. Yang, Y.-L., & Kou, Y. (2004). Determination of the Lewis acidity of ionic liquids by means of an IR spectroscopic probe.
Chemical Communications, 2004(2), 226-227. http://dx.doi. org/10.1039/b311615h. PMid:14737561.
18. Yue, Q. F., Xiao, L. F., Zhang, M. L., & Bai, X. F. (2013). The glycolysis of poly(ethylene terephthalate) waste: lewis acidic ionic liquids as high efficient catalysts. Polymers, 5(4), 1258-1271. http://dx.doi.org/10.3390/polym5041258. 19. Montgomery, D. C. (2013). Design and analysis of experiments.
8a ed. New York: John Wiley & Sons.
20. Novaes, C. G., Yamaki, R. T., Paula, V. F., Nascimento, B. B., Jr., Barreto, J. A., Valasques, G. S., & Bezerra, M. A.
(2017). Otimização de métodos analíticos usando metodologia de superfícies de resposta - Parte I: variáveis de processo.
Revista Virtual Quimica, 9(3), 1284-1215. http://dx.doi. org/10.21577/1984-6835.20170070.
21. Ernö, P., Bühlmann, P., Badertscher, M. (2009). Structure determination of organic compounds - tables of spectral data. Basel: Springer Nature Switzerland AG. http://dx.doi. org/10.1007/978-3-540-93810-1.
22. Breitmaier, E., & Voelter, W. (1990). Carbon 13 NMR spectroscopy: high-resolution methods and applications in organic chemistry and biochemistry. 3rd ed. New York: VCH. 23. Al-Sabagh, A. M., Yehia, F. Z., Eissa, A.-M. M. F., Moustafa,
M. E., Eshaq, G., Rabie, A.-R. M., & ElMetwally, A. E. (2014). Glycolysis of poly(ethylene terephthalate) catalyzed by the lewis base ionic liquid. Industrial & Engineering Chemistry Research, 53(48), 18443-18451. http://dx.doi.org/10.1021/ ie503677w.
24. Chen, F., Zhou, Q., Bu, R., Yang, F., & Li, W. (2015). Kinetics of poly(ethylene terephthalate) fiber glycolysis in ethylene glycol. Fibers and Polymers, 16(6), 1213-1219. http://dx.doi. org/10.1007/s12221-015-1213-4.
25. Chen, J.-W., Chen, L.-W., & Cheng, W.-H. (1999). Kinetics of glycolysis of polyethylene terephthalate with zinc catalyst.
Polymer International, 48(9), 885-888. http://dx.doi.org/10.1002/ (SICI)1097-0126(199909)48:9<885::AID-PI216>3.0.CO;2-T. 26. Campanelli, J. R., Kamal, M. R., & Cooper, D. G. (1994).
Kinetics of glycolysis of poly(ethylene terephthalate) melts.
Journal of Applied Polymer Science, 54(11), 1731-1740. http:// dx.doi.org/10.1002/app.1994.070541115.
27. Liu, Q., Li, R., & Fang, T. (2015). Investigating and modeling PET methanolysis under supercritical conditions by response surface methodology approach. Chemical Engineering Journal,
270, 535-541. http://dx.doi.org/10.1016/j.cej.2015.02.039. 28. Pereira, E. R., Fo. (2015). Planejamento fatorial em química:
maximizando a obtenção de resultados. São Carlos: EdUFSCar. 29. Barros, B., No., Scarminio, I. E., & Bruns, R. E. (2010). Como
fazer experimentos: aplicações na ciência e na indústria, 4th ed. Porto Alegre: Bookman.
![Figure 8. The Arrhenius plot for the catalyst [Bmin]ZnCl 3 .](https://thumb-eu.123doks.com/thumbv2/123dok_br/16487407.732886/7.765.73.381.408.646/figure-arrhenius-plot-catalyst-bmin-zncl.webp)