Scientific/Technical Article
http://dx.doi.org/10.1590/2318-0331.231820170081
Precipitation anomalies in the Brazilian southern coast related to the
SAM and ENSO climate variability modes
Anomalias de precipitação na costa sul brasileira associadas aos modos de variabilidade climática SAM e ENOS
Venisse Schossler1, Jefferson Cardia Simões1, Francisco Eliseu Aquino1 and Denilson Ribeiro Viana1
1Centro Polar e Climático, Universidade Federal do Rio Grande do Sul, Porto Alegre, RS, Brasil
E-mails: [email protected] (VS), [email protected] (JCS), [email protected] (FEA), [email protected] (DRV)
Received: June 14, 2017 - Revised: December 15, 2017 - Accepted: February 25, 2018
ABSTRACT
The precipitation pattern of the State of Rio Grande do Sul (RS) is changing, indicating an increase, although there are long periods of drought. Several studies indicate the influence of climate variability modes on RS precipitation. This work analyzes the influence of the Southern Annular Mode (SAM) and the El Niño - Southern Oscillation (ENSO) on precipitation anomalies (PP) of the Rio Grande do Sul Coastal Plain (RGSCP), dividing it into three regions: south, central and north. Contingency tables were used to correlate the indices, classifying them as neutral, below ou above the mean. To statistical significance we used percentage correctly classified with which the Student’s t was aplied for each region. The PP of the RGSCP and the south coast have correlation with the ENSO and SAM; the central only with SAM. The PP of the north is not correlated to either index. Periods with more than 5 months of PP, SAM and ENSO anomalies were identified. Below average events were majority. The results indicate greater influence of SAM + and La Niña. The trend towards SAM+ and intensification of ENSO, could increase the frequency of droughts in RGSCP. In addition, it was possible to interpret that the geographical differences of the RGSCP can influence the results of precipitation totals. This work contributes to the understanding of the effects of the new trends of climatic variability under regional and geographical aspects.
Keywords: Coastal environment; Teleconnection patterns; Regional climate.
RESUMO
O padrão de precipitação do estado do Rio Grande do Sul (RS) esta mudando, indicando aumento, ainda que se observe longos períodos de seca. Diversos estudos apontam influencia de modos de variabilidade climática na precipitação do RS. Este trabalho analisa a influência do Modo Anular do Hemisfério Sul (SAM) e do El Niño – Oscilação Sul (ENOS), nas anomalias de precipitação (PP) da Planície Costeira do Rio Grande do Sul (PCRGS), a dividindo em três regiões: sul, central e norte. Tabelas de contingência foram utilizadas para correlacionar os índices, os classificando como neutros, abaixo ou acima da média. Para significância estatística utilizamos o percentual corretamente classificado, com o qual se aplicou o teste t de Student para cada região. As PP da PCRGS e da costa sul possuem correlação com o ENOS e SAM; a central apenas com o SAM. As PP do norte não são correlacionadas há nenhum dos dois indices. Períodos com mais de 5 meses de PP, SAM e ENOS anômalos foram identificados. Eventos abaixo da média foram maioria. Os resultados indicam maior influência SAM+ e La Niña. A tendência ao SAM+ e intensificação do ENOS, poderá aumentar a frequência de secas na PCRGS. Além disso, foi possível interpretar que as diferenças geográficas da PCRGS podem influenciar nos resultados dos totais de precipitação. Este trabalho contribui para a compreensão dos efeitos das novas tendências da variabilidade climática sob aspecto regional e geográfico.
INTRODUCTION
The climate variability modes, such as El Niño Southern Oscillation (ENSO) and Southern Annular Mode (SAM), were related to changes in the Southern Hemisphere (SH) precipitation in several studies (e.g. GILLETT; KELL; JONES, 2006, GRIMM; TEDESCHI, 2009; REBOITA; AMBRIZZI; ROCHA 2009, LIM et al., 2016, PENALBA; RIVERA, 2016, FERNANDES; RODRIGUES, 2018, VERA et al., 2017). For example, the south of Brazil shows an increased rainfall in El Niño (EN) years and reduction in La Niña (LN) years, according to Grimm and Tedeschi (2009). Gillett, Kell and Jones (2006) presented evidences that the SAM, in its positive phase, is associated with exceptional droughts in southern South America (SA). Further, Silvestri and Vera (2003) and Gupta and England (2006) declare that in southeast of SA has scarce rainfall in summer and increase in winter, associated to the SAM positive phase. Lim et al. (2016) affirm that SAM positive decrease the precipitation in summer subtropics, however increase in summer. Grimm, Ferraz and Gomes (1998) suggested that southern Brazil is a region where the ENSO signal is indeed intense.
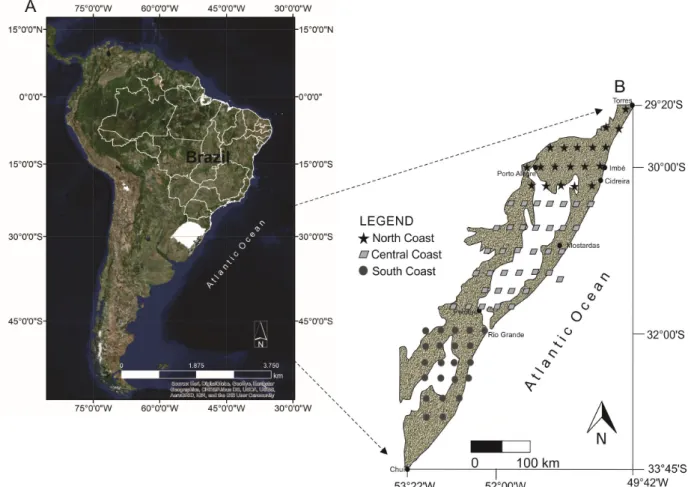
The study area of this paper, Rio Grande do Sul Coastal Plain (RGSCP) was described by Nimmer (1977) as a wet and mesothermic bland climatic region with no dry season, having mean temperatures between 22 and 26°C in summer and 10° and
15°C in winter, annual rainfall varies from 1000 mm to 1500 mm. Concerning geomorphology, Carraro et al. (1974), divided the RS state in four provinces: the Plateau, the Peripheral Depression, the Southern Rio Grande Shield and RGSCP (Figure 1). The latter is 630 km long and covers 33 000 km2, having beaches with microtides (0.5 m), waves (1.5 m on average) dominated and longitudinal currents. Prevailing winds come from the northeast; but intense southwesterly winds cause main changes in beach profiles in winters (CALLIARI; KLEIN, 1993).
Although RGSCP appears to have homogeneous precipitation patterns throughout its area, it is important to note that across four degrees of latitude it has quite different geographic features. In its northern region (between Torres and Cidreira), the RGSCP is bounded by the plateau, which regularly causes orographic rains (THOFEHRN; ROCHA, 1979). The central region (from Cidreira to Rio Grande) is occupied along its entire length by an large water body, Patos Lagoon (10 144 km2), which can generate convective rains more frequently. The southern RGSCP (from Rio Grande to Chui) has some smaller water bodies. Thus, it is not possible to ignore that there may be differences in the volumes of precipitation in this extensive area (THOFEHRN; ROCHA, 1979; ROE, 2005).
In the study area, beach system also changes by the precipitation variability (SILVA; CALLIARI; TOZZI, 2003). The drought in coastal areas increase susceptibility to erosion, because the reduction of vegetation, dry sand and loose in dune
fields and shorelines changes the beach morphodynamics. Increased precipitation volumes and storms intensify the flow of rivers and swash of the beaches, enhancing the volume of sediments in the bed return, rip and longshore currents.
This study examines the relationship between precipitation anomalies (PP) in the RGSCP, SAM and ENSO by multivariate ENSO index (MEI). There are several ENSO indexes, but the MEI is recommended because it is composed of six variables that are part of the ocean-atmosphere coupled process in the Tropical Pacific, unlike the other indexes (WOLTER; TIMLIN, 2011, POMPA-GARCÍA; NÉMIGA, 2015). In addition, the anual, seasonal and monthly variability of precipitation in the study area is described, relating it to the EN and LN events and the variation of the SAM between 1998-2013. In this description we could also identify anomalous precipitation events (longer than 5 months) associated with variability modes. In order to highlight regional differences in rainfall patterns, anomalies were analyzed from all RGSCP and its three different geographical regions (south, central and north).
DATA AND METHODS
Rainfall data in Brazil are sparse due to poor distribution of pluviometers. The Tropical Rainfall Measuring Mission (TRMM), which orbitally monitors the precipitation of the tropics and subtropics in a regular data grid, is a reliable alternative to our study área. Although the TRMM series is smaller than that of weather stations, it offers the possibility of generating robust estimates of monthly results and better spatialization, which favors regional studies (FRANCHITO et al., 2009, SOARES; PAZ; PICCILLI, 2016). The TRMM, launched in December 1997, is National Aeronautics and Space Administration (NASA) and the Japan Aerospace Exploration Agency (JAXA) joint mission. The present study focus on the 1998-2013 precipitation data provided by the TRMM, in a grid of 77 points on the RGSCP (Figure 1).
Were calculated the monthly PP for all the RGSCP and also for the three geographical regions. The PP were compared with the MEI and SAM indices for the same period (seasonally, monthly and yearly). The SAM is defined as the difference of the monthly normalized Sea Level Pressure (SLP) between 40ºS and 70ºS (GONG; WANG, 1999). The applied index is the one by Nan and Li (2003), obtained from the National Key Laboratory of Numerical Modeling for Atmospheric Sciences and Geophysical Fluid Dynamics LASG, Institute of Atmospheric Physics, Beijing, China (LASG, 2018). The ENSO index used was the MEI, which is formed from six variables on the Tropical Pacific: SLP, southern and zonal wind components, Sea Surface Temperature (SST), surface air temperature and cloud cover percentage, available at the NOAA (National Oceanic and Atmospheric Administration, United States, Commerce Department, USA (NOAA, 2014) site.
Precipitation events were identified visually and qualitatively. The annual, seasonal and monthly analysis was performed by the descriptive statistics of the series 1998-2013. Negative correlations were tested between PP and the SAM index and positive correlations with MEI. Thus, to evaluate the relationship between these three indices, contingency tables were generated in the discriminant function (3x3), calculating the percentage correctly classified
(PCC) by the discriminant function (Equation 1) and the Student t test (Equation 2) for the precision of the discriminant analysis classification in each array. Paz and Collischonn (2011) affirm that the contingency tables and the PCC index is extensively used, allows to evaluate or validate the relationship between two, or more, categorical variables. For Mason and Goddard (2001), a simple way to determine if certain events are more or less probable is to use contingency tables, because they provide a parameter that identifies the influence of an independent variable on the probability of occurrence of a certain climatic event. However, Paz and Collischonn (2011) and Aghakouchak and Mehran (2013), explain that, although contingency tables provide important information, they will not identify errors or other biases, suggesting the use of additional metrics, like a statistical significance test. In this case we use the Student t.
In the contingency tables, the values of the main diagonals (left to right, positive correlation; right to left, negative correlation) provide the events that have been correctly classified, leaving out the individuals wrongly classified. With the result of the correctly classified individuals, it is possible to calculate the PCC and apply the Student t test.
The arrays in the contingency tables were organized into three classes (-1, 0, 1), classifying each tertile as PP below average (-1), neutral (0) and above the average (1). When t is higher than 1.96, there is a correlation between two indices, as its significance is smaller than 0.05. The value of 0.33 is used for three variables, if they were two would be 0.5 (HAIR et al, 2009).
100
=n
p x
N (1)
( )
0.33 0.33 1 0.33
− = − p t N (2) Where:
p = correctly classified percentage
n = correctly classified number (sum of the main diagonal values) N = sample size
t = student test
RESULTS
Monthly, seasonal, and annual precipitation characteristics of RGSCP
Seasonally, no correlation was found. However, observing the annual precipitation graphics for each of the studied regions (Figure 2A, 2B, 2C and 2D) is possible to identify some patterns. In the summer (Figure 2A), the central coast precipitation is slight above the regional mean along all the time series, excepting in 1999 and 2000. However, the precipitation of the south coast is below average during the same period, except in 2002, when it registered the highest precipitation of the three regions. The lowest average was recorded in 2005 on the south coast, while the highest precipitation occurred in 2003 in the north coast. The highest total summer precipitation occurred in 1998 in the central coast, and the lowest one in 2005 in the south coast.
Of the 16 autumns (Figure 2B), 10 had the highest precipitation in the south coast and 12 had their lowest in the north coast. The highest regional precipitation occurred in 2002, when the south coast had the highest precipitation for the entire time series. The lowest precipitation was in 2012 in the north coast.
The south coast had the lowest precipitation in 14 winters (Figure 2C). The overall highest winter mean precipitation occurred in 1998 and the smallest on in 2004. The highest regional winter precipitation occurred in the north coast in 2002 and the smallest in the 2004 the south coast.
In the spring, the north coast had 12 of highest precipitation (Figure 2D), while the lowest precipitation occurred in the south coast in 11 years. The wettest spring in the RGSCP was in 2009 (the north coast was the wettest section in that year). The driest years in the region were in 2010 and 2011 (the lowest precipitation in any section occurred in the south coast in 1999).
Figure 3 shows the total annual time series of precipitation for the entire RGSCP and for each of the three geographic regions. Annual regional precipitation mean follows general behavior until 2005. From that year onwards, the north and south coasts
precipitation volumes come apart, where the former was continuously higher than the RGSCP mean, and latter smaller. It is noticeable a great peak-trough amplitude in the 1998-2005 period, after 2005 not only there are a lower amplitude but also an increase in the variability. It is also possible to identify the relationship between the precipitation highs and lows with EN and LN events (Table 1) and SAM phases (Figure 3, left legend). The 1998 peak coincides with the strongest EN event for the entire period (1998-2015), and it was concomitant to a SAM+ (average index 0.8), this was followed by a LN of moderate intensity (low 2: 1999 to 2000) associated with a SAM+, weakening a year later (2000-2001) and with a negative SAM phase. Precipitation peak 3 (2002-2003) is associated to EN of moderate intensity and accompanied by persistent SAM- (with a strong average index, -0.9). The EN remains from 2004 to 2006, though greatly weakened, and the SAM went to his neutral phase (lows 4 and 5).
Peak 6 (2006-2007) coincides with a weak EN and a negative SAM (-0.4). By the end of 2007, a moderate intensity LN, associated with SAM+, coincide with a new low (7), developing in 2009 as new peak (8) concomitant to an EN (moderate) and a neutral SAM phase. At the end of the RGSCP precipitation series there were two LN events (peak 9 and low 10, 2011 and 2012, respectively), accompanied by neutral SAM phase. So, from the above observations it can be said that there is an association between the precipitation and ENOS events in the 1998-2013.
Anomalous precipitation events in the RGSCP
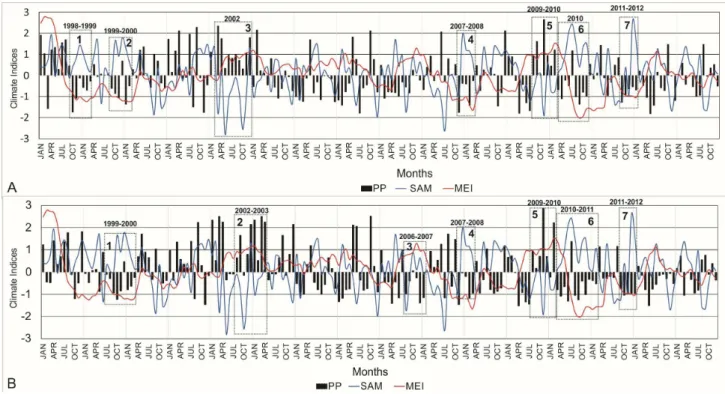
The RGSCP monthly precipitation mean reveals anomalous PP events, mainly associated to SAM+ and MEI- (Figure 4A). There are seven anomalous PP events during consecutive
months (from 5 to 12 months), five droughts and two events of precipitation above the 16 years average. Of the five droughts events (Figures 4A, 1, 2, 4, 6 and 7 events), were associated to positive SAM index and negative MEI, while the precipitation
remained below RGSCP mean (126 mm) for five or six consecutive months. The 4 event have the highest negative anomaly (-0.83) and (2007-2008) was at a time of a moderate LN (Table 1). It is possible to observe that the SAM values are less homogeneous
Figure 3. Total annual precipitation (TAP) time series (1998-2013) for the entire Rio Grande do Sul Coastal Plain (RGSCP) and
for each of its three regions. The precipitation peaks and lows marked in in the graph are associated to ENSO (El Niño-Southern Oscillation) events intensities and SAM (Southern Annular Mode) phases listed to right.
Table 1. Intensity of El Niño and La Niña events during the 1998-2013 period.
El Niño La Niña
Weak Moderate Strong Very strong Weak Moderate Strong
2004-2005
2006-2007 2002-20032009-2010 - 1997-1998 2000-20012011-2012
1998-1999 1999-2000
2007-2008 2010-2011
-Source: NOAA (2014).
Figure 4. Monthly PP (anomalies precipitation) and SAM (Sothern Annular Mode) and MEI (Multivariate ENSO Index) indices
than the MEI ones. The 1 and 2 occurred from July 1998 to March 2000, associated to one of the longest LN ever recorded, with high SAM+ too (+0.8). The 1, 2, 4 and 7 occurred in the spring–summer period.
In the 7, the last negative precipitation anomalies (PP-) event recorded in the RGSCP time series, it is possible observe five months below the average event in the spring and summer (2011-2012). The SAM index fluctuated between positive and negative values (+0.5 on average), but the MEI remained negative throughout the five months and was simultaneously with a weak LN (-1.0 on average). The 3 and 5 events shows long positive precipitation anomalies (PP+): almost one year in the 3 (2002) and seven months in the 5 (2009-2010). In 2002, most months had SAM- (8 months) and MEI+ (9 months). In the 5, all 7 months had MEI+ and 5 had also SAM-, from spring to summer. The year 2002 and the 2009-2010 biennium were times of moderate EN, but the latter period showed a moderate LN, from July 2010 to April 2011. During this period, the RGSCP was for nearly 10 months under drought conditions, and the MEI changed from positive to negative by the middle of 2010 (the 6 event); the SAM also change to positive phase, demonstrating a clear influence of the variability modes.
The RGSCP south coast, the one with the lowest mean monthly precipitation (117 mm), had 7 anomalous events: 2 above the mean and 5 below it (Figure 4B). Of the 5 negative precipitation events (Figures 4B, 1, 3, 4, 6 and 7 events), the 1, 4, 6 and 7 developed simultaneously to SAM+ and MEI-, in the years 1999-2000, 2007-2008, 2010-2011 and 2011-2012, respectively (all LN years of moderate intensity). The 3 (2006-2007) was concomitant with a MEI+, while appear to be unrelated to
any SAM trend (-0.1 on average). On the other hand, the two PP+ events in 2002-2003 and 2009-2010 (2 and 5) occurred while a moderate EN and SAM-.
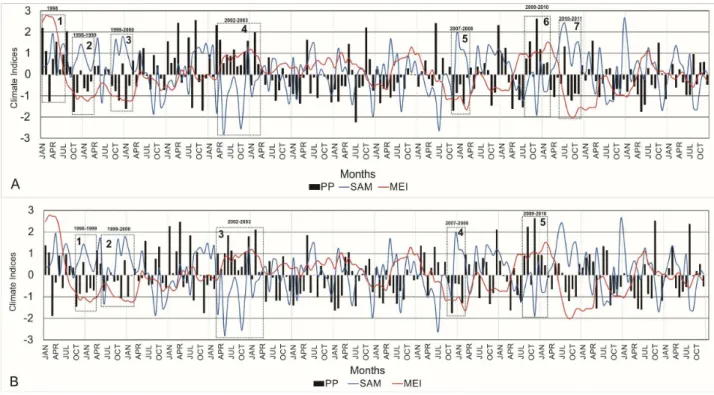
The central coast also had 7 anomalous events (Figure 5A), 4 below the mean monthly precipitation for the entire period (128 mm) and three above. When the mean precipitation was below the average, both, MEI- and the SAM+, maintained their signals almost constant (the 2, 3, 5, and 7). All events listed above occurred during LN of moderate intensity (1998-1999, 1999-2000, 2007-2008 and 2010-2011). The three PP+ events found in the central coast series, numbers 1, 4 and 6, developed with MEI+. The 1 development in 1998 during a strong EN and the 4 in 2002-2003, of moderate intensity EN associated to a SAM- (-0.7).
The north coast differs from central and south ones for several reasons. It had the highest mean precipitation (129 mm monthly) and above the RGSCP mean (126 mm). This section also had the lowest number of anomalous events (Figure 5B), three PP- and two PP+. The 1, 2, and 4 events, 1998-1999, 1999-2000, and 2007-2008 respectively, are PP-, all related to a SAM + and a MEI-. The two PP+ events, 3 and 5, in the years 2002 and 2009-2010 respectively, are simultaneous to a MEI+ and a SAM-, during a moderate EN.
After analyzing the events described above, it became necessary to validate statistically the correlations between precipitation anomalies, SAM and MEI. The results on the principal diagonal of the contingency table for all the RGSCP shows 81 correctly classified individuals, indicate a PCC of 42%. What does that mean? It means that in 81 months of the series (of 192 studied), was found negative correlation (SAM + with PP- and SAM- with PP +), as observed in previous studies. The Student’s t test was applied to the PCC result to determine if there was statistical
Figure 5. Monthly PP (anomalies precipitation) and SAM (Sothern Annular Mode) and MEI (Multivariate ENSO Index) indices
significance in this result. For RGSCP (Table 2) the result was t =2.77 (for significant correlation the t test result must be greater than 1.95). In the relationship between PP and MEI, the PCC is was smaller: 40%, with almost the same significance (t =2.11) (Table 3). In the correlation between PP of the south coast and SAM and MEI, the PCC are 41% and 40%, respectively, and also significant (t =2.41 and 2.14). In the Tables 4 and 5 its is possible to observe the values correctly classified to south coast.
The results are different for the central and north coasts. In the central coast, only was found negative correlation between PP and SAM, with PCC of 42% and t = 2.77 (Table 6). There was not relationship between the PP and the MEI (PCC = 39%; t = 1.83) (Table 7). Finally, there were no correlation between the PP and the two climate indices for the north coast (Tables 8 and 9), PCC 39% for SAM and 34% for the MEI (t = 1.86 and 0.5, respectively).
Table 2. Contingency table (3x3) between the Rio Grande do Sul Coastal Plain (RGSCP) precipitation anomalies (PP) and the Southern Annular Mode (SAM), in absolute values (192 months). The correctly classified individuals are in gray and bold, from right to left.
Index SAM
PP
PP x SAM -1 0 1 Total
-1 19 2 25 64
0 15 26 23 64
1 30 18 16 64
Total 64 64 64 192
Table 9. Contingency table (3x3) between the Rio Grande do Sul Coastal Plain (RGSCP) north coast precipitation anomalies (PP) and the Multivariate ENSO Index (MEI), in absolute values (192 months). The correctly classified individuals are in gray and bold, from left to right.
Index MEI
PP
PP x MEI -1 0 1 Total
-1 22 21 21 64
0 24 21 19 64
1 18 22 24 64
Total 64 64 64 192
Table 3. Contingency table (3x3) between the Rio Grande do Sul Coastal Plain (RGSCP) precipitation anomalies (PP) and the Multivariate ENSO Index (MEI), in absolute values (192 months). The correctly classified individuals are in gray and bold, from left to right.
Index MEI
PP
PP x MEI -1 0 1 Total
-1 26 16 22 64
0 21 26 17 64
1 17 22 25 64
Total 64 64 64 192
Table 4. Contingency table (3x3) between the Rio Grande do Sul Coastal Plain (RGSCP) south coast precipitation anomalies (PP) and Southern Annular Mode (SAM), in absolute values (192 months). The correctly classified individuals are in gray and bold, from right to left.
Index SAM
PP
PP x SAM -1 0 1 Total
-1 15 22 27 64
0 21 25 18 64
1 28 17 19 64
Total 64 64 64 192
Table 5. Contingency table (3x3) between the Rio Grande do Sul Coastal Plain (RGSCP) south coast precipitation anomalies (PP) and the Multivariate ENSO Index (MEI), in absolute values (192 months). The correctly classified individuals are in gray and bold, from left to right.
Index MEI
PP
PP x MEI -1 0 1 Total
-1 27 14 23 64
0 21 26 17 64
1 16 24 24 64
Total 64 64 64 192
Table 6. Contingency table (3x3) between the Rio Grande do Sul Coastal Plain (RGSCP) central coast precipitation anomalies (PP) and the Multivariate ENSO Index (MEI), in absolute values (192 months). The correctly classified individuals are in gray and bold, from right to left.
Index MEI
PP
PP x MEI -1 0 1 Total
-1 18 20 26 64
0 17 26 21 64
1 29 18 17 64
Total 64 64 64 192
Table 7. Contingency table (3x3) between the Rio Grande do Sul Coastal Plain (RGSCP) central coast precipitation anomalies (PP) and the Multivariate ENSO Index (MEI), in absolute values (192 months). The correctly classified individuals are in gray and bold, from left to right.
Index MEI
PP
PP x MEI -1 0 1 Total
-1 27 17 20 64
0 18 25 21 64
1 19 22 23 64
Total 64 64 64 192
Table 8. Contingency table (3x3) between the Rio Grande do Sul Coastal Plain (RGSCP) north coast precipitation anomalies (PP) and Southern Annular Mode (SAM), in absolute values (192 months). The correctly classified individuals are in gray and bold, from right to left.
Index SAM
PP
PP x SAM -1 0 1 Total
-1 19 22 23 64
0 18 25 21 64
1 27 17 20 64
DISCUSSIONS
The south coast had the lowest total precipitation during the studied period and also the lowest annual mean, while the north coast had the highest annual volumes of precipitation in the RGSCP. According to Viana (2009), the RGSCP is the area that registers the lowest precipitation volumes in southern Brazilian region, and its south coast has the highest standard deviations for the annual precipitation. The south coast is the driest section in the summer, winter and spring, while in autumn is the area with highest precipitation. The central coast is the area with the highest precipitation in the summer. We identified anomalous precipitation events in RGSCP during the 1998-2013 period: 7 in the overall RGSCP series, 7 in the south coast, 7 in the central coast and 5 in the north. Generally, these anomaly events begin in the spring lasting until the end of the summer, in sometimes may start in winter.
The north coast PP do not correlate with the SAM index, however, both the central, south and the RGSCP precipitation show a significant negative correlation with this index, particularly with the SAM+. Carvalho, Jones and Ambrizzi (2005) stated that the SAM+ (SAM-) dominates if the SST and the humidity convection resemble LN (EN) phase or/and when there is an increase (decrease) in the tropical intraseasonal variability, on a sub monthly scale. Gillett, Kell and Jones (2006) emphasize that between the mid and high latitudes with SAM+ (SAM-), pressure gradients are steep (attenuated), changing the westerly winds directions and intensifying (weakening) their velocity over the Southern Ocean. According to Silvestri and Vera (2003), when there are anomalous low frequency anticyclones (cyclones) over the SA southeast, with a SAM+ (SAM-), cyclones activity is reduced (increased) and also the precipitation reduced (increased) over this region, reinforcing the importance of our results that point out to an increase in the drought events in the RGSCP during SAM+. For several researchers (e.g. THOMPSON; WALLACE, 2000; THOMPSON; SOLOMON, 2002; MARSHALL et al., 2004; GUPTA; ENGLAND, 2006; LIM et al., 2016) the the increase of emissions of greenhouse gases has intensified the SAM+ frequency in the last 50 years, which amplifies the westerly winds over the Southern Ocean, reducing the subtropical winds velocity. This trend is probably related to the depletion of stratospheric ozone (i.e., the ozone “hole”) over Antarctica (GARREAUD et al., 2009).
Garreaud et al. (2009) reported that a decrease in the precipitation in the eastern SA coastal region, during a positive SAM, is associated a zonal flux reduction in mid latitudes.
According to Lim et al. (2016) the precipitation anomalies in the subtropical regions, related to SAM+, acts differently in the winter and summer. While in summer the SAM+ is related to increased precipitation on subtropical regions, in winter it has reduced. This means that the trend towards longer periods of SAM+ will attenuate the summer droughts in the subtropical regions, but will increase them in the winter. In the case of the study area, this information allows to deduce that we will have more rainy summers, while the winters will be drier. If we consider the tendency to drought periods in the subtropical regions (LIM et al., 2016), associated to the increase in the trend towards SAM+, it is possible to analyze the largest number of PP- events in the studied series as a possible sign of environmental change
in the next decades in RGSCP. When observing the seasonal patterns of precipitation in the different regions of the RGSCP, we noticed that the south coast have a precipitation below the average of summer and winter of the RGSCP in almost every series, unlike the north and central coasts. This may mean that negative precipitation anomalies on the south coast related to the intensification of the SAM + periods are not conditioned by seasonality, as stated Lim et al. (2016).
Grimm and Tedeschi (2009) emphasize that precipitation during EN and LN events is not homogeneous in southern SA, excepting in southern Brazil. In southern Brazil, EN (LN) can increase (decrease) the precipitation due to the increment (weakening) of the subtropical jet in the spring, with the formation of cyclones and anticyclones in this region, where is more frequent PP- events related to a MEI- than PP+ events associated with a MEI+ (GRIMM et al., 1998), our results agree with these observations. Penalba and Rivera (2016) emphasize the influence of periods of drought during periods of La Niña in the study area. According to Fernandes and Rodrigues (2018), the eastern Santa Catarina state, which is northern of north coast of the PCRGS (and also has influence of the orography), has not shown a relationship between extreme precipitation events and ENSO in the period between 2000 and 2015, in agreement with what was found here. The extreme events between 2000 e 2015, in the eastern of Santa Catarina, are more related to frontal systems and South Atlantic Convergence Zone (SACZ). Thus, it is possible to consider that, even if SAM and ENSO influence precipitation events on the north coast of the RGSCP, perhaps the orographic rain, frontal systems and SACZ are preponderant (THOFEHRN; ROCHA, 1979; ROE, 2005; FERNANDES; RODRIGUES, 2018). Indeed, the high evaporation on the Patos Lagoon, in the central coast, can induce anomalies precipitation through convective rain.
CONCLUSIONS
The precipitation in the RGSCP is not well distributed in its three regions, or seasonally. Precipitation peaks and minima were more pronounced at the beginning of the study period, after 2005 the amplitude decreased and variability increased. It is also possible to identify the relationship between the precipitation highs and lows with EN and LN events and SAM phases.
So, we identified 7 events, on average, of positive or negative PP in the 1998-2013 series for the RGSCP, indicating that these events are developed preferentially along a spring and the following summer, and secondarily it can begin in late winter extending into the summer. Central and south coasts had more events than the north coast, although proportionally the three regions have more negative precipitation events that positively ones.
by the presence of Patos Lagoon, which serves as a source of moisture for convective rainfall. These results and local geographic observations elucidate the importance of considering as inherent regional characterstics, which can alter rainfall totals, as well as many other climatic variables.
The south coast is the only one of the regions that showed a statistical correlation between the PP with SAM and MEI, as well the RGSCP precipitation anomalies.
The results obtained here contribute to these assertions, although the poor distribution of meteorological stations along the RGSCP makes it more convenient to use satellite estimates. The use of satellite estimation has the time limiter, which does not allow the elaboration of an effective climatology, but allows observing a robust mensal spatialization results, which is effective in a regional study.
Several researches have shown possible trends in the precipitation patterns of the subtropical regions of the SH, and this study makes it possible to observe these same trends on a regional scale. For the series studied it is possible observe an association between SAM and ENSO during anomalous precipitation events, especially in periods of below-average precipitation and SAM+ and La Niña.
It is necessary to perform an equal analysis for different geographic regions, thus allowing a better understanding of how regional characteristics may influence or not the study of precipitation events and the statistical response of their relation with climate indexes, such as ENSO and SAM.
ACKNOWLEDGEMENTS
The authors thank the Brazilian National Council for Scientific and Technological Development (CNPq), state of Rio Grande do Sul Research Support Foundation (FAPERGS) and the Brazilian National Institute of Science and Technology of the Cryosphere (INCT da Criosfera) for technical and financial support.
REFERENCES
AGHAKOUCHAK, A.; MEHRAN, A. Extended contingency table: Perfomance metrics for satellite observations and climate models simulations. Water Resources Research, v. 9, n. 10, p. 7144-7149, 2013. http://dx.doi.org/10.1002/wrcr.20498.
CALLIARI, L. J.; KLEIN, A. H. F. Características morfodinâmicas e sedimentológicas das praias oceânicas entre Rio Grande e Chuí, RS. Pesquisas em Geociências, v. 20, n. 1, p. 48-56, 1993.
CARRARO, C. C.; GAMERMANN, N.; EICK, N. C.; BORTOLUZZI, C. A.; JOST, H.; PINTO, J. F. Mapa Geológico do Estado do Rio Grande do Sul, Scale 1: 1 000 000. Porto Alegre: Instituto de Geociências, UFRGS, 1974.
CARVALHO, L. M. J.; JONES, C.; AMBRIZZI, T. Opposite Phases of Antartic Oscillation and the relationships with intraseasonal to interannual activity in the tropics during the austral summer. Journal of Climate, v. 18, n. 5, p. 702-718, 2005. http://dx.doi. org/10.1175/JCLI-3284.1.
FERNANDES, L. G.; RODRIGUES, R. R. Changes in the patterns of extreme raifall events in southern Brazil. International Journal of Climatology, v. 38, n. 3, p. 1337-1352, 2018. http://dx.doi. org/10.1002/joc.5248.
FRANCHITO, S. H.; RAO, V. B.; VASQUES, A. C.; SANTO, C. M. E.; CONFORTE, J. C. Validation of TRMM precipitation radar monthly rainfall estimates over Brazil. Journal of Geophysical Research, v. 114, n. 2, p. 1-9, 2009. http://dx.doi.org/10.1029/2007JD009580.
GARREAUD, R. D.; VUILLE, M.; COMPAGNUCCI, R.; MARENGO, J. Present-day South American climate. Palaeogeography, Palaeoclimatology, Palaeoecology, v. 281, n. 3-4, p. 180-195, 2009. https:// doi.org/10.1016/j.palaeo.2007.10.032.
GILLETT, N. P.; KELL, T. D.; JONES, P. D. Regional climate impacts of the Southern Annular Mode. Geophysical Research Letters, v. 33, n. 23, p. L23704, 2006. http://dx.doi.org/10.1029/2006GL027721.
GONG, D.; WANG, S. Definition of Antarctic Oscillation index. Geophysical Research Letters, v. 26, n. 4, p. 459-462, 1999. http:// dx.doi.org/10.1029/1999GL900003.
GRIMM, A. M.; FERRAZ, S. E. T.; GOMES, J. Precipitation anomalies in Southern Brazil associated with El Niño and La Niña events. Journal of Climate, v. 11, n. 11, p. 2863-2880, 1998. http://dx.doi.org/10.1175/1520-0442(1998)011<2863:PAISB A>2.0.CO;2.
GRIMM, A. M.; TEDESCHI, R. G. ENSO Extreme Events in South America. Journal of Climate, v. 22, n. 7, p. 1589-1609, 2009. http://dx.doi.org/10.1175/2008JCLI2429.1.
GUPTA, A. S.; ENGLAND, M. H. Coupled ocean-atmosphere-ice response to variations in the Southern Annular Mode. Journal of Climate, v. 19, n. 18, p. 4457-4486, 2006. http://dx.doi.org/10.1175/ JCLI3843.1.
HAIR, J. F.; BLACK, W. C.; BABIN, B. J.; ANDERSON, R. E.; TATHAN, R. L. Análise Multivariada de Dados. Porto Alegre: Bookman, 2009. 687p.
LASG – NATIONAL KEY LABORATORY OF NUMERICAL MODELING FOR ATMOSPHERIC SCIENCES AND GEOPHYSICAL FLUID DYNAMICS; Institute of Atmospheric Physics – IAP. Monthly Souther Annular Mode (SAM) Index or Antartic Oscillation (AAO) Index. Beijing, China: LASG, 2018. Available from: <http://ljp.gcess.cn/dct/page/65609>. Access on: 14 Mar. 2018.
LIM, E.; HENDON, H. H.; ARBLASTER, J. M.; DELAGE, F.; NGUYEN, H.; MIN, S.; WHEELER, M. C. The impact of the Southern Annular Mode on future changes in Southern Hemisphere rainfall. Geophysical Research Letters, v. 43, n. 13, p. 7160-7167, 2016. http://dx.doi.org/10.1002/2016GL069453.
changes in the Southern Hemisphere. Geophysical Research Letters, v. 31, n. 14, 2004. http://dx.doi.org/10.1029/2004GL019952.
MASON, S. J.; GODDARD, L. Probabilist Precipitation Anomalies Associated with ENSO. Bulletin ofthe American Meteorological Society, v. 82, n. 4, p. 619-638, 2001.
NAN, S.; LI, J. The relationship between the summer precipitation in the Yangtze River valley and the boreal spring Southern Hemisphere annular mode. Geophysical Research Letters, v. 30, n. 24, 2003. http://dx.doi.org/10.1029/2003GL018381.
NIMMER, E. Clima. In: INSTITUTO BRASILEIRO DE GEOGRAFIA E ESTATÍSTICA – IBGE. Geografia do Brasil,
Região Sul. Rio de Janeiro: SESGRAF-IBGE, 1977. p. 35-79.
NOAA – NATIONAL OCEANIC & ATMOSPHERIC ADMINISTRATION; U.S. DEPARTMENT OF COMMERCE. Multivariate ENSO Index. Boulder: NOAA, 2014. Available from: <https://www.esrl.noaa.gov/psd/enso/mei>. Access on: 14 Nov. 2014.
PAZ, A. R.; COLLISCHONN, W. Avaliação de estimativas de campos de precipitação para modelagem hidrológica distribuída. Revista Brasileira de Meteorologia, v. 26, n. 1, p. 109-120, 2011. http:// dx.doi.org/10.1590/S0102-77862011000100010.
PENALBA, O. C.; RIVERA, J. A. Precipitaion response to El Niño/La Niña events in Southern South America - emphasis in regional drought occurences. Advances in Geosciences, v. 42, p. 1-14, 2016. http://dx.doi.org/10.5194/adgeo-42-1-2016.
POMPA-GARCÍA, M.; NÉMIGA, X. A. ENSO index teleconnection with seasonal precipitation in a temperate ecossystem of northern of Mexico. Atmosfera, v. 28, n. 1, p. 45-30, 2015. http://dx.doi. org/10.20937/ATM.2015.28.01.04.
REBOITA, M. S.; AMBRIZZI, T.; ROCHA, R. P. Relationship between Southern Annular Mode and Southern Hemisphere atmospheric systems. Revista Brasileira de Meteorologia, v. 24, n. 1, p. 48-55, 2009. http://dx.doi.org/10.1590/S0102-77862009000100005.
ROE, G. H. Orographic precipitation. Earth Planet Sciences, v. 33, n. 1, p. 645-671, 2005. http://dx.doi.org/10.1146/annurev. earth.33.092203.122541.
SILVA, R. P.; CALLIARI, L. J.; TOZZI, H. A. M. The influence of washouts on the erosive susceptibility of the Rio Grande do Sul Coast between Cassino and Chuí Beaches, Southern Brazil. Journal Coastal Research, SI, v. 35, p. 332-338, 2003.
SILVESTRI, G. E.; VERA, C. S. Antarctic Oscillation signal on precipitation anomalies over southeastern South America.
Geophysical Research Letters, v. 30, n. 21, p. 2115, 2003. http://dx.doi. org/10.1029/2003GL018277.
SOARES, A. S. D.; PAZ, A. L.; PICCILLI, D. G. A. Avaliação das estimativas de chuva do satélite TRMM no estado da Paraíba. Revista Brasileira de Recursos Hídricos, v. 21, n. 2, p. 288-299, 2016. http://dx.doi.org/10.21168/rbrh.v21n2.p288-299.
THOFEHRN, H. A.; ROCHA, G. L. Enchentes Sul-Brasileiras: um problema de interface atmosfera, hidrosfera e litosfera. Boletim
Gaúcho de Geografia, Geografia: Ciências dos Sistemas Naturais, v. 7, p. 11-16, 1979.
THOMPSON, D. W. J.; SOLOMON, S. Interpretation of recent Southern Hemisphere climate change. Science, v. 296, n. 5569, p. 895-899, 2002. http://dx.doi.org/10.1126/science.1069270. PMid:11988571.
THOMPSON, D. W. J.; WALLACE, J. M. Annular modes in the extratropical circulation. Part I: month-to-month variability. Journal of Climate, v. 13, p. 1000-1016, 2000. https://doi.org/10.1175/1520-0442(2000)013<1000:AMITEC>2.0.CO;2.
VERA, C. S.; ALVARES, M. S.; GONZALEZ, P. L. M.; LIEBMANN, B.; KILADIS, G. N. Seasonal cycle of precipitation variability in South America on intraseasonal timescales. Climate Dynamics, p. 1-11, 2017. https://doi.org/10.1007/s00382-017-3994-1.
VIANA, D. R. Comportamento Espaço-Temporal da Precipitação na Região Sul do Brasil Utilizando Dados TRMM e SRTM. 2009. 164 f. Dissertação (Mestrado em Sensoriamento Remoto) - Instituto Nacional de Pesquisas Espaciais, São José dos Campos, 2009.
WOLTER, K.; TIMLIN, M. S. El Niño/Southern Oscillation behaviour since 1871 as diagnosed in an extended multivariate ENSO index (MEI.ext). International Journal of Climatology, v. 31, n. 7, p. 1074-1087, 2011. http://dx.doi.org/10.1002/joc.2336.
Authors contributions
Venisse Schossler: author of the doctoral thesis that originates the papper.
Jefferson Cardia Simões: thesis supervisor, technical/scientific reviewer and the english version.
Francisco Eliseu Aquino: reviewer of climate analysis and the portuguese version.